. 2019 Dec 13;10(1):5705.
doi: 10.1038/s41467-019-12872-5.

Molecular determinants of nephron vascular specialization in the kidney

Affiliations

Molecular determinants of nephron vascular specialization in the kidney

David M Barry et al. Nat Commun. .

Abstract

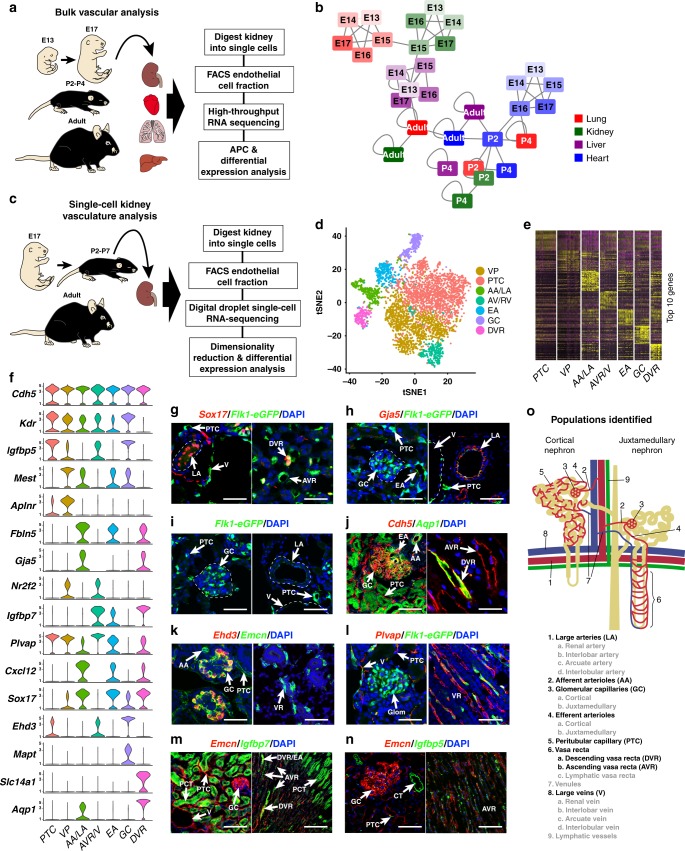
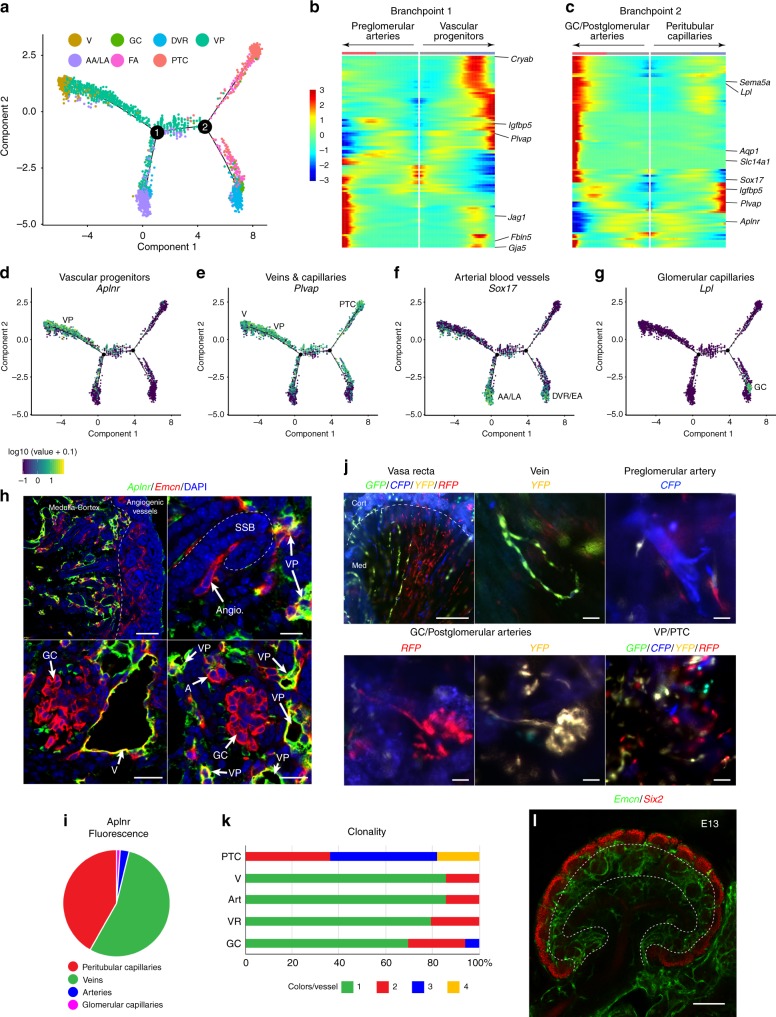
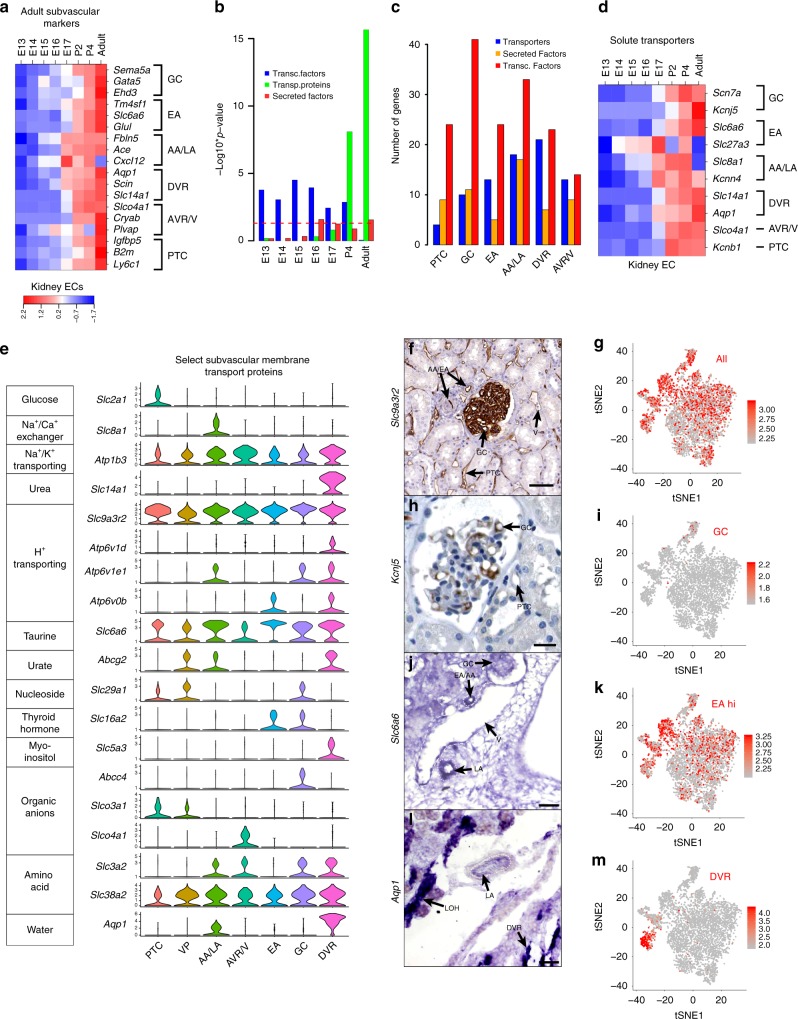
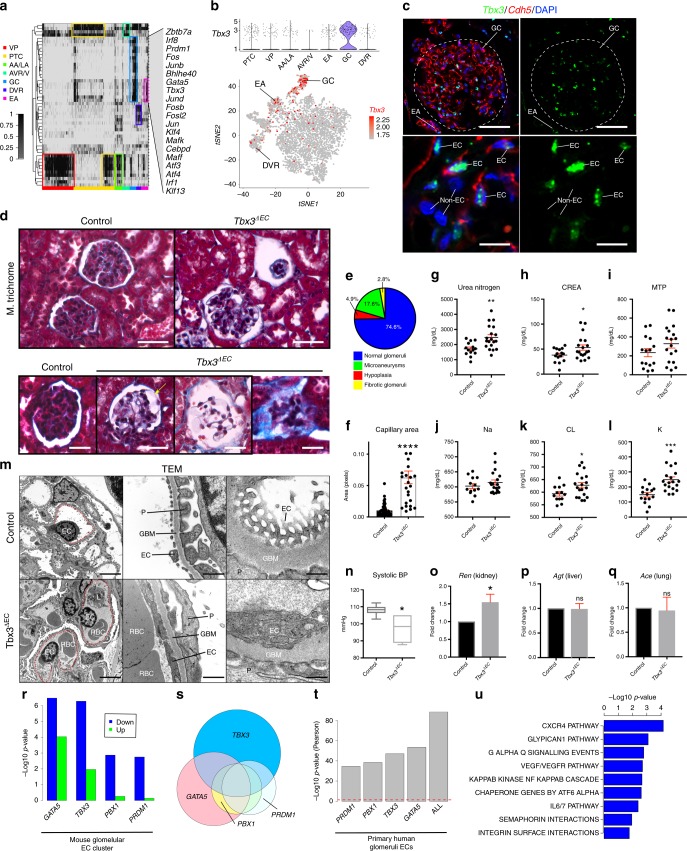
Although kidney parenchymal tissue can be generated in vitro, reconstructing the complex vasculature of the kidney remains a daunting task. The molecular pathways that specify and sustain functional, phenotypic and structural heterogeneity of the kidney vasculature are unknown. Here, we employ high-throughput bulk and single-cell RNA sequencing of the non-lymphatic endothelial cells (ECs) of the kidney to identify the molecular pathways that dictate vascular zonation from embryos to adulthood. We show that the kidney manifests vascular-specific signatures expressing defined transcription factors, ion channels, solute transporters, and angiocrine factors choreographing kidney functions. Notably, the ontology of the glomerulus coincides with induction of unique transcription factors, including Tbx3, Gata5, Prdm1, and Pbx1. Deletion of Tbx3 in ECs results in glomerular hypoplasia, microaneurysms and regressed fenestrations leading to fibrosis in subsets of glomeruli. Deciphering the molecular determinants of kidney vascular signatures lays the foundation for rebuilding nephrons and uncovering the pathogenesis of kidney disorders.


Conflict of interest statement

S.R. is a co-founder and non-paid consultant to Angiocrine BioScience, San Diego CA. The spouse of M.E.C. is a cofounder and shareholder, and serves on the Scientific Advisory Board of Proterris, Inc. All other authors have no conflicts of interest.

Figures

Fig. 1
Fig. 1
RNA sequencing analysis of kidney vascular endothelium throughout development. a Diagram denoting the workflow to sequence the bulk transcriptome of the vasculature throughout development. b Affinity propagation clustering of each stage. Edge lengths are proportional to Euclidean distances. Stages are color-coded according to the organ. c Diagram denoting the workflow to sequence the transcriptome of the vasculature at single-cell resolution. d Clustering of single-cell RNA expression according to a reduced dimensionality (t-SNE) for endothelial cells isolated from the kidneys of E17, P2, P7, and adult mice. VP, vascular progenitor; PTC, peritubular capillary; AA/LA, afferent arteriole/large arteries (pre-glomerular); AVR/V, ascending vasa recta/venous blood vessels; EA, efferent arteriole; GC, glomerular capillaries; DVR, descending vasa recta. e Heat map denoting genes enriched in each single-cell cluster. f Violin plots of normalized scRNA expression profiles of kidney endothelial cells. g Staining validation of Sox17 enriched in arteries in E15 kidneys. Scale bar 50 μm. h Staining validation of Gja5 in arteries except for the efferent arteriole in E15 kidneys. Scale bar 50 μm. i Flk1-eGFP reporter showing lower expression of VEGFR2 in arteries. Images were taken at the same exposure. Scale bar 50 μm. j Aqp1 staining in adult human kidney showing enrichment in afferent/pre-glomerular arterioles, and the descending vasa recta. Endothelial cells were marked with VE-cadherin (Cdh5) staining. Scale bar 100 μm. k FISH staining validation of Ehd3 showing enrichment in glomerular capillaries in E15 embryos. VR, Vasa recta. Scale bar 50 μm. l Staining validation of Plvap in peritubular capillaries, veins, and the ascending vasa recta in E15 kidneys. VR, vasa recta. Scale bar 50 μm. m Staining validations of Igfbp7 in the descending and ascending vasa recta in adult kidneys. Endothelial cells were stained with Endomucin (Emcn). PCT, proximal convoluted tubule. Scale bar left 100 μm, right 200 μm. n Staining validations of Igfbp5 in glomerular capillaries, peritubular capillaries, and the ascending vasa recta. CT, convoluted tubule. Scale bar 100 μm. o Illustration of known vascular subtypes which were identified through ddSEQ. Vascular subtypes not identified are grayed in the text below.
Fig. 2
Fig. 2
Analysis of vascular heterogeneity development. a Pseudotime trajectory of vascular differentiation in the kidney. VP, vascular progenitor; PTC, peritubular capillary; AA/LA, afferent arteriole/large arteries (pre-glomerular); AVR/V, ascending vasa recta/venous blood vessels; EA, efferent arteriole; GC, glomerular capillaries; DVR, descending vasa recta. b Heat maps denoting genes that become differentially expressed as pre-glomerular arteries branch from vascular progenitor cells. Notable genes of venous peritubular progenitor capillaries (Cryab, Igfbp5, Plvap) and arteries (Jag1, Fbln5, Gja5) are shown on the right. c Heat maps denoting genes that become differentially expressed as glomerular capillaries (GC) and postglomerular arteries branch from embryonic progenitor capillaries which mature into peritubular capillaries. Notable genes of glomerular capillaries (Sema5a, Lpl), postglomerular arteries (Aqp1, Slc14a1), and peritubular capillaries (Igfbp5, Plvap) are on the right. dg Pseudo-time trajectory plots denoting the expression of genes enriched in particular vascular clusters. Plots include Aplnr in vascular progenitor cells (VP) (d), Plvap in veins (V), VPs, and peritubular capillaries (PTC)(e), Sox17 in afferent arterioles/large pre-glomerular arteries (AA/LA) and descending vasa recta/efferent arterioles (DVR/EA)(f), and Lpl in glomerular capillaries (GC)(g). h Immunofluorescent staining of the apelin receptor (Aplnr) in E17 kidney. Endothelial cells were stained with endomucin (Emcn). SSB, s-shaped body; VP, vascular progenitor; Angio., angiogenic vessel; GC, glomerular capillary; V, vein; A, arteriole. Scale bars: first panel 40 μm, second panel 5 μm, third and fourth panel 10 μm. i Pie chart denoting mean fluorescent intensity of Aplnr antibody staining in peritibular capillaries, veins, arteries, and glomerular capillaries. n = 3, average of 5 frames of view. j R26R-Confetti E18 mouse kidneys cut in half sagittally after tamoxifen induction at E11. GC, glomerular capillary; PTC, peritubular capillary. Scale bars: first panel 100 μm, second to sixth panel 5 μm. k Bar graph denoting the number of fluorescent reporters found in identified vascular structures. n > 10 for each structure. Art, Arteries; VR, Vasa Recta. l E13 mouse kidney showing the primary vascular plexus exists as generic capillaries (the vascular progenitor cells) before subvascular specification at E14-E15 stages. Dotted lines outline the cortex and medulla. Endothelial cells are stained with endomucin (Emcn) and the outer cortex of the kidney is denoted by Six2 staining of nephron progenitors. Scale bar 100 μm.
Fig. 3
Fig. 3
Transport and transcriptional ontology is zonated in vascular subtypes in the kidney. a Heatmap relating expression profiles (z-scores) of 3 top highly enriched genes to each vascular cluster across 7 developmental stages. VP, vascular progenitor; PTC, peritubular capillary; AA/LA, afferent arteriole/large arteries (pre-glomerular); AVR/V, ascending vasa recta/venous blood vessels; EA, efferent arteriole; GC, glomerular capillaries; DVR, descending vasa recta. b Hypergeometric p-values indicating enrichment of transcription factors, transporters, and secreted proteins in the lists of genes differentially expressed between the kidney and the heart, liver, and lungs at each stage of development. Red dotted line denotes p-values >0.05. c Numbers of transporters, growth factors, and transcription factors found to be differentially expressed in each vascular cluster. d Heatmap relating expression profiles (z-scores) of the top 1 or 2 highly enriched transporters to each vascular cluster across 7 developmental stages. e Violin plots showing the normalized expression level of representative solute transporter genes across the 7 vascular zones of the kidney. Genes shown here were chosen arbitrarily. Y-axis is log scale-normalized read count. f, g Human protein atlas image and tSNE showing an example of a pan-endothelial transporter, Slc9a3r2, in the kidney vasculature. Scale bar 40 μm. AA, afferent arteriole; EA, efferent arteriole; GC, glomerular capillary; V, vein; PTC, peritubular capillary. Patient 2184, image available from v18.1.proteinatlas.org. https://www.proteinatlas.org/ENSG00000065054-SLC9A3R2/tissue/kidney#img. h, i Human protein atlas image and tSNE showing an example of a glomerular capillary transporter, Kcnj5, in the kidney vasculature. Scale bar 10 μm. Patient 1767, image available from v18.1.proteinatlas.org. https://www.proteinatlas.org/ENSG00000120457-KCNJ5/tissue/kidney#img. j, k In situ hybridization and tSNE showing an example of a transporter, Slc6a6, that is pan-endothelial and differentially highly expressed in arterioles. Scale bar 20 μm. l, m In situ hybridization and tSNE showing an example of a transporter, Aqp1, that differentially expressed in the DVR and large arteries (LA); loop of Henle (LOH). Scale bar 20 μm.
Fig. 4
Fig. 4
Tbx3 is necessary for glomerular morphogenesis and specification. a Heat map denoting SCENIC results. VP, vascular progenitor; PTC, peritubular capillary; AA/LA, afferent arteriole/large arteries (pre-glomerular); AVR/V, ascending vasa recta/venous blood vessels; EA, efferent arteriole; GC, glomerular capillaries; DVR, descending vasa recta. b Violin plot and tSNE showing normalized Tbx3 expression. c Immunofluorescent staining of Tbx3 and VE-cadherin (Cdh5) in adult human glomerular endothelial cells. EC, endothelial cell; Non-EC, non-endothelial cell. Scale bar 50 μm, inset scale bar 10 μm. d Masson’s trichrome staining in control and Tbx3ΔEC. Yellow arrow show microaneurysms. Scale bar 50 μm. e Pie chart for percent of glomeruli possessing microaneurysms, hypoplasia, or fibrosis. f Quantification glomerular capillary area. n = 3 mice, 5 frames/kidney. ***p < 0.0001 unpaired Student t-test. Error bars, standard error of the mean. gl Urine analysis (control n = 15, Tbx3ΔEC n = 19). g Urea nitrogen, h creatinine (CREA), i micro total protein (MTP), j sodium (Na), k chloride (CL), l potassium (K). Normalized to volume. * p < 0.05, **p < 0.01, ***p < 0.001 unpaired Student t-test. Error bars, standard error of the mean. m Transmission electron microscopy (TEM) of control and Tbx3ΔEC. Red dotted line outlines glomerular capillary lumens. P, podocyte; GBM, glomerular basement membrane; EC, endothelial cell; RBC, red blood cell; L, leukocyte. Scale bar 2 μm, inset scale bar 500 nm. n Systolic blood pressure (n = 6 mice/group). *p < 0.05 unpaired Student t-test. Center line = median. Bounds of boxes: the first to third quartile. Whiskers highlight quartile from minimum or maximum. Error bars, standard error of the mean. oq qPCR of Renin (Ren), Angiotensinogen (Agt), and Angiotensin-converting enzyme (Ace) transcripts (kidneys, liver, and lung, respectively). n = 4 mice each group. *p < 0.05 unpaired Student t-test. Error bars, standard error of the mean. r Hypergeometric test p-values (−1*log10) for overlap between mouse glomerular genes (scRNA sequencing) and genes down (blue) or up (green) regulated upon overexpression of the indicated transcription factors. EC, endothelial cell. s Euler plot illustrating overlap between glomerulus genes downregulated with overexpression with transcription factor. t Hypergeometric test p-values (−1*log10) for overlap between human glomerular-specific genes (human glomerular endothelial cells) and genes downregulated upon overexpression of the indicated transcription factors (ALL = all 4 TF’s). EC, endothelial cell. Red dotted line denotes p-value >0.05. u Pathway enrichment analysis after over expression of Tbx3, Gata5, Prdm1, and Pbx1.

Similar articles

Cited by

References

    1. Augustin Hellmut G., Koh Gou Young. Organotypic vasculature: From descriptive heterogeneity to functional pathophysiology. Science. 2017;357(6353):eaal2379. doi: 10.1126/science.aal2379. - DOI - PubMed
    1. Nolan DJ, et al. Molecular signatures of tissue-specific microvascular endothelial cell heterogeneity in organ maintenance and regeneration. Dev. Cell. 2013;26:204–219. doi: 10.1016/j.devcel.2013.06.017. - DOI - PMC - PubMed
    1. Vanlandewijck M, et al. A molecular atlas of cell types and zonation in the brain vasculature. Nature. 2018;554:475–480. doi: 10.1038/nature25739. - DOI - PubMed
    1. Grabias BM, Konstantopoulos K. The physical basis of renal fibrosis: effects of altered hydrodynamic forces on kidney homeostasis. Am. J. Physiol. Renal. Physiol. 2014;306:F473–F485. doi: 10.1152/ajprenal.00503.2013. - DOI - PubMed
    1. Danziger J, Zeidel ML. Osmotic homeostasis. Clin. J. Am. Soc. Nephrol. 2015;10:852–862. doi: 10.2215/CJN.10741013. - DOI - PMC - PubMed

Publication types

MeSH terms

Substances