. 2019 Dec 13;10(1):5694.
doi: 10.1038/s41467-019-13614-3.

Gene therapy for progressive familial intrahepatic cholestasis type 3 in a clinically relevant mouse model

Affiliations

Gene therapy for progressive familial intrahepatic cholestasis type 3 in a clinically relevant mouse model

Nicholas D Weber et al. Nat Commun. .

Abstract

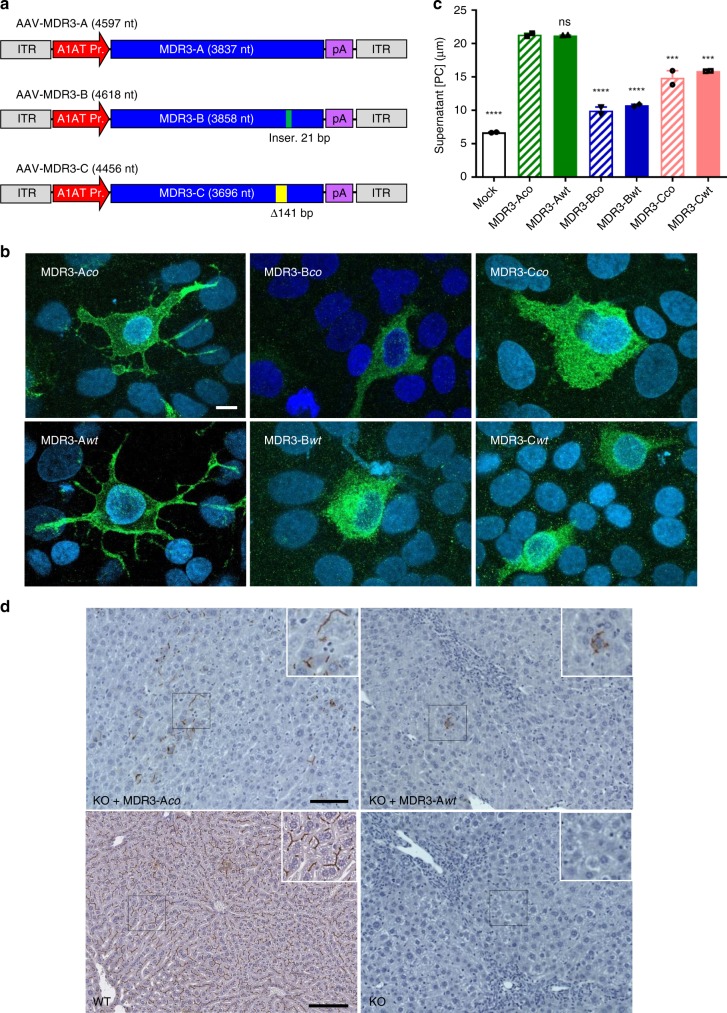
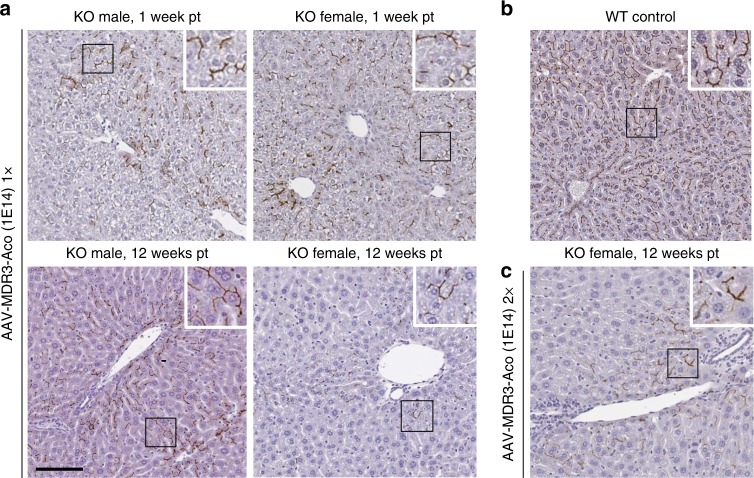
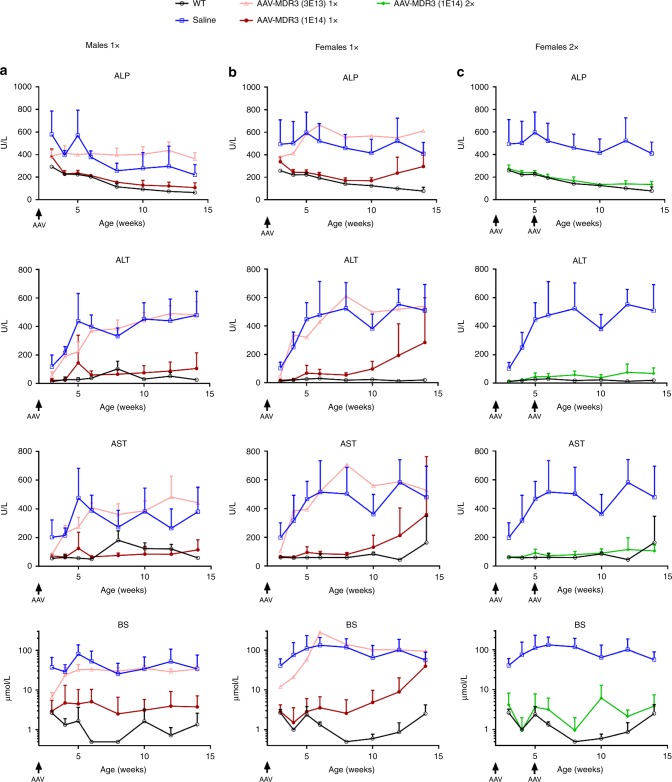
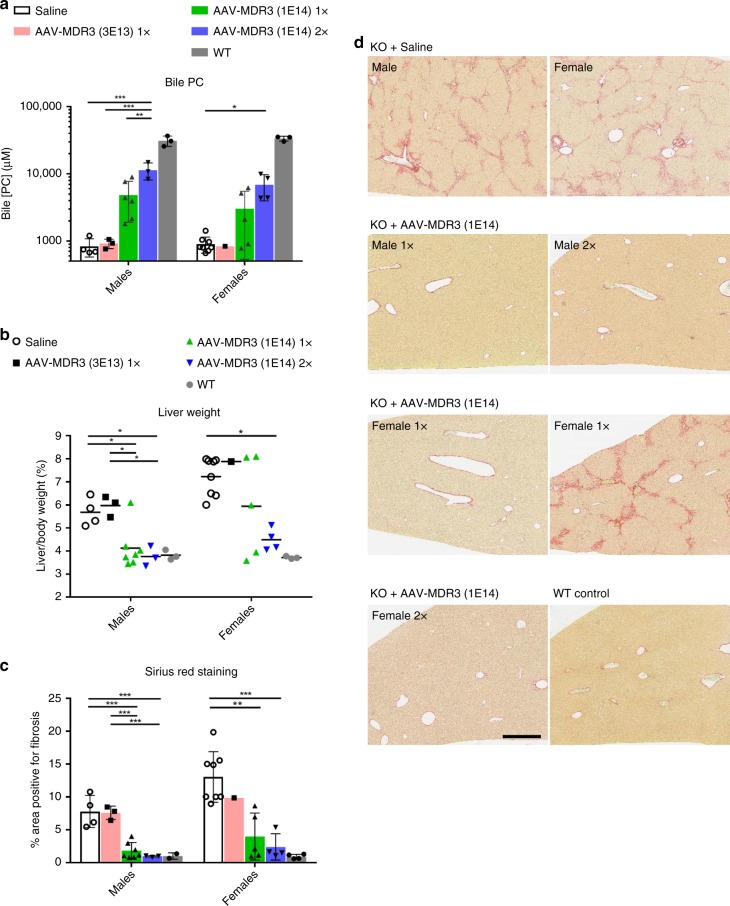
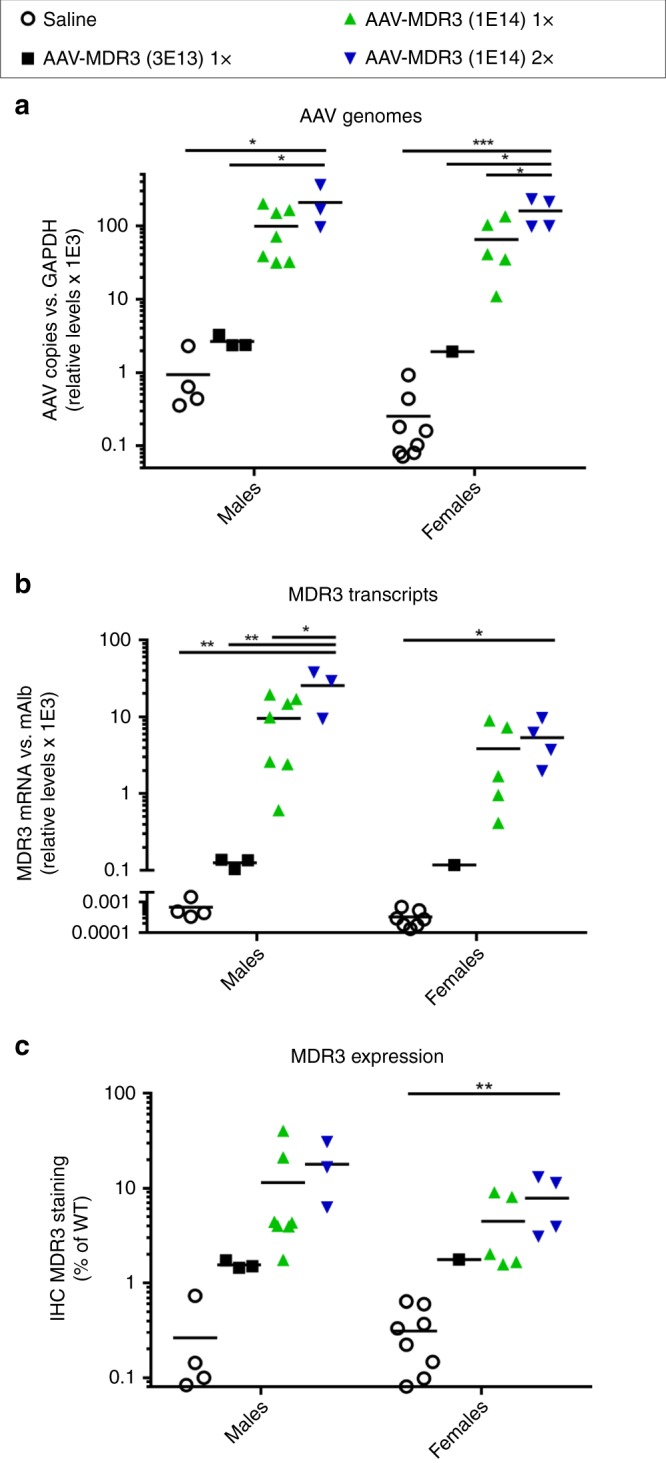
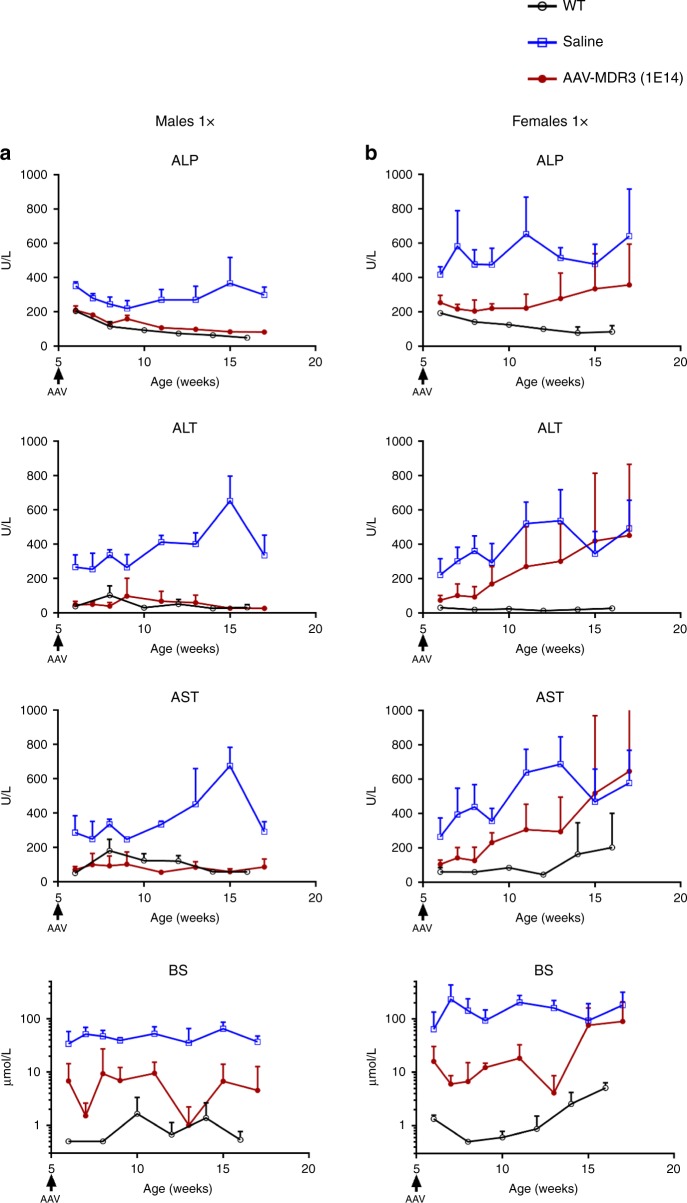
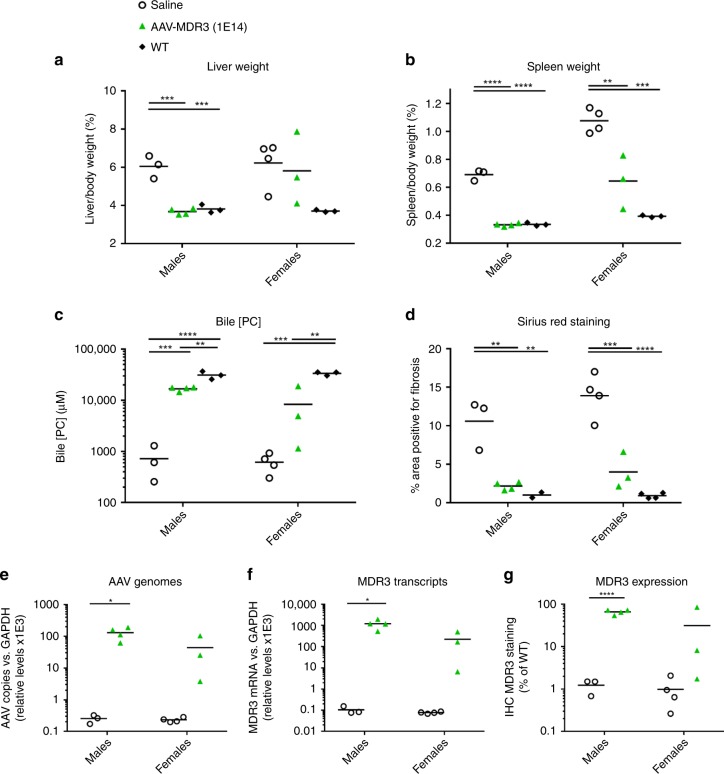
Progressive familial intrahepatic cholestasis type 3 (PFIC3) is a rare monogenic disease caused by mutations in the ABCB4 gene, resulting in a reduction in biliary phosphatidylcholine. Reduced biliary phosphatidylcholine cannot counteract the detergent effects of bile salts, leading to cholestasis, cholangitis, cirrhosis and ultimately liver failure. Here, we report results from treating two- or five-week-old Abcb4-/- mice with an AAV vector expressing human ABCB4, resulting in significant decreases of PFIC3 disease biomarkers. All male mice achieved a sustained therapeutic effect up through 12 weeks, but the effect was achieved in only 50% of females. However, two-week-old females receiving a second inoculation three weeks later maintained the therapeutic effect. Upon sacrifice, markers of PFIC3 disease such as, hepatosplenomegaly, biliary phosphatidylcholine and liver histology were significantly improved. Thus, AAV-mediated gene therapy successfully prevented PFIC3 symptoms in a clinically relevant mouse model, representing a step forward in improving potential therapy options for PFIC3 patients.


Conflict of interest statement

Drs. Weber, Ferrer, Douar, Bénichou, and González-Aseguinolaza are all employees of Vivet Therapeutics, a startup biopharmaceutical company developing gene therapy approaches for treatment of rare metabolic diseases. All other authors declare no competing interests.

Figures

Fig. 1
Fig. 1. AAV-MDR3 vectors and analysis of plasmid expression.
a Diagrams of AAV vectors expressing MDR3 isoforms A–C downstream of the alpha-1 anti-trypsin promoter (A1AT Pr.). Insertion (Inser.) and deletion (Δ) present in isoforms B and C, respectively, are indicated. ITR, AAV inverted terminal repeats; pA, synthetic polyadenylation signal. b MDR3 expression in vitro. HuH-7 cells were transfected with AAV plasmids containing the indicated MDR3 isoform and analysed at 48 h by confocal immunofluorescence with an antibody specific against MDR3. For MDR3-Aco and MDR3-Awt, images correspond to representative serial planes of MDR3-positive cells showing clear membrane-localized expression. For isoforms MDR3-B and C, images showed a combination of all planes since no membrane staining was observed in any plane. Nuclei were stained with DAPI. Scale bar = 10 μm. c MDR3 activity in vitro. PC concentration in the supernatant of cells transfected with AAV plasmids was quantified by fluorometric assay. Cells transfected with a GFP-expressing plasmid served as negative control (mock). Equivalent transfection efficiencies were verified via qPCR with primers specific for A1AT promoter. Labels above individual bars indicate significance relative to MDR3-Aco (one-way ANOVA/Tukey’s multiple comparisons test): ns, not significant, ***, p < 0.001; ****, p < 0.0001. Data are presented as mean ± standard deviation (SD). F values and degrees of freedom (numerator, denominator): F(6,7) = 151.1. Source data are provided as a Source Data file. d MDR3 expression in vivo. Abcb4−/− mice (KO) were HDI injected with AAV plasmids harbouring the indicated MDR3-A gene variant, and MDR3 expression was analysed by IHC with an anti-MDR3-specific antibody 24 h later. Abcb4+/+ (WT) and non-treated KO mice were used as positive and negative controls, respectively. Representative pictures from one mouse in each group are shown. Scale bar = 100 μm.
Fig. 2
Fig. 2. Analysis of AAV-MDR3-Aco expression in Abcb4−/− mice.
Two-week-old Abcb4−/− mice (KO) mice received one (a) or two (c) doses of 1 × 1014 VG/kg of AAV-MDR3-Aco, and MDR3 expression was analysed at the indicated times after the first dose (pt) by IHC with an anti-MDR3-specific antibody. In c, the second dose was given when mice were 5 weeks old. A female WT mouse is shown as positive control for MDR2 staining (b). Representative pictures from one mouse in each group are shown. Scale bar = 100 μm.
Fig. 3
Fig. 3. Serum biomarker levels for AAV-MDR3-Aco-treated Abcb4−/− mice through 12 weeks.
The therapeutic effect of AAV treatment is shown in males (a) and females (b & c) that were treated with AAV-MDR3-Aco at 3 × 1013 VG/kg one time (1×, pink, open triangles; n = 3 M (males)/1 F (females)), at 1 × 1014 VG/kg one time (1×, red, filled circles; n = 7 M/6 F), or at 1 × 1014 VG/kg two times (2×, green, filled diamonds; n = 5 F) using as controls saline-treated (blue, open squares; n = 4 M/8 F) and untreated Abcb4+/+ (WT) mice (black, open circles; n = 3 M/3 F). Data are presented as mean + SD. ALP alkaline phosphatase, ALT alanine transaminase, AST aspartate transaminase, BS bile salts. Source data are provided as a Source Data file.
Fig. 4
Fig. 4. Biliary PC and evidence of cholestasis for Abcb4−/− mice treated with AAV-MDR3-Aco.
At the time of sacrifice, PC concentration in bile (a) and liver weight as a percent of body weight (b) were measured for Abcb4−/− mice treated with AAV-MDR3-Aco at 3 × 1013 VG/kg 1× (pink bars or black squares; n = 3 M/1 F), at 1 × 1014 VG/kg 1× (green bars or green triangles; n = 7 M/5 F), or at 1 × 1014 VG/kg 2× (blue bars or blue inverted triangles; n = 3 M/4 F), as well as saline-treated controls (white bars or open circles; n = 4 M/8 F) and untreated WT mice (grey bars or grey circles; n = 3 M/3 F). Liver sections were stained with picrosirius red to indicate fibrosis (d) and the amount of tissue with red staining was quantified (c). Representative pictures from one mouse in each group are shown, except for females treated 1× at 1 × 1014 VG/kg, for which one animal each from both responder (left image) and non-responder (right image) groups is shown. Scale bar = 500 μm. Statistics (one-way ANOVA/Tukey’s multiple comparisons test): *, p < 0.05; **, p < 0.01; ***, p < 0.001; data are presented as mean ± SD; F values and degrees of freedom (numerator, denominator): a males: F(3,12) = 14.52, females: F(3,15) = 4.58; b males: F(3,13) = 8.548, females: F(3,14) = 4.501; c males: F(3,13) = 23.13, females: F(3,14) = 11.58. Source data are provided as a Source Data file.
Fig. 5
Fig. 5. AAV transduction and transgene expression for Abcb4−/− mice treated with AAV-MDR3-Aco.
The levels of AAV genomes (a), MDR3 mRNA transcripts (b), and MDR3 protein expression (c) were quantified from liver tissue harvested from Abcb4−/− mice treated with AAV-MDR3-Aco at 3 × 1013 VG/kg 1× (black squares), at 1 × 1014 VG/kg 1× (green triangles), or at 1 × 1014 VG/kg 2× (blue inverted triangles), as well as saline-treated controls (open circles). AAV genomes and MDR3 transcripts were quantified via qPCR and RT-qPCR, respectively, and protein expression was quantified as the percent area of tissue that stained positive for MDR3 expression and normalized to levels in WT mice. Animals were sacrificed between 12 and 16 weeks after treatment. Statistics (one-way ANOVA/Tukey’s multiple comparisons test): *, p < 0.05; **, p < 0.01; ***, p < 0.001; data are presented as mean ± SD; F values and degrees of freedom (numerator, denominator): a males: F(3,13) = 6.057, females: F(3,14) = 12.74; b males: F(3,13) = 7.59, females: F(3,13) = 4.135; c males: F(3,13) = 2.073, females: F(3,14) = 5.696. Source data are provided as a Source Data file.
Fig. 6
Fig. 6. Serum biomarker levels for Abcb4−/− mice treated at 5 weeks of age with AAV-MDR3-Aco.
The therapeutic effect of AAV treatment is shown in males (a) and females (b) that were treated with AAV-MDR3-Aco at 1 × 1014 VG/kg one time (1×, red, filled circles; n = 4 M/4 F), using as controls saline-treated (blue, open squares; n = 3 M/4 F) and untreated Abcb4+/+ (WT) mice (black, open circles; n = 3 M/3 F). Data are presented as mean + SD. ALP alkaline phosphatase, ALT alanine transaminase, AST aspartate transaminase, BS bile salts. Source data are provided as a Source Data file.
Fig. 7
Fig. 7. PFIC3 disease parameters in Abcb4−/− mice treated at 5 weeks of age with AAV-MDR3-Aco.
At the time of sacrifice, liver (a) and spleen (b) weight as a percent of body weight, PC concentration in bile (c), liver fibrosis (d), AAV genomes (e), MDR3 transcripts (f), and MDR3 protein expression (g) were measured for Abcb4−/− mice treated with AAV-MDR3-Aco at 1 × 1014 VG/kg 1× (green triangles; n = 4 M/3 F), and saline-treated controls (open circles; n = 3 M/4 F) and untreated WT mice (black diamonds; n = 3 M/3 F). Animals were sacrificed 12 weeks after treatment. Statistics (one-way ANOVA/Tukey’s multiple comparisons test): *, p < 0.05; **, p < 0.01; ***, p < 0.001, ****, p < 0.0001. a–d F values and degrees of freedom (numerator, denominator): a males: F(2,7) = 44.52, females: F(2,7) = 3.558; b males: F(2,7) = 265.5, females: F(2,7) = 30.81; c males: F(2,7) = 69.93, females: F(2,7) = 35.8; d males: F(2,6) = 21.02, females: F(2,8) = 39.88. e–g Unpaired t test (t-value and degree of freedom): e males: (t = 3.938, df = 5), females: (t = 1.737 df = 5); f males: (t = 3.557, df = 5), females: (t = 1.836, df = 5); g males: (t = 12.61, df = 5), females: (t = 1.37, df = 5). Source data are provided as a Source Data file.

References

    1. Davit-Spraul, A., Gonzales, E., Baussan, C. & Jacquemin, E. Progressive familial intrahepatic cholestasis. Orphanet J. Rare Dis.4, 1 (2009). - PMC - PubMed
    1. Borst P, Zelcer N, van Helvoort A. ABC transporters in lipid transport. Biochim. Biophys. Acta. 2000;1486:128–144. doi: 10.1016/S1388-1981(00)00053-6. - DOI - PubMed
    1. Jacquemin E, et al. The wide spectrum of multidrug resistance 3 deficiency: from neonatal cholestasis to cirrhosis of adulthood. Gastroenterology. 2001;120:1448–1458. doi: 10.1053/gast.2001.23984. - DOI - PubMed
    1. Gonzales, E., Spraul, A. & Jacquemin, E. Clinical utility gene card for: progressive familial intrahepatic cholestasis type 3. Eur. J. Hum. Genet.22, 572 (2014). - PMC - PubMed
    1. Jacquemin E, et al. Ursodeoxycholic acid therapy in pediatric patients with progressive familial intrahepatic cholestasis. Hepatology. 1997;25:519–523. doi: 10.1002/hep.510250303. - DOI - PubMed

Publication types

MeSH terms

Substances

Supplementary concepts