. 2019 Dec 13;10(1):5699.
doi: 10.1038/s41467-019-13575-7.

The SIGMA rat brain templates and atlases for multimodal MRI data analysis and visualization

Affiliations

The SIGMA rat brain templates and atlases for multimodal MRI data analysis and visualization

D A Barrière et al. Nat Commun. .

Abstract

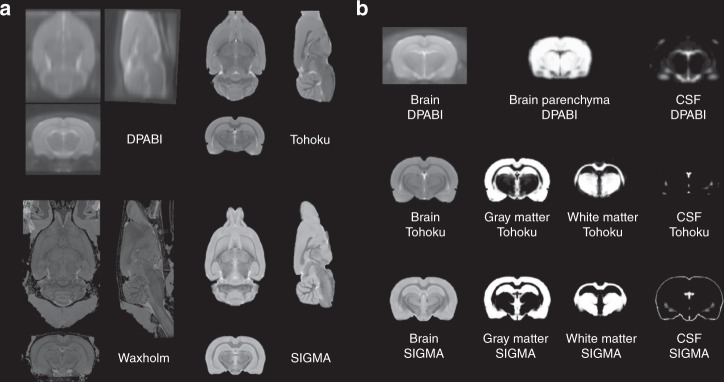
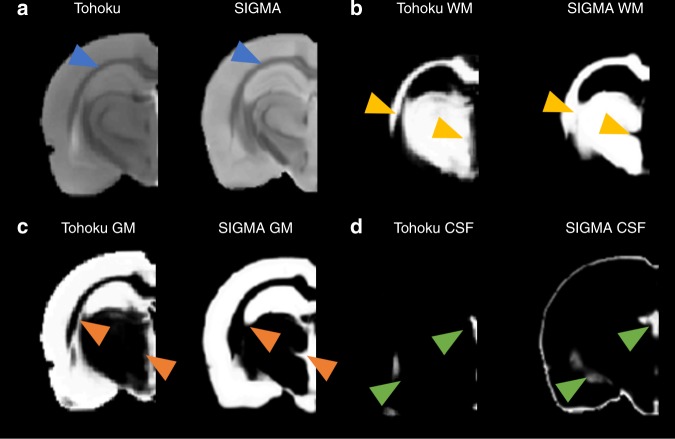
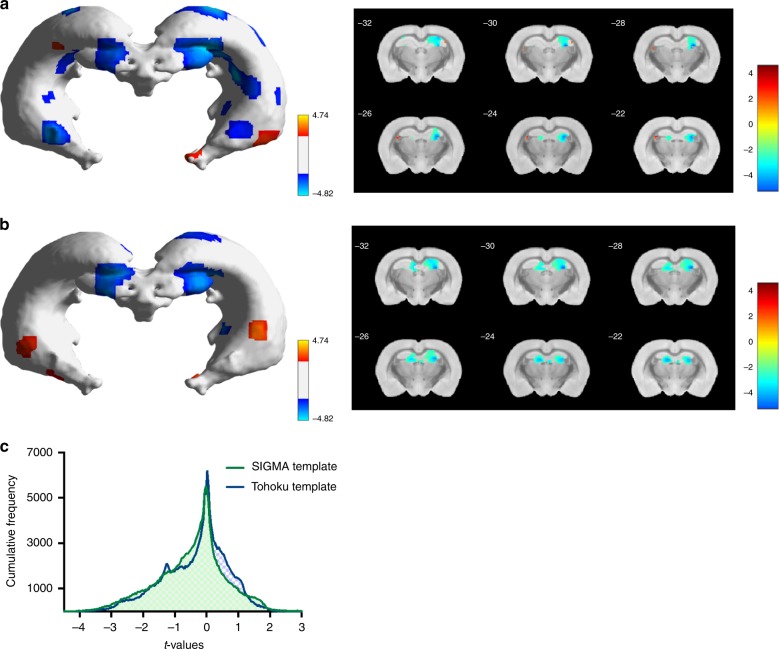
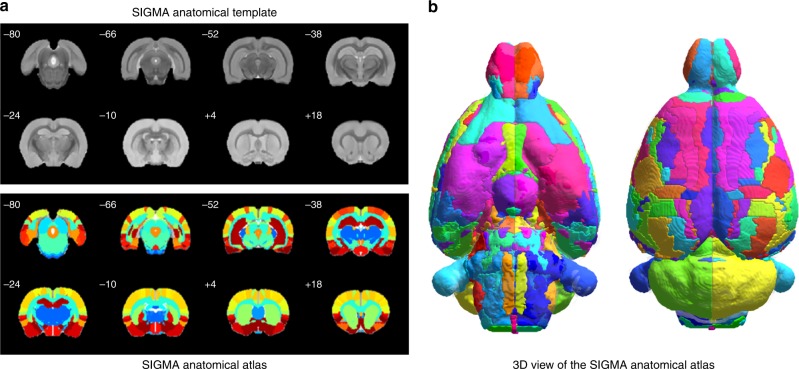
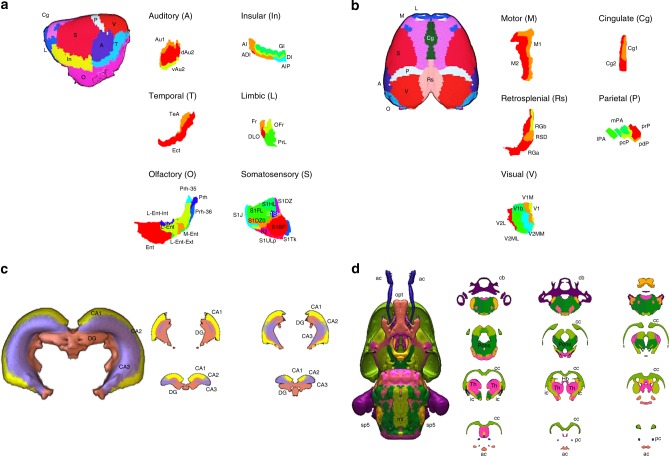
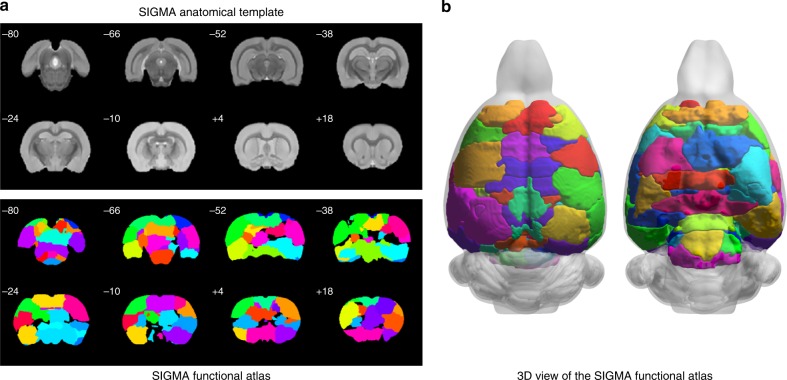
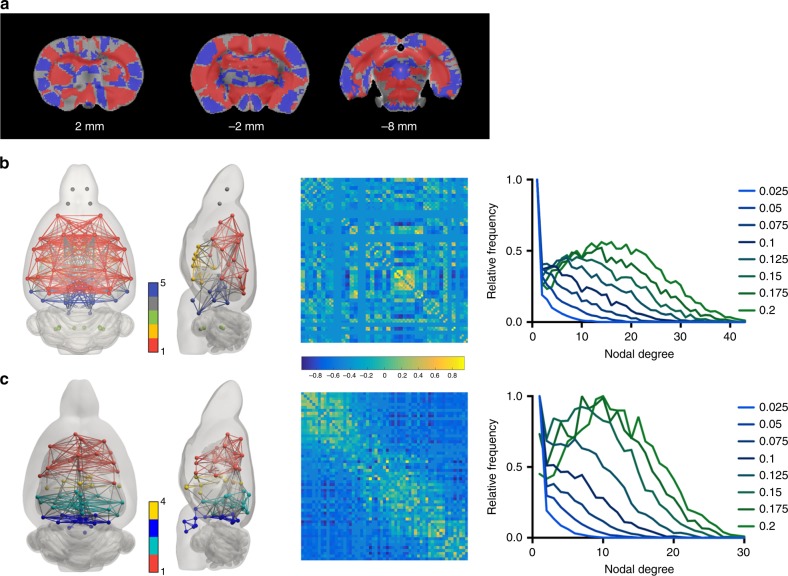
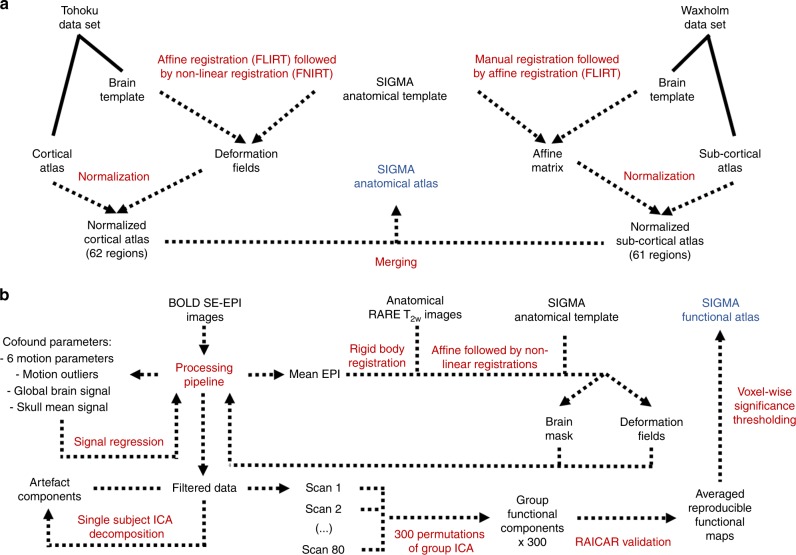
Preclinical imaging studies offer a unique access to the rat brain, allowing investigations that go beyond what is possible in human studies. Unfortunately, these techniques still suffer from a lack of dedicated and standardized neuroimaging tools, namely brain templates and descriptive atlases. Here, we present two rat brain MRI templates and their associated gray matter, white matter and cerebrospinal fluid probability maps, generated from ex vivo [Formula: see text]-weighted images (90 µm isotropic resolution) and in vivo T2-weighted images (150 µm isotropic resolution). In association with these templates, we also provide both anatomical and functional 3D brain atlases, respectively derived from the merging of the Waxholm and Tohoku atlases, and analysis of resting-state functional MRI data. Finally, we propose a complete set of preclinical MRI reference resources, compatible with common neuroimaging software, for the investigation of rat brain structures and functions.


Conflict of interest statement

The authors declare no competing interests.

Figures

Fig. 1
Fig. 1. Comparison of anatomical templates of rat brain.
a Axial, sagittal and coronal views of the DPABI, Tohoku, Waxholm and SIGMA templates. b Coronal views of the tissue probability maps (Gray Matter, White Matter and CSF) associated with the DPABI, Tohoku and SIGMA templates. All the images have been linearly co-registered within the same space for comparison. For the DPABI template, only two tissue classes are available (brain parenchyma and CSF). Tissue probability maps are not provided with the Waxholm template.
Fig. 2
Fig. 2. Comparison between Tohoku and SIGMA templates and tissue probability maps.
a Coronal views of the Tohoku (left) and SIGMA (right) anatomical template of rat brain at the same coordinates (Bregma: – 3.8 mm). Blue arrows indicate differences of corpus callosum shape between both templates. b Coronal views of the Tohoku (left) and SIGMA (right) White Matter (WM) probability maps at the same coordinates. Yellow arrows demonstrate differing classification of WM within the fimbria of the hippocampus. c Coronal views of the Tohoku (left) and SIGMA (right) Gray Matter (GM) probability maps at the same coordinates. Orange arrows show the differences in GM classification within the fimbria of the hippocampus. d Coronal views of the Tohoku (left) and SIGMA (right) Cerebrospinal Fluid (CSF) probability maps at the same coordinates. Green arrows show the differing CSF classification within the lateral ventricle.
Fig. 3
Fig. 3. Comparison of VBM analyses performed using the SIGMA or Tohoku resources.
a Hippocampus mesh plot representing the surface map of Gray Matter Concentration changes between control and stress animals at the same threshold obtained from VBM analysis using the SIGMA priors and template. b Hippocampus mesh plot representing the surface map of Gray Matter Concentration changes between control and stress animals at the same threshold obtained from VBM analysis using the Tohoku priors and template. c Comparison of t-values distribution within the hippocampus when performing the VBM analysis with the SIGMA or the Tohoku template. Control and Stress animals (n = 6 for each) were compared using the two sample Student t-test implemented in SPM8 (t = 1.812, df = 10, p < 0.05, 50 voxels). Source data are provided as a Source Data file.
Fig. 4
Fig. 4. The SIGMA anatomical template and atlas of rat brain.
a Coronal slices of the ex vivo SIGMA anatomical template of the rat brain and the corresponding slices of the SIGMA anatomical atlas and (b) 3D representation of the SIGMA anatomical atlas.
Fig. 5
Fig. 5. Cortical and sub-cortical details of the SIGMA anatomical atlas.
a, b Lateral and dorsal views of the cortical areas after normalization of the Tohoku atlas to the SIGMA anatomical template. The cortex has been segmented into cortical areas such as auditory (A), insular (In), temporal (T), limbic (L), olfactory (O), somatosensory (S), motor (M), cingulate (Cg), retrosplenial (Rs), parietal (P) and visual (V). Each area has been subdivided (using the Paxinos-Watson atlas) into functional areas (i.e. primary and secondary motor cortices) or structural areas (i.e. agranular, dysgranular, agranular/dysgranular, granular and posterior agranular insular cortices). c, d Lateral and dorsal views of sub-cortical structures (hippocampus and white matter tracts) after normalization of the Waxholm atlas on the SIGMA anatomical template. Legend of labeled regions:− Auditory: Au1 = primary auditory cortex; dAu2, vAu2 = secondary auditory cortex, dorsal and ventral areas. − Insular: AI, ADI = agranular insular and dysgranular insular cortices; GI, DI = granular and dysgranular insular cortices; AIP = posterior agralunar insular cortex. − Temporal: TeA = temporal association cortex; Ect = ectorhinal cortex. − Limbic: Fr = frontal association cortex; DLO = dorsolateral orbital cortex; OFr = orbitofrontal region; PrL = prelimbic cortex. − Olfactory: Prh = perirhinal cortex; Prh-35, Prh-36 = perirhinal areas 35 and 36; Ent = entorhinal cortex; L-Ent, M-Ent = lateral and medial entorhinal cortices; L-Ent-Int, L-Ent-Ext = lateral entorhinal cortex, internal and external parts. − Somatosensory: S1J, S1FL, S1HL, S1SH, S1ULp, S1Tk, S1BF = primary somatosensory cortex, jaw, forelimb, hindlimb, shoulder, upper lip, trunk and barrel field regions; S1DZ, S1DZ0 = primary somatosensory cortex, dysgranular region and dysgranular zone 0; S2 = secondary somatosensory cortex. − Motor: M1, M2 = primary and secondary motor cortices. − Cingulate: Cg1, Cg2 = primary and secondary cingular cortices. − Retrosplenial: RGa, RGb = retrosplenial granular A and B cortices; RSD = retrosplenial dysgranular cortex. − Parietal: lPA, mPA = lateral and medial parietal associative cortices; pcP, pdP, prP = parietal cortex postero-caudal, dorsal and rostral parts. − Visual: V1 = primary visual cortex; V1b, V1M = primary visual cortex, binocular and monocular areas; V2L = secondary visual cortex, lateral area; V2ML, V2MM = secondary visual cortex, mediolateral and mediomedial areas. − Hippocampus: CA1, CA2, CA3 = cornu ammonis areas; DG = dentate gyrus. − White matter tracts: ac = anterior commissure; cc = corpus callosum; f = fornix; Hb = habenular commissure; ic = internal capsule; ml = medial lemniscus; opt = optic tract; pc = posterior commissure; sp5 = spinal trigeminal 5 tract; Th = thalamus.
Fig. 6
Fig. 6. The SIGMA functional atlas of rat brain.
a Coronal slices of the ex vivo SIGMA anatomical template of the rat brain and the corresponding slices of the SIGMA functional atlas and b 3D representation of the SIGMA functional atlas.
Fig. 7
Fig. 7. Functional connectivity analysis performed with anatomical or functional atlas.
a Significant differences (p < 0.05, non-parametric permutation-based group comparison with a Student t-test, corrected for multiple comparisons using Family Wise Error) in the voxel-mean ROI signal variability. Red represents reduced variability using the functional atlas while blue represents increased variability. Functional connectomes built with b the SIGMA anatomical atlas and c the SIGMA functional atlas. Each module within the network is coded by the node color. Shown here are the average networks visualized using BrainNet Viewer (left), the average connectivity matrices (center) and the plots of the degree distribution for densities between 0.025 and 0.2. (t = 0.41, df = 78, p = 0.68, two sample Student t-test). Source data are provided as a Source Data file.
Fig. 8
Fig. 8. Schematic of the workflows developed to create SIGMA atlases of rat brain.
Workflows used for the creation of a the ex vivo SIGMA anatomical atlas of rat brain and b the in vivo SIGMA functional atlas.

References

    1. Talairach, J. & Tournoux, P. Co-planar stereotaxic atlas of the human brain. 3-Dimensional Proportional System: An Approach to Cerebral Imaging. (1988).
    1. Mazziotta JC, Toga AW, Evans A, Fox P, Lancaster J. A probabilistic atlas of the human brain: theory and rationale for its development. The International Consortium for Brain Mapping (ICBM) Neuroimage. 1995;2:89–101. doi: 10.1006/nimg.1995.1012. - DOI - PubMed
    1. Mazziotta J, et al. A probabilistic atlas and reference system for the human brain: International Consortium for Brain Mapping (ICBM) Philos. Trans. R. Soc. Lond. B. Biol. Sci. 2001;356:1293–1322. doi: 10.1098/rstb.2001.0915. - DOI - PMC - PubMed
    1. Lancaster JL, et al. Automated Talairach atlas labels for functional brain mapping. Hum. Brain. Mapp. 2000;10:120–131. doi: 10.1002/1097-0193(200007)10:3<120::AID-HBM30>3.0.CO;2-8. - DOI - PMC - PubMed
    1. Tzourio-Mazoyer N, et al. Automated anatomical labeling of activations in SPM using a macroscopic anatomical parcellation of the MNI MRI single-subject brain. Neuroimage. 2002;15:273–289. doi: 10.1006/nimg.2001.0978. - DOI - PubMed

Publication types

LinkOut - more resources