

Plasma activity of Thioredoxin Reductase as a Novel Biomarker in Gastric Cancer
- PMID: 31836775
- PMCID: PMC6910980
- DOI: 10.1038/s41598-019-55641-6
Plasma activity of Thioredoxin Reductase as a Novel Biomarker in Gastric Cancer
Erratum in
-
Author Correction: Plasma activity of Thioredoxin Reductase as a Novel Biomarker in Gastric Cancer.Sci Rep. 2020 Oct 14;10(1):17254. doi: 10.1038/s41598-020-70071-5. Sci Rep. 2020. PMID: 33057092 Free PMC article.
Abstract
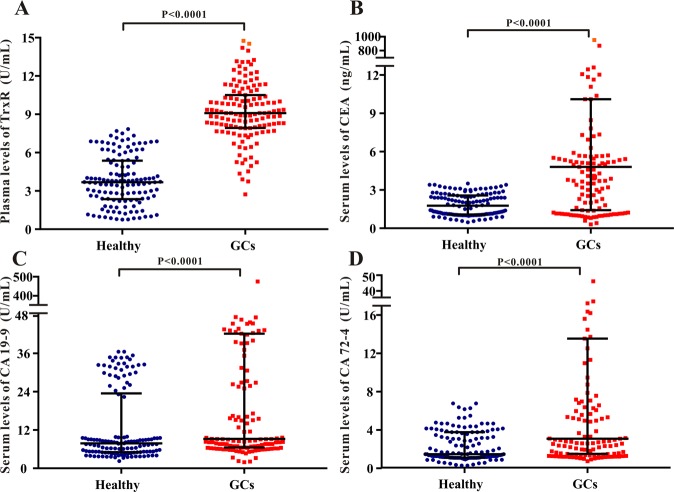
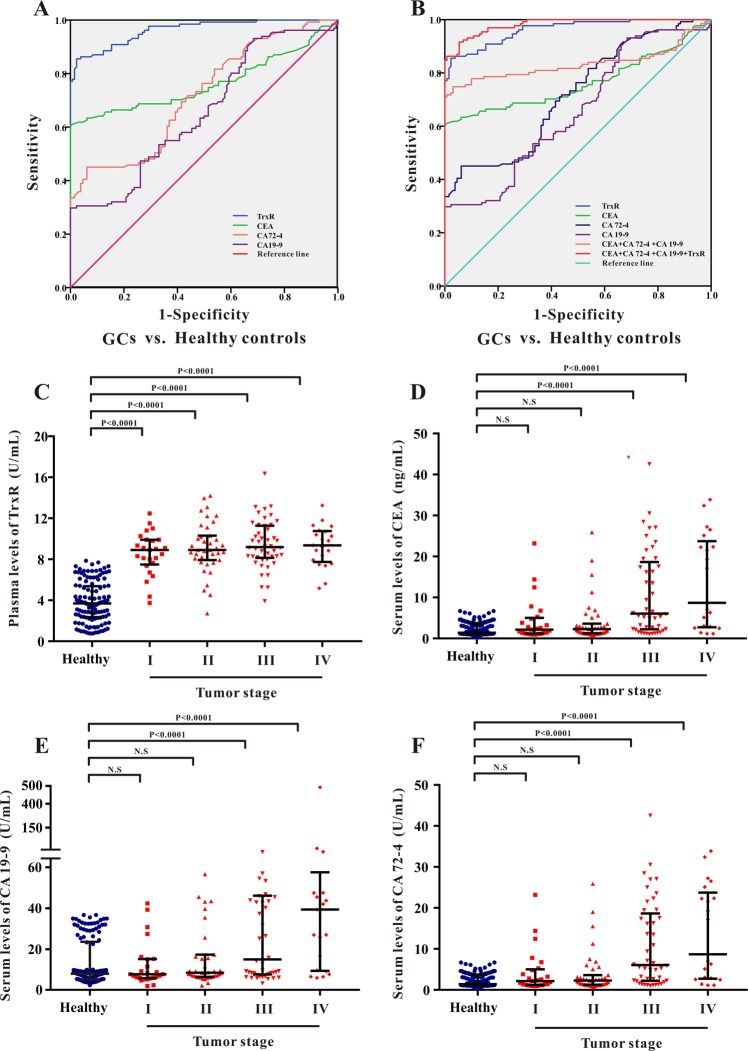
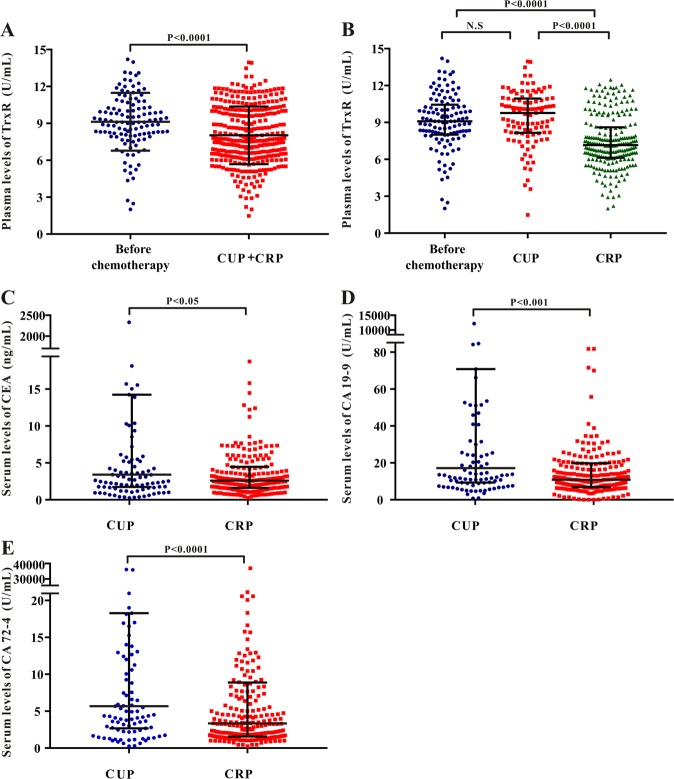
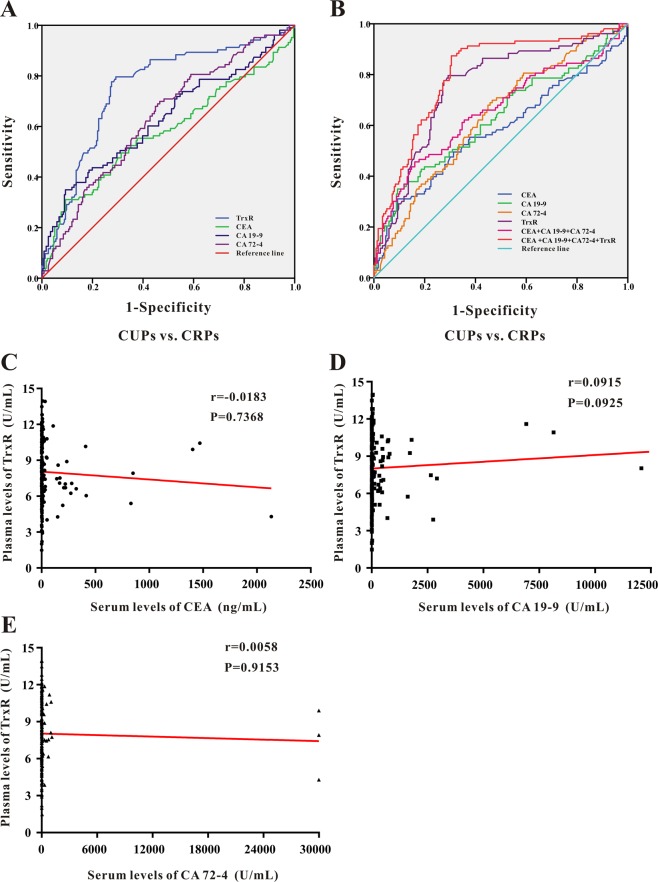
Gastric cancer (GC) is one of the leading malignancies around the world. Identification of novel and efficient biomarkers for GC diagnosis and evaluation of therapeutic efficiency could improve the therapeutic strategy in future clinical application. This study aims to evaluate the levels of plasma thioredoxin reductase (TrxR) activity in GC patients to confirm its validity and efficacy in GC diagnosis and evaluation of therapeutic efficiency. 923 cases were enrolled in the current study. In the group of GC patients before clinical intervention, plasma TrxR activity [9.09 (7.96, 10.45) U/mL] was significantly higher than in healthy controls [3.69 (2.38, 5.32) U/mL]. The threshold of TrxR activity for GC diagnosis was set at 7.34 U/mL with a sensitivity of 85.5% and a specificity of 97.9%. In GC patients after chemotherapy, plasma TrxR activity was remarkably higher in patients with progressive disease or uncontrolled condition [10.07 (8.19, 11.02) U/mL] compared with patients with complete or partial response [7.12 (6.08, 8.37) U/mL] in response to chemotherapy. TrxR activity displayed the higher efficiency to distinguish between GC patients with two distinct clinical outcomes than carcinoembryonic antigen (CEA), cancer antigen 72-4 (CA72-4) and cancer antigen 19-9 (CA19-9). Moreover, combination of TrxR, CEA, CA72-4 and CA19-9 was demonstrated to be more effective in both GC diagnosis and evaluation of therapeutic efficiency than was each biomarker individually. Together, plasma TrxR activity was identified as a novel and efficient biomarker of GC, both in diagnosis and monitoring of therapeutic efficiency in response to chemotherapy.
Conflict of interest statement
The authors declare no competing interests.
Figures
References
-
- Chen Wanqing, et al. Analysis of the incidence and mortality of malignant tumors in China, 2014. Chinese Journal of Oncology. 2018;27:1–14. doi: 10.11735/j.issn.1004-0242.2018.01.A001. - DOI
MeSH terms
Substances
LinkOut - more resources
Full Text Sources
Medical
Miscellaneous
