

Age-related changes in microbial composition and function in cynomolgus macaques
- PMID: 31837260
- PMCID: PMC6949106
- DOI: 10.18632/aging.102541
Age-related changes in microbial composition and function in cynomolgus macaques
Abstract
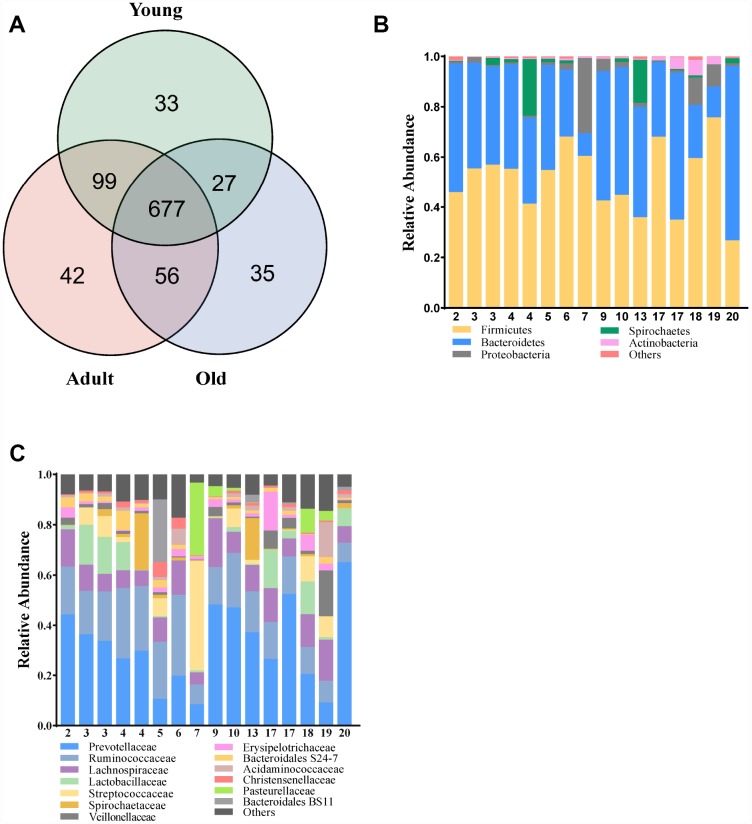
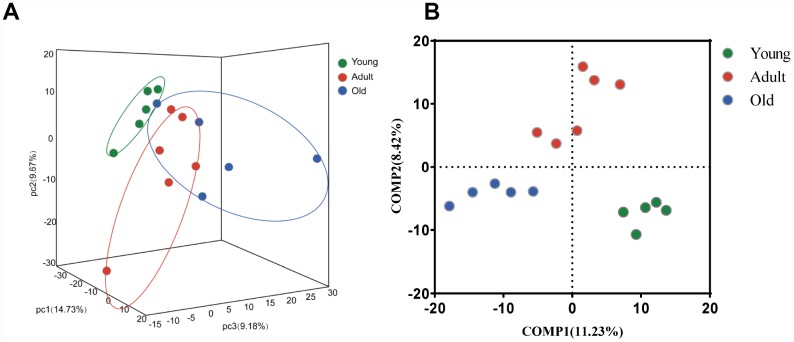
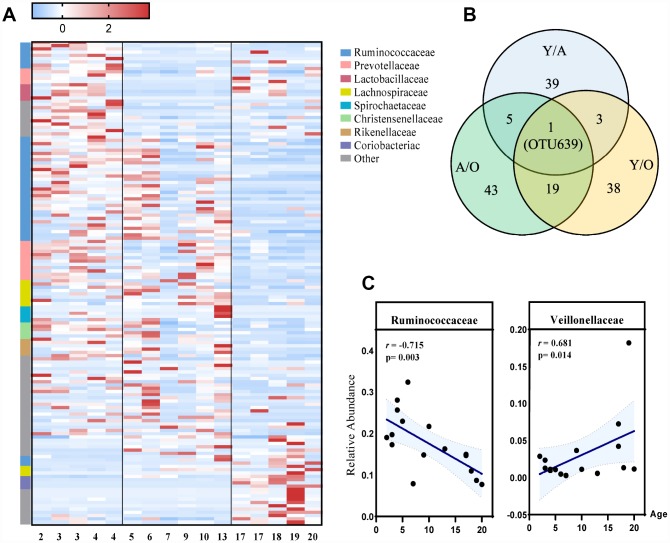
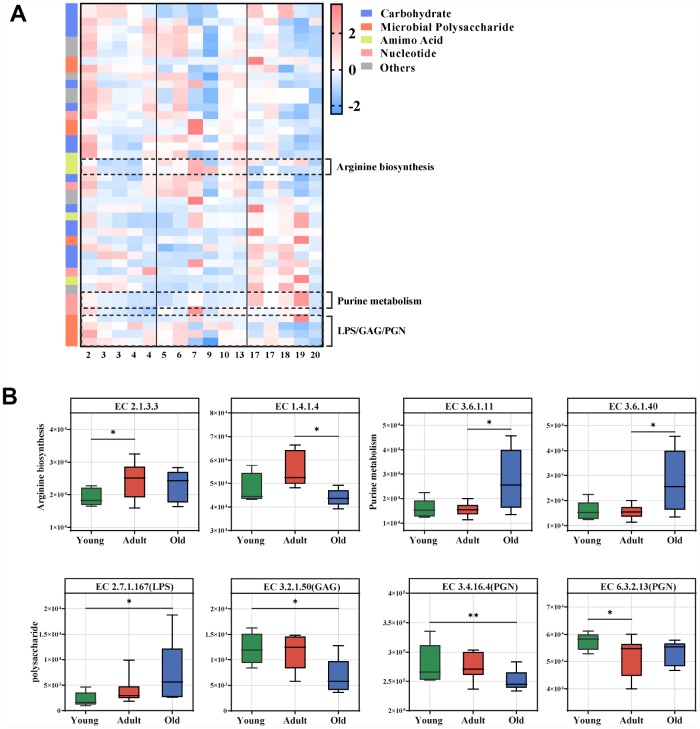
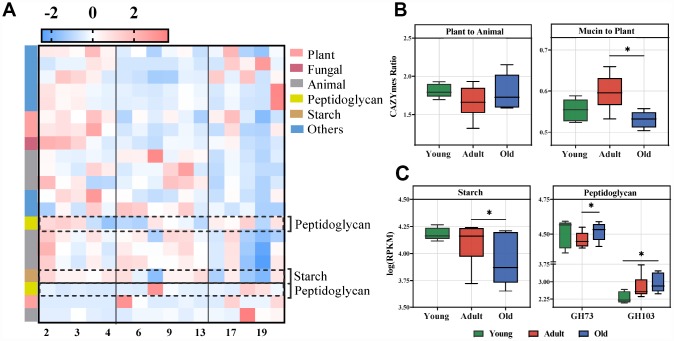
Age can significantly affect human physiology and disease risk. Recent studies have shown that age may affect the composition and function of the gut microbiota, but the underlying mechanisms remain largely unknown. Non-human primates are an ideal model for uncovering how age shapes the gut microbiota, as their microbial composition is highly similar to that of humans and is not easily affected by confounding factors. Here, using the 16S rRNA and metagenomic sequencing methods, we characterized the microbial phenotypes of 16 female cynomolgus macaques from three age groups (young, adult and old). Our findings revealed significant differences in microbial composition among the three groups. With increased age, the relative abundances of Veillonellaceae, Coriobacteriaceae and Succinivibrionaceae were significantly increased, Ruminococcaceae and Rikenellaceae were significantly decreased at the family level. Functional enrichment showed that genes that differed among the three groups were mainly involved in arginine biosynthesis, purine metabolism and microbial polysaccharides metabolism. Moreover, CAZymes corresponding to polysaccharide degrading activities were also observed among the three groups. In conclusion, we characterized the composition and function of the gut microbiota at different ages, and our findings provide a new entry point for understanding the effects of age on the human body.
Keywords: age; cynomolgus macaques; gut microbiota; metagenomics.
Conflict of interest statement
Figures
Similar articles
-
Metagenomic comparison of the rectal microbiota between rhesus macaques (Macaca mulatta) and cynomolgus macaques (Macaca fascicularis).Zool Res. 2019 Mar 18;40(2):89-93. doi: 10.24272/j.issn.2095-8137.2018.061. Epub 2018 Aug 8. Zool Res. 2019. PMID: 30127329 Free PMC article.
-
Association of gut microbiota composition and function with a senescence-accelerated mouse model of Alzheimer's Disease using 16S rRNA gene and metagenomic sequencing analysis.Aging (Albany NY). 2018 Dec 18;10(12):4054-4065. doi: 10.18632/aging.101693. Aging (Albany NY). 2018. PMID: 30562162 Free PMC article.
-
Establishment of a Macaca fascicularis gut microbiome gene catalog and comparison with the human, pig, and mouse gut microbiomes.Gigascience. 2018 Sep 1;7(9):giy100. doi: 10.1093/gigascience/giy100. Gigascience. 2018. PMID: 30137359 Free PMC article.
-
Age-based dynamic changes of phylogenetic composition and interaction networks of health pig gut microbiome feeding in a uniformed condition.BMC Vet Res. 2019 May 24;15(1):172. doi: 10.1186/s12917-019-1918-5. BMC Vet Res. 2019. PMID: 31126262 Free PMC article.
-
Characterizing the Composition of the Pediatric Gut Microbiome: A Systematic Review.Nutrients. 2019 Dec 19;12(1):16. doi: 10.3390/nu12010016. Nutrients. 2019. PMID: 31861722 Free PMC article.
Cited by
-
Identification of Gut Microbiome Signatures in Patients With Post-stroke Cognitive Impairment and Affective Disorder.Front Aging Neurosci. 2021 Aug 19;13:706765. doi: 10.3389/fnagi.2021.706765. eCollection 2021. Front Aging Neurosci. 2021. PMID: 34489677 Free PMC article.
-
Alterations of the gut microbiota in patients with schizophrenia.Front Psychiatry. 2024 Mar 26;15:1366311. doi: 10.3389/fpsyt.2024.1366311. eCollection 2024. Front Psychiatry. 2024. PMID: 38596637 Free PMC article.
-
Multi-Omics Analysis Reveals Age-Related Microbial and Metabolite Alterations in Non-Human Primates.Microorganisms. 2023 Sep 26;11(10):2406. doi: 10.3390/microorganisms11102406. Microorganisms. 2023. PMID: 37894064 Free PMC article.
-
Intestinal microbiota profiles of captive-bred cynomolgus macaques reveal influence of biogeography and age.Anim Microbiome. 2025 May 14;7(1):47. doi: 10.1186/s42523-025-00409-9. Anim Microbiome. 2025. PMID: 40369669 Free PMC article.
-
The Cynomolgus Macaque Intestinal Mycobiome Is Dominated by the Kazachstania Genus and K. pintolopesii Species.J Fungi (Basel). 2022 Oct 8;8(10):1054. doi: 10.3390/jof8101054. J Fungi (Basel). 2022. PMID: 36294619 Free PMC article.
References
-
- Stewart CJ, Ajami NJ, O’Brien JL, Hutchinson DS, Smith DP, Wong MC, Ross MC, Lloyd RE, Doddapaneni H, Metcalf GA, Muzny D, Gibbs RA, Vatanen T, et al.. Temporal development of the gut microbiome in early childhood from the TEDDY study. Nature. 2018; 562:583–88. 10.1038/s41586-018-0617-x - DOI - PMC - PubMed
Publication types
MeSH terms
Substances
LinkOut - more resources
Full Text Sources
Other Literature Sources
Medical
