. 2020 Feb 19;105(4):663-677.e8.
doi: 10.1016/j.neuron.2019.11.016. Epub 2019 Dec 11.

A Discrete Presynaptic Vesicle Cycle for Neuromodulator Receptors

Affiliations

A Discrete Presynaptic Vesicle Cycle for Neuromodulator Receptors

Damien Jullié et al. Neuron. .

Abstract

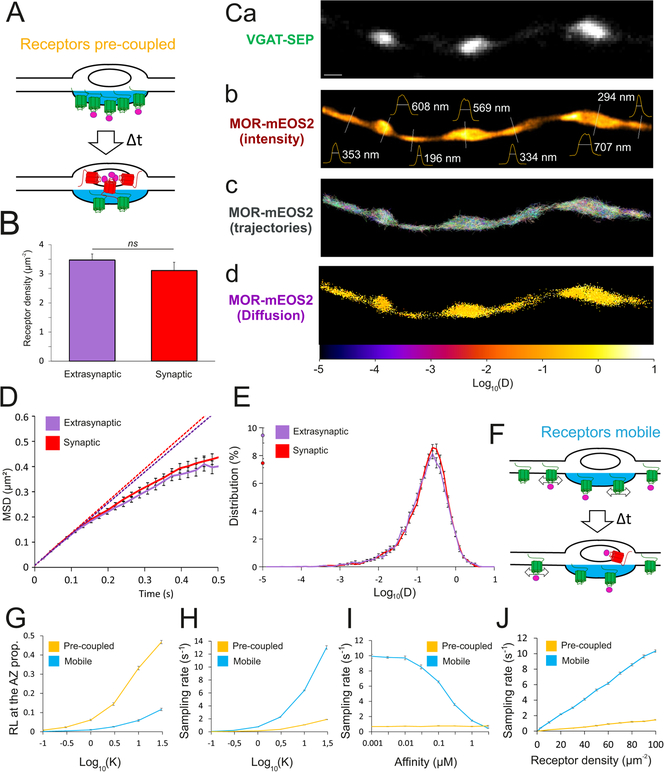
A major function of GPCRs is to inhibit presynaptic neurotransmitter release, requiring ligand-activated receptors to couple locally to effectors at terminals. The current understanding of how this is achieved is through receptor immobilization on the terminal surface. Here, we show that opioid peptide receptors, GPCRs that mediate highly sensitive presynaptic inhibition, are instead dynamic in axons. Opioid receptors diffuse rapidly throughout the axon surface and internalize after ligand-induced activation specifically at presynaptic terminals. We delineate a parallel regulated endocytic cycle for GPCRs operating at the presynapse, separately from the synaptic vesicle cycle, which clears activated receptors from the surface of terminals and locally reinserts them to maintain the diffusible surface pool. We propose an alternate strategy for achieving local control of presynaptic effectors that, opposite to using receptor immobilization and enforced proximity, is based on lateral mobility of receptors and leverages the inherent allostery of GPCR-effector coupling.


Conflict of interest statement

Declaration of Interests The authors declare no competing interests.

Figures

Figure 1:
Figure 1:. MOR undergoes ligand dependent endocytosis in axons
A. Representative oblique illumination (HiLo) images of axons of cultured MSNs expressing the synaptic marker synaptophysin-mCherry (syp-mCh) and MOR-GFP, scale bar is 5μm. B. Normalized MOR-GFP linescan fluorescence aligned to the maximal value along the normalized syp-mCh linescan fluorescence (n=177 synapses from 33 cells). C. Maximal projection from spinning disc images of habenula neurons. Axons are labeled with VGLUT2 and show diffuse distribution of endogenous MOR, scale bar is 5μm. D. Axons of MSNs expressing MOR-GFP and syp-mCh, 20min after incubation with DAMGO 10μM, scale bar is 5μm. E. Normalized MOR-GFP linescan fluorescence aligned to the maximal value along the linescan, untreated n=177 synapses (same dataset as A, different normalization method used to highlight intensity and distribution changes), DAMGO 10μM 20min (n=280 synapses from 39 neurons). F. Maximal projection of spinning disc images of axons of habenula neurons treated with DAMGO 10μM for 20min. Note the accumulation endogenous MOR at bright puncta, scale bar is 5μm. G. Spinning disc confocal images of cultured MSNs expressing syp-mCh and SSF-MOR, surface labeled with Alexa488-coupled anti-FLAG antibody (M1-a488). DAMGO 10μM was added at time 0. Note the accumulation of intraluminal punctate (green arrows). Scale bar is 1μm. H. Experimental protocol and representative images of MSN axons expressing SEP-MOR and syp-mCh. After 5min of baseline, solution was exchanged for a solution containing 50mM NH4Cl. A similar exchange was performed after 30min of perfusion with control solution or a solution containing 10μM DAMGO. Frames were taken before and 1min after perfusion with 50mM NH4Cl, Δ represents the difference between the frame in NH4Cl and the preceding frame. Note the increased fluorescence in the presence of ammonium chloride after 30min of agonist. Scale bar is 5μm. I. Quantification of the normalized fluorescence difference along lines drawn on axons obtained as in H, before (Δ1) or after (Δ2) 30min of control solution (n=6 cells) or 10μM DAMGO (n=10 cells). Error bars represent SEM, *** p<0.001.
Figure 2:
Figure 2:. MOR endocytosis occurs at presynaptic terminals and requires receptor phosphorylation
A. Accumulation index plots estimating receptor redistribution by heterogeneity of fluorescence signal of SSF-MOR (labeled with M1-a647) along MSN axons. Right shift observed in cumulative frequency curves elicited by DAMGO 10μM for 20min (n=255 axons) relative to the untreated condition reflects SSF-MOR punctate accumulation associated with internalization (n=316 axons, p<0.001). B. Same as A comparing MSNs treated with DAMGO 10μM and Dyngo-4a 30μM (n=169 axons) to DAMGO 10μM and DMSO vehicle (n=220 axons); p<0.001. C. Same as A for MSNs expressing syp-mCh and the phosphorylation deficient MOR mutant (S/T to A) in untreated neurons (n=275 axons) to neurons treated with DAMGO 10μM for 20min (n=168 axons); p<0.01. D. Same as A comparing MSNs treated with DAMGO 10μM and Cmpd101 30μM (n=196 axons) or cells treated with DAMGO 10μM and DMSO vehicle (replotted from B); p<0.001. E. Same as A comparing endogenous MOR in SV2-marked axons of habenula neurons treated with DMSO vehicle only (gray curve, n=139 axons), DMSO + DAMGO 10μM (blue curve, n=148 axons) or Cmpd101 30μM + DAMGO 10μM (purple curve, n=156 axons); p<0.001 between all conditions. F. Normalized fluorescence difference of lines drawn on axons from MSNs expressing SEP-MOR and syp-mCh before and after NH4Cl. Cells were treated for 20min with DMSO vehicle (n=17 cells), DMSO + DAMGO 10μM (n=19 cells) or Cmpd101 30μM + DAMGO 10μM (n=19 cells). G. Representative HiLo images of axons of MSNs expressing syp-mCh (upper left panel), SSF-MOR surface labeled with M1-a647 (upper right panel) and β-arrestin2-GFP before (bottom left) and after (bottom right) addition of DAMGO 10μM. Note the redistribution of the GFP signal at synaptic puncta. GFP images are scaled the same, scale bar is 1μm. H. Upper panel: Illustration of the endocytic process and the expected SEP signal during the ppH protocol (green represents fluorescence, gray represents quenching). Scission of an endocytic vesicle during the pH7.4 step generates an acid resistant fluorescent spot on the following pH5.5 step. Lower panel: Cultured MSNs expressing syp-mCh and SEP-MOR imaged with HiLo during the ppH protocol. Apparition of a pH5.5 resistant signal (green arrow) indicates an endocytic event. Scale bar is 1μm, contrast is doubled for pH5.5 frames for better visibility. I. Frequency of endocytic events detected with the ppH inside (red) or outside (purple) of synapses, in the presence (n=58 cells) or absence (n=23 cells) of DAMGO 10μM. Frequencies were normalized to the number of synapses in the imaging field for comparison between acquisitions. Note the increased frequency in the presence of agonist and the proportion of synaptic events. Error bars represent SEM, ** p<0.01, *** p<0.001.
Figure 3:
Figure 3:. Endocytosed MOR defines a discrete population of presynaptic endosomes that are marked by retromer
A. HiLo images of cultured MSNs expressing syp-mCh and SSF-MOR, surface labeled with M1-a488 and incubated with DAMGO 10μM for 20min. MOR containing endosomes exhibit a strong synaptic localization. Scale bar is 5μm. B. Kymograph obtained with 1Hz HiLo imaging in the same condition as A. Note the bidirectional, saltatory movement of individual endosomes (arrow). C. Single plane of spinning disc confocal images of endogenous VPS35 in axons of habenula neurons labeled with VGLUT2 and treated with DAMGO 10μM for 20min. Note the colocalization of endogenous MOR-containing endosomes with VPS35. Scale bar is 1μm. D. Single plane of structured illumination microscopy images in the same conditions as for C. Scale bar is 1μm. E. Representative HiLo images of cultured MSNs expressing the retromer complex subunit VPS29-GFP with syp-mCh and SSF-MOR, surface labeled with M1-a647 before (upper panel) and after (lower panel) DAMGO 10μM addition. SSF-MOR is diffuse in the absence of agonist and exhibit little colocalization with VPS29-GFP. After agonist addition, receptors redistribute in puncta that colocalize with VPS29-GFP. Scale bar is 5μm. F. From the same experimental setup as E, normalized M1-a647 linescan fluorescence aligned to the maximal value along the normalized VPS29-GFP fluorescence before DAMGO 10μM addition (from 12 cells, n=105 endosomes). G. Same as F, after DAMGO 10μM, note the increase in the linear correlation coefficient (from 12 cells, n=113 endosomes). H. Kymograph obtained with 1Hz HiLo imaging of VPS29-GFP (green) and surface labeled SSF-MOR (red) 20min after DAMGO 10μM addition. MOR containing endosomes and VPS29-GFP move together in axons of MSNs marked with Syp-mCh (upper panel) I. Time course of the normalized fluorescence of SSF-MOR surface labeled with M1-a647 at segmented VPS29-GFP positive endosomes (n=12 cells, same dataset as F, G). Error bars represent SEM.
Figure 4:
Figure 4:. MOR undergoes a complete membrane trafficking cycle in axons that is independent of the synaptic vesicle cycle.
A. Accumulation index of endogenous MOR measured on axons of habenula neurons stained with SV2 for cells treated with naloxone 10μM for 30min (red curve, n=124 axons), cells treated with DAMGO 100nM for 20min (blue curve, n=142 axons), or cells treated with DAMGO 100nM for 20min followed by naloxone 10μM for 30min (purple curve, n=120 axons). p<0.001 for DAMGO against the two other conditions, not significant for naloxone against DAMGO + naloxone. B. After 20min of treatment with DAMGO 10μM, single insertion events containing SEP-MOR appear as sudden bursts of fluorescence at the membrane of cultured MSNs imaged in HiLo. Two representative examples are shown, where insertion occurs at synapses labeled with syp-mCh (upper panel) or outside (lower panel). Note the difference of fluorescence decay for both events, and the apparent surface diffusion of SEP-MOR (upper panel). Scale bar is 1μm. C. Average normalized fluorescence curves of single insertion events observed after 20min of incubation with DAMGO 10μM (green curve, n=324 events from 16 cells). Blue and orange curves are the corresponding normalized fluorescence quantification of the events in 4B (upper and lower events, respectively). D. Frequency of SEP-MOR insertion events in the presence (n=16 cells) or absence (n=6 cells) of agonist, inside or outside of synapses. For each cell, frequencies were normalized to the number of synapses in the imaging field for comparison between acquisitions. E. Frequency of SEP-MOR insertion events monitored in axons of MSNs after incubation with Cmpd101 30μM + DAMGO 10μM or vehicle DMSO + DAMGO 10μM. F. Example of SEP-MOR insertion event (green arrow) at VPS29-mCh labeled endosomes (red arrow) imaged in MSNs with HiLo at 2Hz after 20min of incubation with DAMGO 10 μM. G. Normalized density of VPS29-GFP marked endosomes in axons of MSNs labeled with syp-mCh in untreated conditions (n=153 axons from 42 cells), after 1h incubation with tetrodotoxin (n=47 axons from 20 cells) or after 1, 2 and 3 min incubation with a solution containing 50mM KCl (n=35 axons from 10 cells). H. Normalized frequency of SEP-MOR insertion events in axons of MSNs, untreated and DAMGO conditions replotted from the sum of Fig 4D. In the two other conditions, neurons were incubated with DAMGO 10μM for 20min and then imaged in a solution containing DAMGO 10μM without calcium (0 Ca2+, n=6 cells) or containing 50mM KCl without DAMGO (K+, n=8 cells). I. In axons of MSNs, the GABA transporter fused to SEP (VGAT-SEP) localizes to synaptic vesicles that undergo exocytosis upon 10Hz electrical field stimulation. Normalized average fluorescence increase of VGAT-SEP at synapses of neurons co-expressing SSF-MOR reports synaptic vesicle exocytosis and is inhibited after perfusion of DAMGO 10μM. (n=1970 individual measurements from 5 stimulation on synapses from 5 cells). J. Normalized average amplitude of VGAT-SEP fluorescence increase at synapses of MSNs expressing SSF-MOR. Black curve represents amplitude of unstimulated cells (n=5 cells), blue and gray the amplitude curves of cells stimulated with 10 action potentials at 10Hz every minute and perfused with (n=5 cells) or without (n=10 cells) DAMGO 10μM, respectively. Error bars represent SEM, * represents p<0.05, *** represents p<0.001.
Figure 5:
Figure 5:. An alternative strategy for local GPCR control of presynaptic effectors enabled by rapid lateral diffusion of receptors
A. Schematic of a putative pre-coupled model where naïve receptors (green) bind ligand and undergo activation directly at the presynapse (blue). After some time (Δt) receptors are inactivated (red) and removed from the axonal plasma membrane which leads to a decrease in the naïve receptor pool. B. Density of receptors in axons calculated from dSTORM images of hippocampal neurons stained for endogenous MOR and GAD67. C. HiLo image of an axonal segment of a MSN expressing VGAT-SEP as a synaptic marker (C a), and the associated reconstructed super resolution image from single molecule detections of MOR-mEOS2 (C b). Linescans across the axon show important diameter variations as quantified by the width at half max on the super resolution image. Single molecule trajectories can be reconstructed from single molecule detections (C c) and analyzed to extract diffusion coefficients and generate diffusion maps (C d). Scale bar is 1μm. D. Mean square displacement curves of SEP-MOR single molecule trajectories obtained with ATTO647 conjugated anti-GFP nanobody using uPAINT on axons of MSNs labeled with syp-mCh. Dotted lines are linear fits on the first 4 time points associated to the two different regions and illustrate Brownian motion (n=46 synaptic, 34 extrasynaptic areas from 7 cells). E. Distribution of diffusion coefficients obtained with uPAINT, same dataset as D. F. Schematic as in A of a mobile model where receptors diffuse freely in and out of synapses (arrows), receptors can bind ligand outside of the synapse and diffuse in the active zone while in a ligand-bound state. G. Proportion of receptors bound to ligand at the active zone for different values of K. H. Frequency of independent signaling complexes (sampling efficiency) generated by the two models for different values of K. I. Sampling efficiency of the two models for different ligand affinity values. J. Sampling efficiency for receptor densities covering the reported levels of endogenous receptor expression. Error bars represent SEM.

References

    1. Alvarez VA, Arttamangkul S, Dang V, Salem A, Whistler JL, Von Zastrow M, Grandy DK, and Williams JT (2002). mu-Opioid receptors: Ligand-dependent activation of potassium conductance, desensitization, and internalization. J. Neurosci 22, 5769–5776. - PMC - PubMed
    1. Arttamangkul S, Alvarez-Maubecin V, Thomas G, Williams JT, and Grandy DK (2000). Binding and internalization of fluorescent opioid peptide conjugates in living cells. Mol. Pharmacol 58, 1570–1580. - PubMed
    1. Arttamangkul S, Heinz DA, Bunzow JR, Song X, and Williams JT (2018). Cellular tolerance at the μ-opioid receptor is phosphorylation dependent. Elife 7. - PMC - PubMed
    1. Ashrafi G, Wu Z, Farrell RJ, and Ryan TA (2017). GLUT4 Mobilization Supports Energetic Demands of Active Synapses. Neuron 93, 606–615.e3. - PMC - PubMed
    1. Ball G, Demmerle J, Kaufmann R, Davis I, Dobbie IM, and Schermelleh L (2016). Erratum: SIMcheck: a Toolbox for Successful Super-resolution Structured Illumination Microscopy. Sci. Rep 6, 20754. - PMC - PubMed

Publication types

MeSH terms

Substances