

Heritability and Cognitive Relevance of Structural Brain Controllability
- PMID: 31838501
- PMCID: PMC7197079
- DOI: 10.1093/cercor/bhz293
Heritability and Cognitive Relevance of Structural Brain Controllability
Abstract
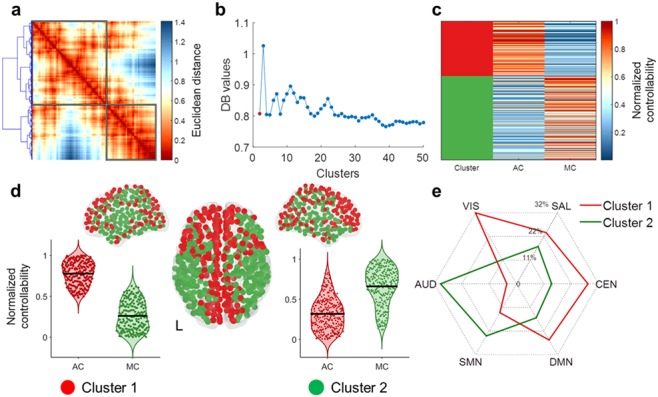
Cognition and behavior are thought to emerge from the connections and interactions among brain regions. The precise nature of these relationships remains elusive. Here we use tools provided by network control theory to determine how the structural connectivity profile of brain regions may shape individual variation in cognition. In a cohort of healthy young adults (n = 1066), we computed two fundamental brain regional control patterns, average and modal controllability, which index the degree of influence of a region over others. We first established that regional brain controllability measures were both reproducible and heritable. Regions with controllability profiles theoretically conducive to facilitating multiple cognitive operations were over-represented in higher-order resting-state networks. Finally, variation in regional controllability accounted for about 50% of interindividual variability in multiple cognitive domains. We conclude that controllability is a biologically plausible property of the structural connectome and provides a mechanistic explanation for how brain structural architecture may influence cognitive functions.
Keywords: cognition; controllability; diffusion magnetic resonance imaging; structural connectivity.
© The Author(s) 2019. Published by Oxford University Press. All rights reserved. For permissions, please e-mail: journals.permission@oup.com.
Figures


Similar articles
-
Language Recovery after Brain Injury: A Structural Network Control Theory Study.J Neurosci. 2022 Jan 26;42(4):657-669. doi: 10.1523/JNEUROSCI.1096-21.2021. Epub 2021 Dec 6. J Neurosci. 2022. PMID: 34872927 Free PMC article. Clinical Trial.
-
The Functional Relevance of Task-State Functional Connectivity.J Neurosci. 2021 Mar 24;41(12):2684-2702. doi: 10.1523/JNEUROSCI.1713-20.2021. Epub 2021 Feb 4. J Neurosci. 2021. PMID: 33542083 Free PMC article.
-
Heritability and interindividual variability of regional structure-function coupling.Nat Commun. 2021 Aug 12;12(1):4894. doi: 10.1038/s41467-021-25184-4. Nat Commun. 2021. PMID: 34385454 Free PMC article.
-
[Correlation of Resting State Functional Connectivity with Behavioral and Psychological Indices].Zh Vyssh Nerv Deiat Im I P Pavlova. 2016 Sep;66(5):541-555. Zh Vyssh Nerv Deiat Im I P Pavlova. 2016. PMID: 30695400 Review. Russian.
-
From connectome to cognition: The search for mechanism in human functional brain networks.Neuroimage. 2017 Oct 15;160:124-139. doi: 10.1016/j.neuroimage.2017.01.060. Epub 2017 Jan 26. Neuroimage. 2017. PMID: 28131891 Free PMC article. Review.
Cited by
-
A Computational Framework for Controlling the Self-Restorative Brain Based on the Free Energy and Degeneracy Principles.Front Comput Neurosci. 2021 Apr 14;15:590019. doi: 10.3389/fncom.2021.590019. eCollection 2021. Front Comput Neurosci. 2021. PMID: 33935674 Free PMC article.
-
Alprazolam modulates persistence energy during emotion processing in first-degree relatives of individuals with schizophrenia: a network control study.Mol Psychiatry. 2023 Aug;28(8):3314-3323. doi: 10.1038/s41380-023-02121-z. Epub 2023 Jun 23. Mol Psychiatry. 2023. PMID: 37353585 Free PMC article.
-
Structural control energy of resting-state functional brain states reveals less cost-effective brain dynamics in psychosis vulnerability.Hum Brain Mapp. 2021 May;42(7):2181-2200. doi: 10.1002/hbm.25358. Epub 2021 Feb 10. Hum Brain Mapp. 2021. PMID: 33566395 Free PMC article.
-
Higher general intelligence is associated with stable, efficient, and typical dynamic functional brain connectivity patterns.Imaging Neurosci (Camb). 2024 Jul 17;2:imag-2-00234. doi: 10.1162/imag_a_00234. eCollection 2024. Imaging Neurosci (Camb). 2024. PMID: 40800434 Free PMC article.
-
Towards a network control theory of electroconvulsive therapy response.PNAS Nexus. 2023 Feb 1;2(2):pgad032. doi: 10.1093/pnasnexus/pgad032. eCollection 2023 Feb. PNAS Nexus. 2023. PMID: 36874281 Free PMC article.
References
Publication types
MeSH terms
Grants and funding
LinkOut - more resources
Full Text Sources
