. 2020 May;75(5):1188-1204.
doi: 10.1111/all.14151. Epub 2020 Jan 3.

Dual blockade of IL-4 and IL-13 with dupilumab, an IL-4Rα antibody, is required to broadly inhibit type 2 inflammation

Affiliations

Dual blockade of IL-4 and IL-13 with dupilumab, an IL-4Rα antibody, is required to broadly inhibit type 2 inflammation

Audrey Le Floc'h et al. Allergy. 2020 May.

Abstract

Background: Dupilumab, a fully human monoclonal antibody that binds IL-4Rα and inhibits signaling of both IL-4 and IL-13, has shown efficacy across multiple diseases with underlying type 2 signatures and is approved for treatment of asthma, atopic dermatitis, and chronic sinusitis with nasal polyposis. We sought to provide a comprehensive analysis of the redundant and distinct roles of IL-4 and IL-13 in type 2 inflammation and report dupilumab mechanisms of action.

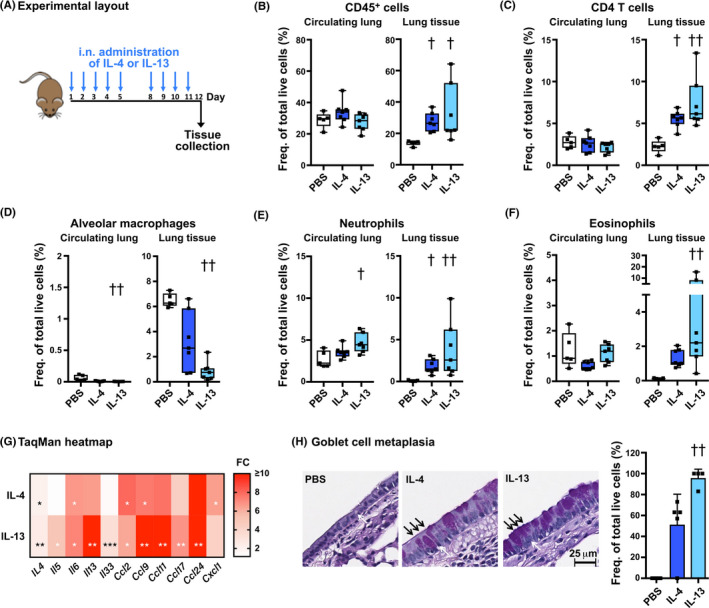
Methods: Using primary cell assays and a mouse model of house dust mite-induced asthma, we compared IL-4 vs IL-13 vs IL-4Rα blockers.

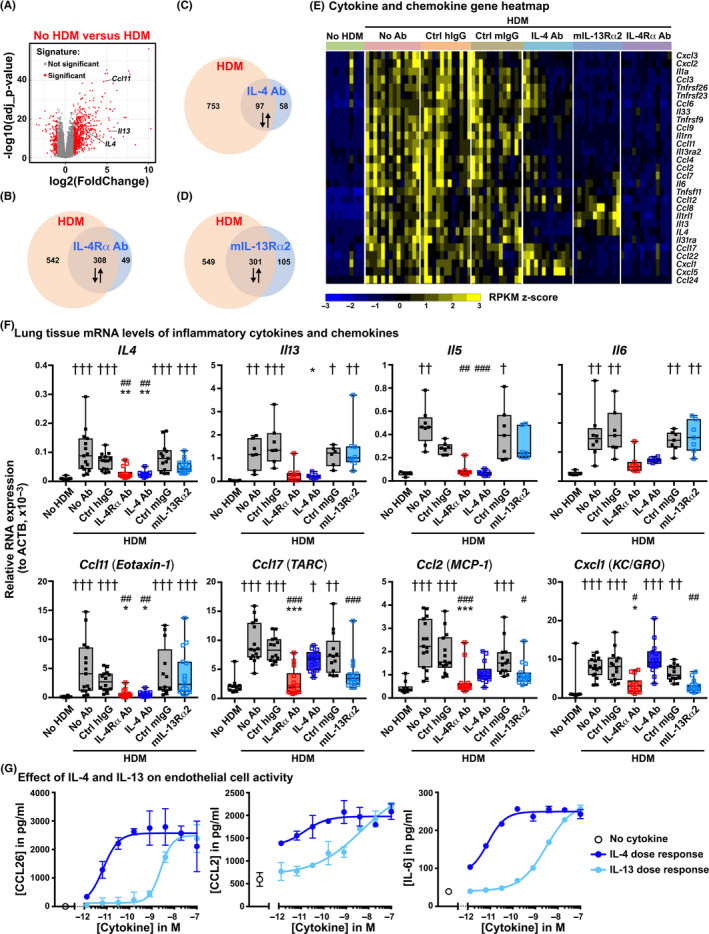
Results: Intranasal administration of either IL-4 or IL-13 confers an asthma-like phenotype in mice by inducing immune cell lung infiltration, including eosinophils, increasing cytokine/chemokine expression and mucus production, thus demonstrating redundant functions of these cytokines. We further teased out their respective contributions using human in vitro culture systems. Then, in a mouse asthma model by comparing in head-to-head studies, either IL-4 or IL-13 inhibition to dual IL-4/IL-13 inhibition, we demonstrate that blockade of both IL-4 and IL-13 is required to broadly block type 2 inflammation, which translates to protection from allergen-induced lung function impairment. Notably, only dual IL-4/IL-13 blockade prevented eosinophil infiltration into lung tissue without affecting circulating eosinophils, demonstrating that tissue, but not circulating eosinophils, contributes to disease pathology.

Conclusions: Overall, these data support IL-4 and IL-13 as key drivers of type 2 inflammation and help provide insight into the therapeutic mechanism of dupilumab, a dual IL-4/IL-13 blocker, in multiple type 2 diseases.

Keywords: IL-13; IL-4; cytokines; dupilumab; type 2 inflammation.


Conflict of interest statement

All authors are employees of Regeneron Pharmaceuticals, Inc, and may hold stock and/or stock options in the company.

Figures

Figure 1
Figure 1
Both IL‐4 and IL‐13 drive airway inflammation in mice. A, Il4rahu/hu Il4hu/hu mice were exposed to PBS, human IL‐4 or human IL‐13 for 12 d. B‐F, On day 12, mice were injected with anti‐CD45 to label all circulating immune cells and killed after 5 min. Lungs were harvested and dissociated for flow cytometric analysis of circulating lung and lung tissue CD45+ cells (B), CD4 T cells (C), alveolar macrophages (D), neutrophils (E), and eosinophils (F). Circulating lung and lung tissue cell populations are reported as a frequency of live cells in the suspension. Each symbol represents one mouse. n = 5 mice per group. PBS (white boxes), human IL‐4 (dark blue boxes), or human IL‐13 (light blue boxes). G, Cytokine and chemokine gene heatmap. Fold change relative to control mice of lung tissue mRNA expression levels was measured by real‐time qPCR and expressed relative to β‐actin (ACTB) mRNA expression. H, Left, representative PAS‐stained lung histology sections of a mouse not exposed to cytokines (left panel), an IL‐4‐exposed mouse (middle panel), or an IL‐13‐exposed mouse (right panel). White arrows show examples of epithelial cell nuclei. Black arrows indicate examples of PAS‐positive goblet cells; Bar, 25 µm. Right, GCM quantification. PAS‐positive goblet cells and total epithelial cells were counted in a millimeter length of primary bronchus (approximately 100 epithelial cells), and GCM was expressed as the percentage of PAS‐positive epithelial cells. †,*=P < .05; ††,**= P < .01; ***=P < .001 vs mice not exposed to cytokines
Figure 2
Figure 2
The IL‐4Rα antibody dupilumab blocks human IL‐4 and IL‐13/IL‐13Rα1 complex binding to IL‐4Rα and prevents IL‐4 and IL‐13 signaling through Type I and Type II receptors. A, Type I signaling: Ramos.2G6.4C10/STAT3/Luciferase cells were treated with increasing concentrations of IL‐4, or serial dilutions of IL‐4Rα Ab, IL‐4 Ab, or an isotype control antibody (ctrl IgG) in the presence of 300 pmol/L IL‐4. B and C, Type II signaling: HEK293/STAT6/Luciferase cells were treated with increasing concentrations of IL‐4 (B), IL‐13 (C), or serial dilutions of IL‐4Rα Ab, IL‐4 Ab, IL‐13 Ab, or ctrl IgG in the presence of 10 pmol/L IL‐4 (B) or 25 pmol/L IL‐13 (C). Inhibition of IL‐4‐ or IL‐13‐mediated signaling was quantified by measuring luminescence (RLU). Error bars represent SD from samples run in triplicate. Black arrows indicate cytokine concentrations used for the corresponding blocking assays. IC50 is shown. Data are representative of at least two independent experiments. D, Schematic diagram representing APC‐Th2 coculture cell interactions in the presence of SEB. E, Cocultures of B cells with Th2 cells in the presence of SEB were coincubated with serial dilutions of IL‐4Rα Ab, IL‐4 Ab, IL‐13 Ab, or control antibody (ctrl IgG) for 2 d. Inhibition of CD23 induction at the surface of B cells was monitored by flow cytometry. F, Cocultures of moDCs with Th2 cells in the presence of SEB were coincubated with serial dilutions of IL‐4Rα Ab, IL‐4 Ab, IL‐13 Ab, or ctrl IgG for 2 d. Inhibition of IL‐12p70 release from moDCs was determined by MSD. Error bars represent SD from samples run in duplicate. All data are representative of at least three independent experiments using different donors. G, To assess the ability of IL‐4Rα Ab to block IL‐4 and IL‐13/IL‐13Rα1 binding to IL‐4Rα, human IL‐4, human IL‐13, human IL‐13Rα1.hFc, or IL‐13/IL‐13Rα1.hFc complex was injected over human IL‐4Rα surfaces that were prebound with IL‐4Rα Ab or a control antibody (ctrl IgG). Graph presents surface‐bound proteins in resonance units (RU). H, Schematic diagram showing dupilumab (IL‐4Rα Ab) mechanism of action
Figure 3
Figure 3
IL‐4 drives B‐cell activation, class switching, and basophil priming in HDM‐exposed mice. A, Il4rahu/hu Il4hu/hu mice were exposed to saline or HDM for 4 weeks. Five groups of HDM‐exposed mice received injections of an isotype control antibody (ctrl hIgG or ctrl mIgG), IL‐4Rα Ab, IL‐4 Ab, or mouse IL‐13Rα2‐Fc. B and C, On day 30, serum concentrations of HDM‐specific IgG1 (B) and total IgE (C) were determined by ELISA. No HDM‐specific IgG1 antibodies were detectable in groups that were not exposed to HDM at the lowest dilution tested (1:100). Dotted line: lower limit of quantification. D, On day 30, mice were injected with anti‐CD45 to label all circulating immune cells and killed after 5 min. Lungs were harvested and dissociated for flow cytometric analysis of circulating lung and lung tissue CD23+ B cells. Circulating lung CD23+ B cells were reported as frequency of circulating lung B cells (left panel), and lung tissue CD23+ B cells were reported as frequency of lung tissue B cells (right panel). E and F, Analysis of IgG1+ B cell (E) and IgE+ plasma cell (F) frequencies in the spleen on day 30. IgG1+ B cells and IgE+ plasma cells were reported as frequency of live cells. G, Analysis of IgE surface expression on splenic basophils. Each symbol represents one mouse. n ≥ 5 mice per group. Saline (white boxes) or HDM (shaded boxes). †=P < .05; ††=P < .01; †††=P < .001 vs mice not exposed to HDM; #=P < .05; ##=P < .01; ###=P < .001 vs mice exposed to HDM; *=P < .05; **=P < .01; ***=P < .001 vs corresponding isotype group
Figure 4
Figure 4
IL‐4 dominates IgE‐dependent human mast cell responses. A, In vitro differentiated human mast cells were treated for 2 d with increasing concentrations of IL‐4 or IL‐13, or serial dilutions of IL‐4Rα Ab or a control (ctrl) IgG in the presence of 50 pmol/L IL‐4 or 1 nmol/L IL‐13, and FcεRIα surface expression was assessed by flow cytometry. Error bars represent SD from samples run in triplicate. Black arrows indicate cytokine concentrations used for the corresponding blocking assays. IC50 is shown. Data are representative of at least three independent experiments using different donors. B, Heatmap of cytokine‐ and chemokine‐related genes upon IgE crosslinking (sensitization with two different Fel d 1‐specific IgE followed by activation with Fel d 1 antigen) of human mast cells. 51 cytokine/chemokine‐related genes were induced (FDR ≤ 0.05; |FC|≥2) by either IL‐4, IL‐13, Fel d 1‐specific IgE (Fel d 1 IgE)+Fel d 1, IL‐4 + Fel d 1 IgE + Fel d 1, or IL‐13 + Fel d 1 IgE + Fel d 1. The color gradient represents fold‐change values comparing each treatment to the control samples. C, mRNA expression levels measured by real‐time qPCR and expressed relative to GAPDH mRNA expression; *=P < .05; **=P < .01; ***=P < .001 between indicated conditions
Figure 5
Figure 5
Dual IL‐4/IL‐13 blockade prevents infiltration of eosinophils into the lungs of HDM‐exposed mice and their activation. A, Il4rahu/hu Il4hu/hu mice were exposed to saline or HDM for 4 wk. Five groups of HDM‐exposed mice received injections of an isotype control antibody (ctrl hIgG or ctrl mIgG), IL‐4Rα Ab, IL‐4 Ab, or mouse IL‐13Rα2‐Fc. On day 30, mice were injected with anti‐CD45 to label all circulating immune cells and killed after 5 min. Lungs were harvested and dissociated for flow cytometric analysis of circulating lung and lung tissue eosinophils. Representative flow cytometric plots are shown (left panels). Circulating lung (middle panel) and lung tissue (right panel) eosinophils are reported as a frequency of live cells in the suspension. Each symbol represents one mouse. n ≥ 5 mice per group. Saline (white boxes) or HDM (shaded boxes). †=P < .05; ††=P < .01; †††=P < .001 vs mice not exposed to HDM; ##=P < .01 vs mice exposed to HDM; *=P < .05 vs corresponding isotype group. B, Freshly purified human eosinophils were treated for 2 d with increasing concentrations of IL‐4 or IL‐13, or serial dilutions of IL‐4Rα Ab or a control (ctrl) IgG in the presence of 50 pmol/L IL‐4 or 1 nmol/L IL‐13, and TARC release was assessed by MSD. Error bars represent SD from samples run in triplicate. Black arrows indicate cytokine concentrations used for the corresponding blocking assays. IC50 is shown. Data are representative of at least three independent experiments using different donors
Figure 6
Figure 6
Dual IL‐4/IL‐13 blockade broadly inhibits chemokine and type 2 proinflammatory cytokine expression in the lungs of HDM‐exposed mice. A, Volcano plot of HDM signature. After 4 wk of HDM exposure, significant changes were detected in 873 transcripts that were differentially expressed in the lungs of HDM‐exposed mice compared with the lungs of mice not exposed to HDM (adjusted P‐value ≤ .05; |fold change|≥2). B and D, Venn diagrams of HDM signature vs IL‐4Rα Ab (B), IL‐4 Ab (C), and mIL‐13Rα2‐Fc (D) signatures (adjusted P‐value ≤ .05; |fold change|≥2). Five groups of HDM‐exposed mice received injections of an isotype control antibody (ctrl hIgG or ctrl mIgG), IL‐4Rα Ab, IL‐4 Ab, or mouse IL‐13Rα2‐Fc. Treatment signatures correspond to statistically significant changes in gene expression compared to mice receiving corresponding ctrl IgG. ↓↑, treatment‐responsive genes inversely differentially regulated in the HDM signature. E, Heatmap of cytokine/chemokine‐related genes. 29 cytokine/chemokine‐related genes from the HDM signature were inversely regulated by IL‐4Rα Ab, IL‐4 Ab, and/or mouse IL‐13Rα2‐Fc. The color gradient represents z‐score of the gene expression values in various treatment and control samples. F, Il4rahu/hu Il4hu/hu mice were exposed to saline (white boxes) or HDM (shaded boxes) for 4 wk. Five groups of HDM‐exposed mice received injections of an isotype control antibody (ctrl hIgG or ctrl mIgG), IL‐4Rα Ab, IL‐4 Ab, or mouse IL‐13Rα2‐Fc. At the end of the study, lung tissue mRNA expression levels were measured by real‐time qPCR and are expressed relative to β‐actin (ACTB) mRNA expression. Each symbol represents one mouse. n ≥ 5 mice per group. †=P < .05; ††=P < .01; †††=P < .001 vs mice not exposed to HDM; #=P < .05; ##=P < .01; ###=P < .001 vs mice exposed to HDM; *=P < .05; **=P < .01; ***=P < .001 vs corresponding isotype group. G, HUVECs were treated for 1 d with increasing concentrations of IL‐4 or IL‐13, and eotaxin 3 (CCL26), MCP‐1 (CCL2), and IL‐6 release was assessed by MSD. Error bars represent SD from samples run in duplicate. Data are representative of at least three independent experiments
Figure 7
Figure 7
Dual IL‐4/IL‐13 blockade prevents HDM‐induced impairment of lung function. Il4rahu/hu Il4hu/hu mice were exposed to saline or HDM for 4 wk. Five groups of HDM‐exposed mice received injections of an isotype control antibody (ctrl hIgG or ctrl mIgG), IL‐4Rα Ab, IL‐4 Ab, or mouse IL‐13Rα2‐Fc. A, Representative PAS‐stained lung histology sections of a mouse not exposed to HDM, an untreated HDM‐exposed mouse, a HDM‐exposed mouse treated with ctrl hIgG, ctrl mIgG, IL‐4Rα Ab, IL‐4 Ab, or mIL‐13Rα2‐Fc. White arrows show examples of epithelial cell nuclei. Black arrows indicate examples of PAS‐positive goblet cells; bar, 25 µm. B, GCM quantification. PAS‐positive goblet cells and total epithelial cells were counted in a millimeter length of primary bronchus (approximately 100 epithelial cells), and GCM was expressed as the percentage of PAS‐positive epithelial cells. †=P < .05 vs mice not exposed to HDM; ##=P < .01 vs mice exposed to HDM; *=P < .05 vs corresponding isotype group. C, Il4rahu/hu Il4hu/hu mice were exposed to saline or HDM for 4 wk. Two groups of HDM‐exposed mice received injections of an isotype control antibody or IL‐4Rα Ab. D and E, 72‐100 h after the final HDM exposure, lung function and airway hyperresponsiveness of the mice were evaluated by forced oscillation technique and negative pressure forced expiration using a FlexiVent® platform. After initial measurements (D), mice were nebulized with increasing doses of methacholine (0, 2, 4, 6, 10, and 14 mg/mL) for 10 seconds per dose and lung function was recorded (E). FEV0.1 at the indicated methacholine dose is presented as absolute values (left panel) and normalized to baseline (right panel). n ≥ 5 mice per group. D, ††=P < .01 vs mice not exposed to HDM. E, #=P < .1; ##=P < .01; ###=P < .001 for mice not exposed to HDM vs mice exposed to HDM; **=P < .01; ***=P < .001 for IL‐4Rα Ab vs ctrl IgG‐treated groups (other significant comparisons not represented)

References

    1. Lambrecht BN, Hammad H, Fahy JV. The cytokines of asthma. Immunity 2019;50(4):975‐991. - PubMed
    1. May RD, Fung M. Strategies targeting the IL‐4/IL‐13 axes in disease. Cytokine 2015;75(1):89‐116. - PubMed
    1. Gandhi NA, Bennett BL, Graham NM, Pirozzi G, Stahl N, Yancopoulos GD. Targeting key proximal drivers of type 2 inflammation in disease. Nat Rev Drug Discovery 2016;15(1):35‐50. - PubMed
    1. Tan HT, Sugita K, Akdis CA. Novel biologicals for the treatment of allergic diseases and asthma. Curr Allergy Asthma Rep 2016;16(10):70. - PubMed
    1. Gandhi NA, Pirozzi G, Graham NMH. Commonality of the IL‐4/IL‐13 pathway in atopic diseases. Exp Rev Clin Immunol 2017;13(5):425‐437. - PubMed

Publication types