. 2020 Apr 1;177(4):298-307.
doi: 10.1176/appi.ajp.2019.19050527. Epub 2019 Dec 16.

Distinct Polygenic Score Profiles in Schizophrenia Subgroups With Different Trajectories of Cognitive Development

Affiliations

Distinct Polygenic Score Profiles in Schizophrenia Subgroups With Different Trajectories of Cognitive Development

Dwight Dickinson et al. Am J Psychiatry. .

Abstract

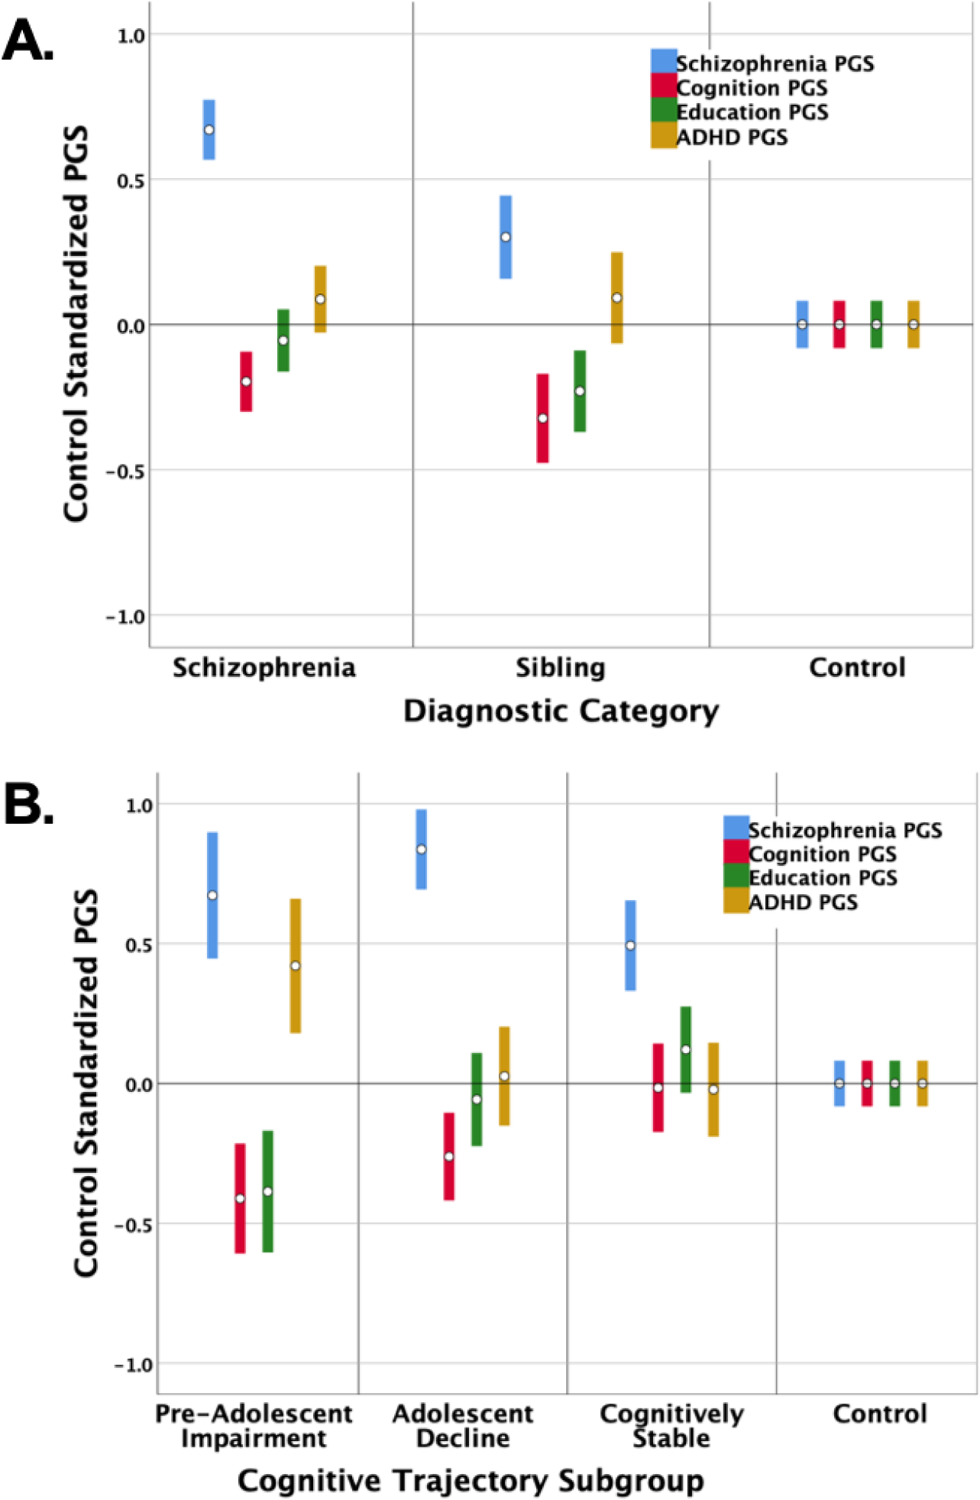
Objective: Different cognitive development histories in schizophrenia may reflect variation across dimensions of genetic influence. The authors derived and characterized cognitive development trajectory subgroups within a schizophrenia sample and profiled the subgroups across polygenic scores (PGSs) for schizophrenia, cognition, educational attainment, and attention deficit hyperactivity disorder (ADHD).

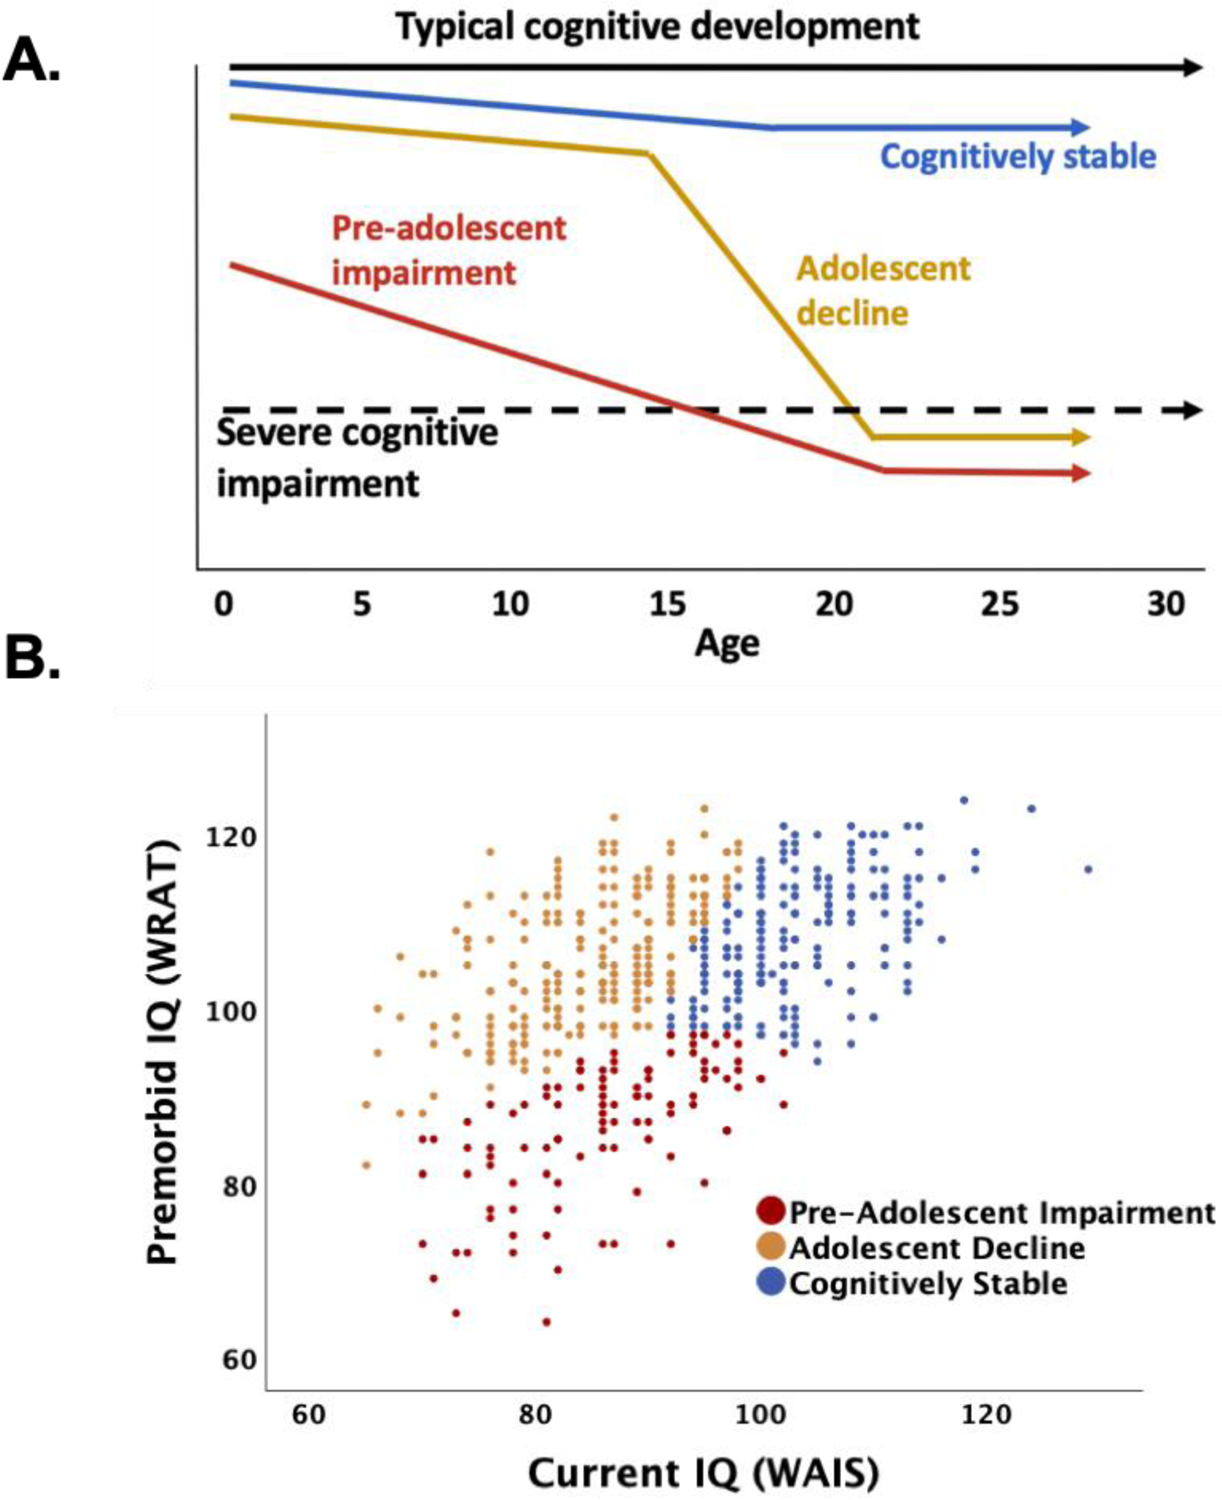
Methods: Demographic, clinical, and genetic data were collected at the National Institute of Mental Health from 540 schizophrenia patients, 247 unaffected siblings, and 844 control subjects. Cognitive trajectory subgroups were derived through cluster analysis using estimates of premorbid and current IQ. PGSs were generated using standard methods. Associations were tested using general linear models and logistic regression.

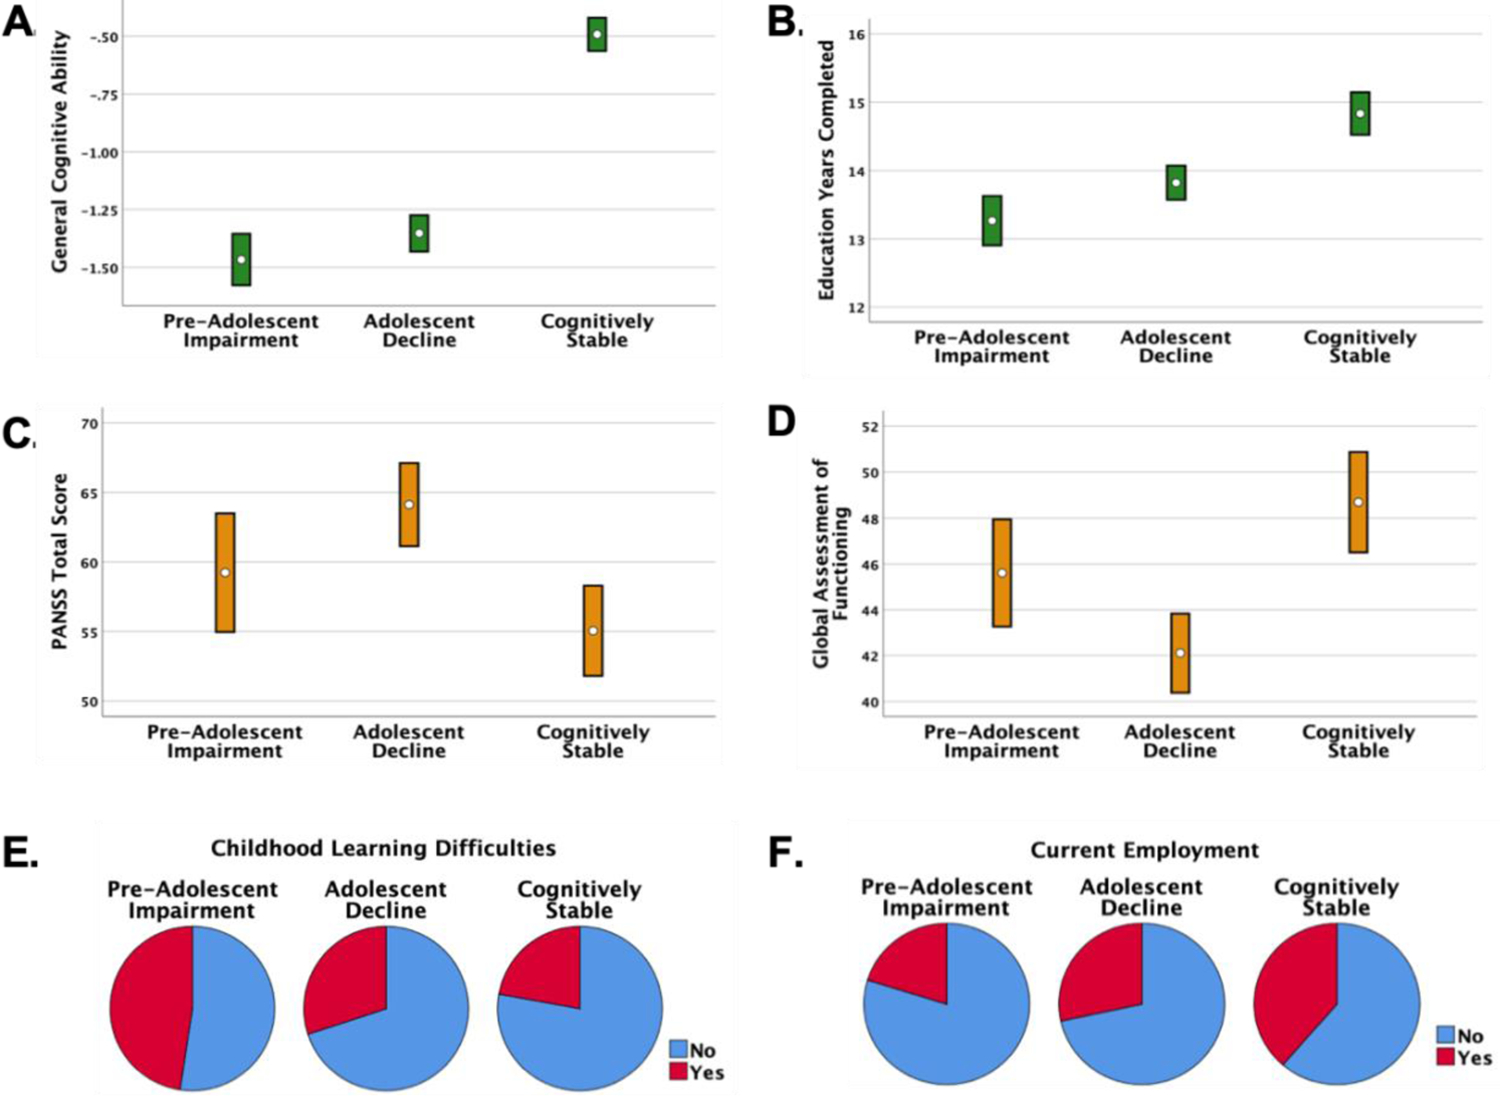
Results: Cluster analyses identified three cognitive trajectory subgroups in the schizophrenia group: preadolescent cognitive impairment (19%), adolescent disruption of cognitive development (44%), and cognitively stable adolescent development (37%). Together, the four PGSs significantly predicted 7.9% of the variance in subgroup membership. Subgroup characteristics converged with genetic patterns. Cognitively stable individuals had the best adult clinical outcomes and differed from control subjects only in schizophrenia PGSs. Those with adolescent disruption of cognitive development showed the most severe symptoms after diagnosis and were cognitively impaired. This subgroup had the highest schizophrenia PGSs and had disadvantageous cognitive PGSs relative to control subjects and cognitively stable individuals. Individuals showing preadolescent impairment in cognitive and academic performance and poor adult outcome exhibited a generalized PGS disadvantage relative to control subjects and were the only subgroup to differ significantly in education and ADHD PGSs.

Conclusions: Subgroups derived from patterns of premorbid and current IQ showed different premorbid and clinical characteristics, which converged with broad genetic profiles. Simultaneous analysis of multiple PGSs may contribute to useful clinical stratification in schizophrenia.

Keywords: Cognition; Developmental Trajectory; Genetics; Polygenic Score; Premorbid IQ; Schizophrenia.


Conflict of interest statement

The authors report no financial relationships with relevant commercial interests.

Figures

Figure 1:
Figure 1:. Schematic of cognitive trajectory subtypes and results of premorbid/current IQ cluster analyses in 540 people with schizophrenia
The schematic in Panel A depicts three commonly described trajectories of cognitive development up to and through schizophrenia diagnosis: one (red) with evidence of early cognitive impairment suggesting pre-adolescent developmental issues; one (blue) showing a more stable course of cognitive development through adolescence despite emerging psychosis; and one (gold) highlighting the adolescent time frame as a period of disrupted cognitive development. The scatterplot in Panel B shows the clustering of 540 schizophrenia cases on the basis of premorbid (WRAT, y-axis) and current IQ (WAIS, x-axis) into subgroups that align with the three cognitive trajectory subtypes depicted in Panel A and with results from earlier studies(17): one (red) with evidence of early life cognitive impairment (i.e., low WRAT or premorbid IQ), as well as evidence of ongoing cognitive impairment in adulthood (i.e., low WAIS or current IQ); one (blue) with relatively better early life cognitive performance (i.e., higher WRAT) and continued better performance in adulthood (i.e., higher WAIS); and one (gold) with evidence of relatively good premorbid cognitive performance (i.e., high WRAT), but accompanied in this subgroup by substantially impaired adult performance (i.e., low WAIS).
Figure 2:
Figure 2:. Behavioral characteristics across cognitive trajectory subgroups
“PANSS”, Positive and Negative Syndrome Scale. Bars represent 95% confidence intervals. Statistical details are in Table 1. General cognitive ability (Panel A) is indexed by a composite score from a comprehensive neuropsychological battery(27) (see Supplementary Methods for additional information) – the cognitively stable subgroup shows relatively mild general cognitive impairment compared to the other subgroups. The cognitively stable group also completed the most education (Panel B), and the pre-adolescent impairment subgroup the least, with the adolescent decline subgroup intermediate. The adolescent decline subgroup was rated as having the highest levels of PANSS symptoms (Panel C) and the lowest level of overall functioning (Panel D). The pie charts illustrate that the pre-adolescent impairment subgroup included the highest proportion (47.6%) of individuals with learning difficulties (e.g., remedial classes, repeated grades) (Panel E), and that individuals in the cognitive stable subgroup were most likely to be employed (Panel F) at the time of study participation (38.7%).
Figure 3.
Figure 3.. Polygenic scores (PGSs) by diagnostic group (total N=1631) and by schizophrenia cognitive trajectory subgroup (N=540)
Bars represent 95% confidence intervals. Statistical details are in Tables 1 and 2. The figures depict the profiles of PGSs for the main diagnostic categories in our study (Panel A) and the schizophrenia cognitive trajectory subgroups (Panel B). PGSs were derived in our samples for schizophrenia (blue), cognition (red), educational attainment (green), and ADHD (gold). It warrants emphasis that for schizophrenia and ADHD PGS, higher standardized scores indicate higher disorder risk. For cognition and education PGSs, lower standardized scores predict worse cognitive and academic performance. All PGSs were adjusted to account for age, sex, and population stratification, and then standardized. We used control means and SD’s to standardize the PGSs so that controls serve as the reference for differences in PGSs across diagnostic categories and across cognitive trajectory subgroups.

Comment in

References

    1. Walker EF: Schizophrenia: A life-course developmental perspective. San Diego, CA, Academic Press, Inc.; 1991.
    1. Smoller JW, Andreassen OA, Edenberg HJ, et al. Psychiatric genetics and the structure of psychopathology. Mol Psychiatry. 2019;24:409–420. - PMC - PubMed
    1. Weinberger DR. Thinking About Schizophrenia in an Era of Genomic Medicine. Am J Psychiatry. 2019;176:12–20. - PubMed
    1. Kendler KS, Ohlsson H, Keefe RSE, et al. The joint impact of cognitive performance in adolescence and familial cognitive aptitude on risk for major psychiatric disorders: a delineation of four potential pathways to illness. Mol Psychiatry. 2018;23:1076–1083. - PMC - PubMed
    1. Mollon J, Reichenberg A. Cognitive development prior to onset of psychosis. Psychological Medicine. 2018;48:392–403. - PubMed

Publication types

MeSH terms