

Trends in cardiometabolic risk factors in the Americas between 1980 and 2014: a pooled analysis of population-based surveys
- PMID: 31839128
- PMCID: PMC7025323
- DOI: 10.1016/S2214-109X(19)30484-X
Trends in cardiometabolic risk factors in the Americas between 1980 and 2014: a pooled analysis of population-based surveys
Erratum in
-
Correction to Lancet Glob Health 2020; 8: e123-33.Lancet Glob Health. 2020 May;8(5):e648. doi: 10.1016/S2214-109X(20)30107-8. Epub 2020 Mar 12. Lancet Glob Health. 2020. PMID: 32171391 Free PMC article. No abstract available.
-
Correction to Lancet Glob Health 2020; 8: e123-33.Lancet Glob Health. 2021 Jan;9(1):e23. doi: 10.1016/S2214-109X(20)30516-7. Epub 2020 Dec 3. Lancet Glob Health. 2021. PMID: 33278918 Free PMC article. No abstract available.
Abstract
Background: Describing the prevalence and trends of cardiometabolic risk factors that are associated with non-communicable diseases (NCDs) is crucial for monitoring progress, planning prevention, and providing evidence to support policy efforts. We aimed to analyse the transition in body-mass index (BMI), obesity, blood pressure, raised blood pressure, and diabetes in the Americas, between 1980 and 2014.
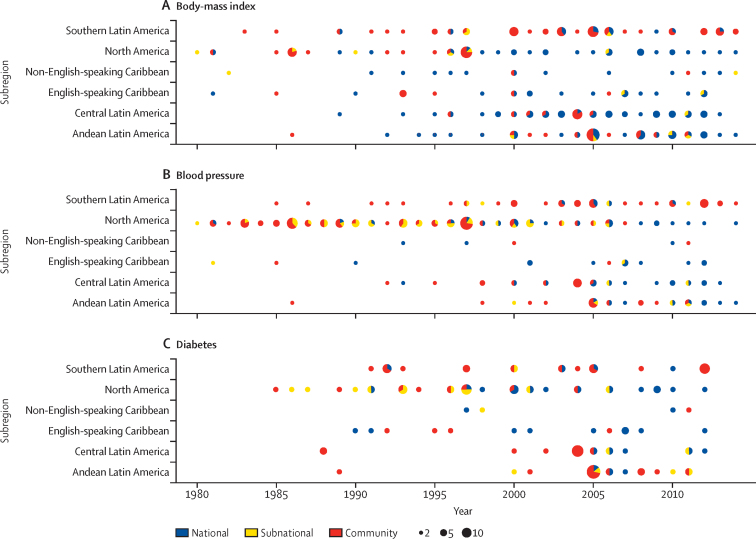
Methods: We did a pooled analysis of population-based studies with data on anthropometric measurements, biomarkers for diabetes, and blood pressure from adults aged 18 years or older. A Bayesian model was used to estimate trends in BMI, raised blood pressure (systolic blood pressure ≥140 mm Hg or diastolic blood pressure ≥90 mm Hg), and diabetes (fasting plasma glucose ≥7·0 mmol/L, history of diabetes, or diabetes treatment) from 1980 to 2014, in 37 countries and six subregions of the Americas.
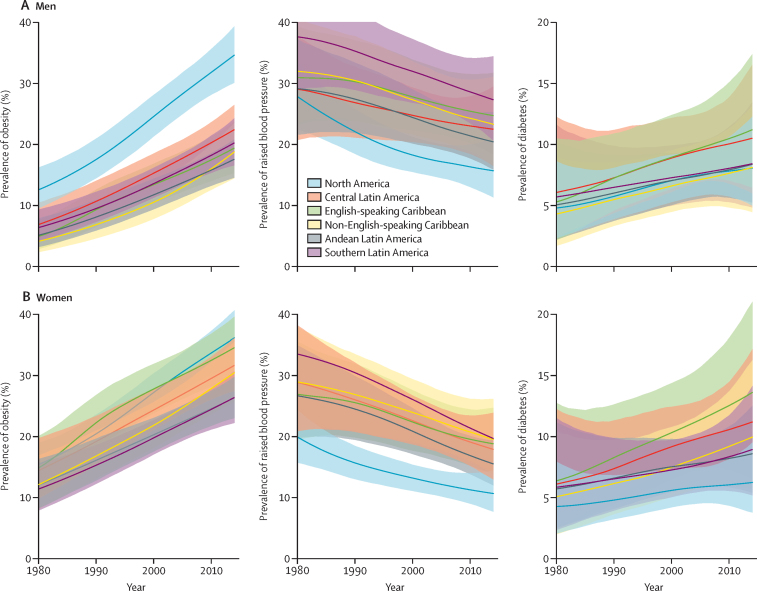
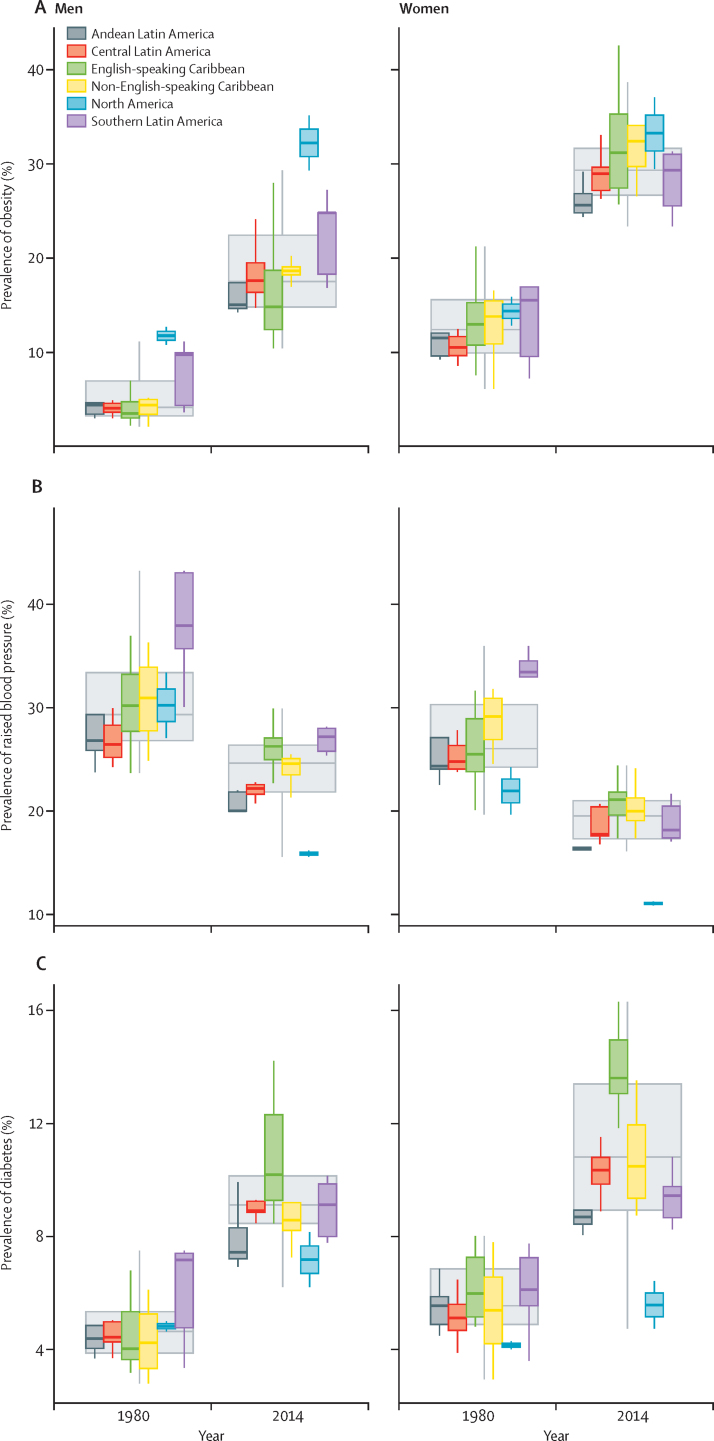
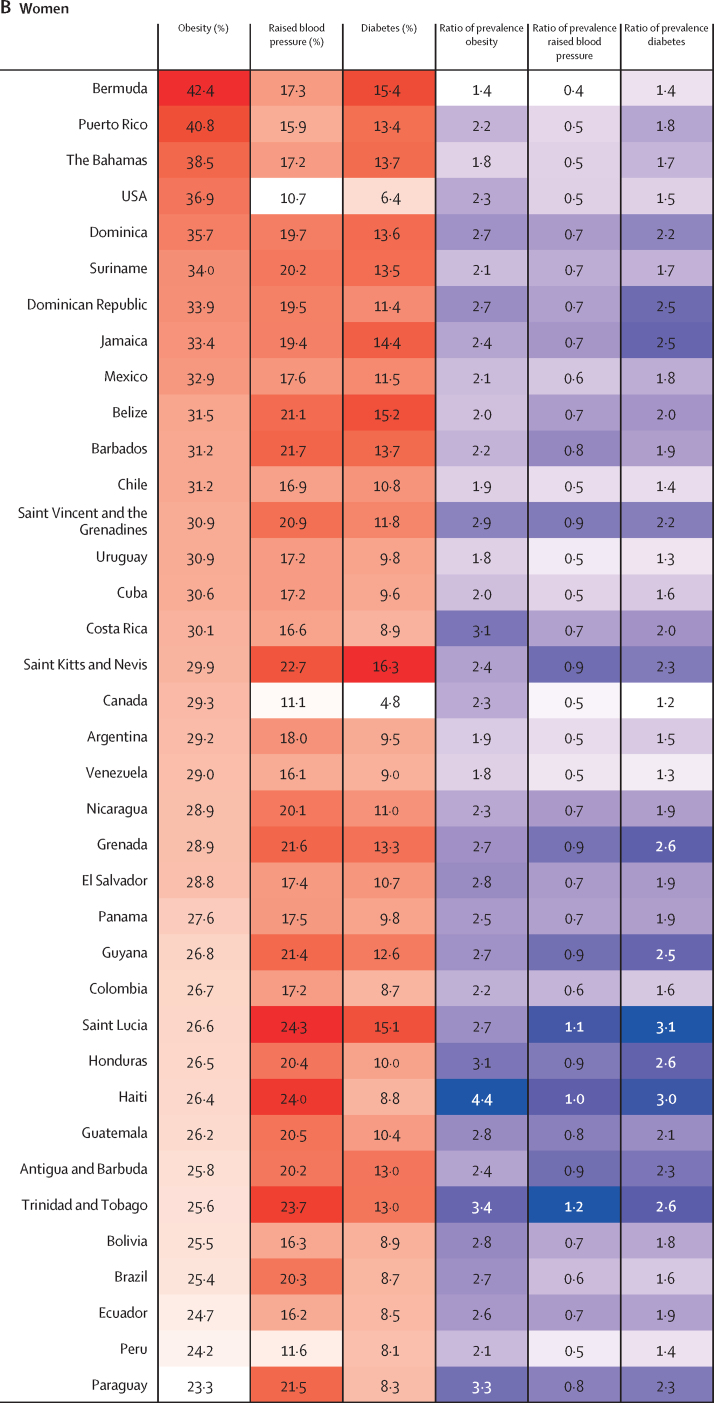
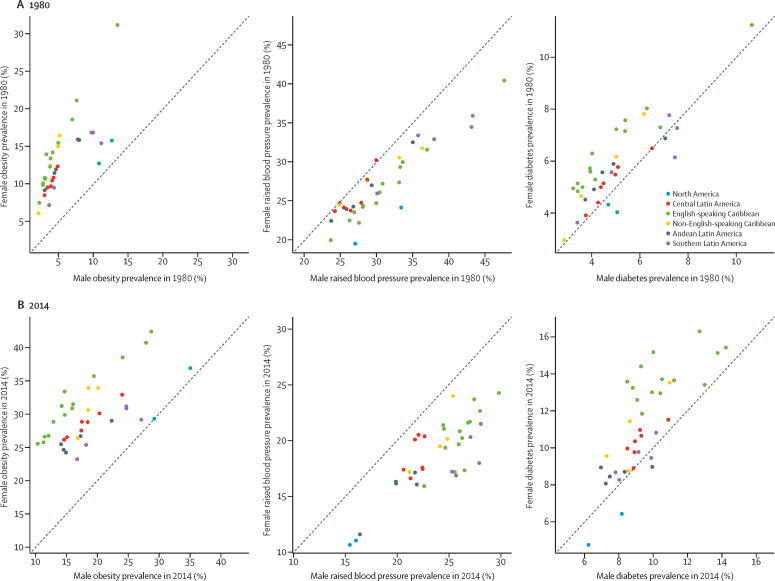
Findings: 389 population-based surveys from the Americas were available. Comparing prevalence estimates from 2014 with those of 1980, in the non-English speaking Caribbean subregion, the prevalence of obesity increased from 3·9% (95% CI 2·2-6·3) in 1980, to 18·6% (14·3-23·3) in 2014, in men; and from 12·2% (8·2-17·0) in 1980, to 30·5% (25·7-35·5) in 2014, in women. The English-speaking Caribbean subregion had the largest increase in the prevalence of diabetes, from 5·2% (2·1-10·4) in men and 6·4% (2·6-10·4) in women in 1980, to 11·1% (6·4-17·3) in men and 13·6% (8·2-21·0) in women in 2014). Conversely, the prevalence of raised blood pressure has decreased in all subregions; the largest decrease was found in North America from 27·6% (22·3-33·2) in men and 19·9% (15·8-24·4) in women in 1980, to 15·5% (11·1-20·9) in men and 10·7% (7·7-14·5) in women in 2014.
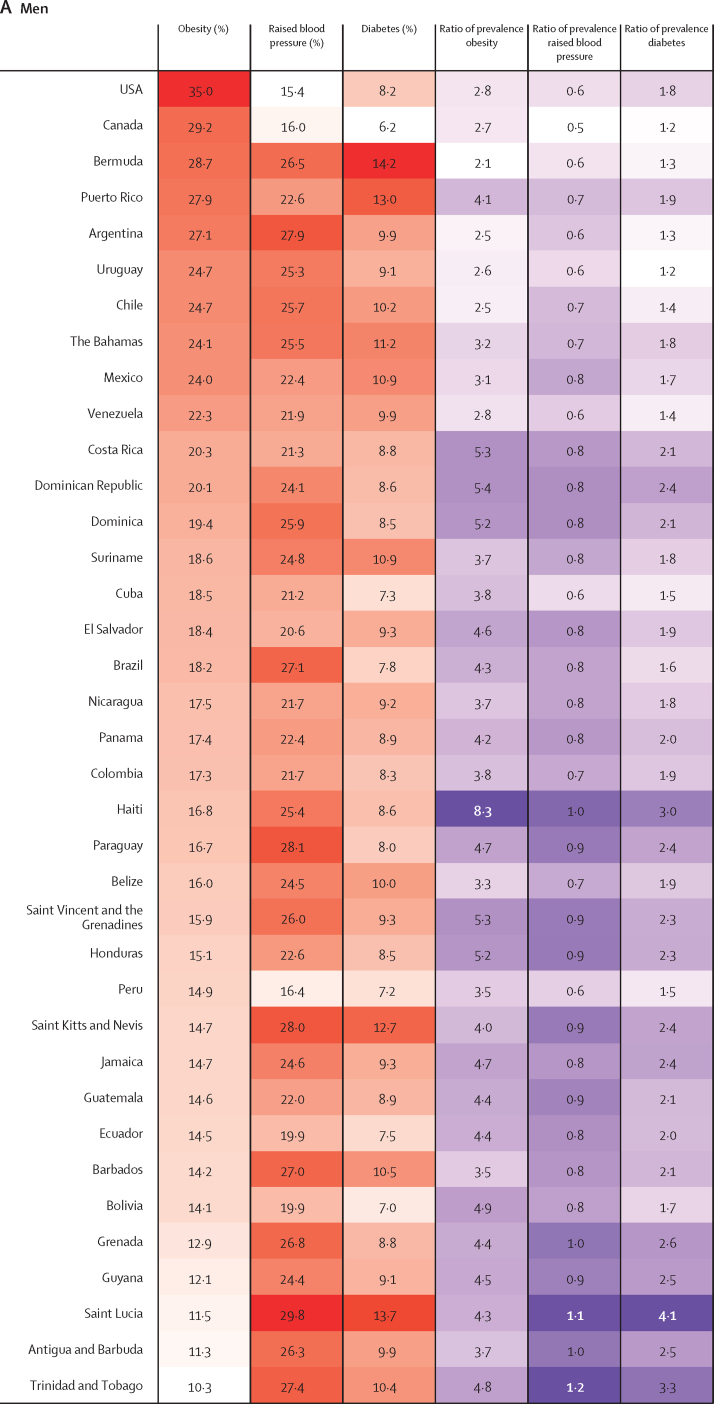
Interpretation: Despite the generally high prevalence of cardiometabolic risk factors across the Americas, estimates also showed a high level of heterogeneity in the transition between countries. The increasing prevalence of obesity and diabetes observed over time requires appropriate measures to deal with these public health challenges. Our results support a diversification of health interventions across subregions and countries.
Funding: Wellcome Trust.
Copyright © 2020 The Author(s). Published by Elsevier. This is an Open Access article under the CC BY 4.0 licence. Published by Elsevier Ltd.. All rights reserved.
Figures
Comment in
-
Diverging trends in obesity, diabetes, and raised blood pressure in the Americas.Lancet Glob Health. 2020 Jan;8(1):e18-e19. doi: 10.1016/S2214-109X(19)30503-0. Lancet Glob Health. 2020. PMID: 31839131 No abstract available.
References
-
- World Health Organization . WHO; Geneva: 2015. Noncommunicable Diseases Progress Monitor 2015.http://www.who.int/nmh/publications/ncd-progress-monitor-2015/en/
-
- GBD Compare Institute for Health Metrics and Evaluation. https://vizhub.healthdata.org/gbd-compare/
-
- Global Burden of Disease (GBD) Institute for Health Metrics and Evaluation. https://vizhub.healthdata.org/gbd-compare/
-
- PAHO . Pan American Health Organization; Washington, DC: 2014. Plan of action for the prevention and control of noncommunicable diseases in the Americas 2013–2019.https://www.paho.org/hq/dmdocuments/2014/NCD-en-lowres.pdf
-
- WHO . World Health Organization; Geneva: 2013. Global action plan for the prevention and control of noncommunicable diseases 2013–2020.
Publication types
MeSH terms
Grants and funding
LinkOut - more resources
Full Text Sources
Medical
