

doi: 10.1038/s41421-019-0127-5.
eCollection 2019.
Cellular redox state as a critical factor in initiating early embryonic-like program in embryonic stem cells
Affiliations
- PMID: 31839984
- PMCID: PMC6901566
- DOI: 10.1038/s41421-019-0127-5
Item in Clipboard
Cellular redox state as a critical factor in initiating early embryonic-like program in embryonic stem cells
Cell Discov.
.
No abstract available
Keywords: Embryonic stem cells; Totipotent stem cells.
Conflict of interest statement
Conflict of interestThe authors declare that they have no conflict of interest.
Figures
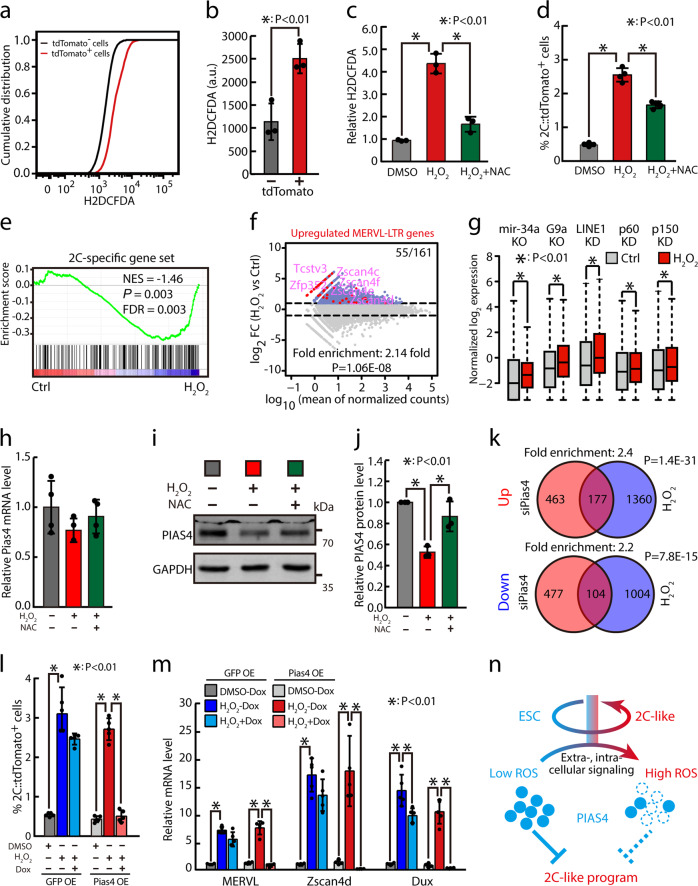
a Representative flow cytometry analyses shown as cumulative distribution plot of H2DCFDA intensity in 2C::tdTomato positive and negative ESCs. b Quantification of mean H2DCFDA intensities (arbitrary unit) in 2C::tdTomato positive and negative ESCs. Mean ± SD are shown, n = 3. The p value was calculated by two-tailed Student’s t test. c Relative ROS level quantified by H2DCFDA staining after DMSO or H2O2 treatment with or without addition of NAC. Data were normalized to DMSO treatment. Mean ± SD are shown, n = 3. The p value was calculated by one-way ANOVA with two-tailed Dunnett’s test. d Fraction of 2C::tdTomato-positive cells after DMSO or H2O2 treatment with or without addition of NAC. Mean ± SD are shown, n = 4. The p value was calculated by one-way ANOVA with two-tailed Dunnett’s test. e GSEA for 2C-specific genes in untreated control or H2O2-treated ESCs. For the x axis, genes were ranked based on the ratio of untreated control versus H2O2-treated ESCs. f MA plots showing gene expression changes in H2O2-treated ESCs. Red dots indicate MERVL-LTR-driven genes. Out of 161 MERVL-LTR-driven genes, 55 were upregulated in H2O2-treated ESCs. Fold enrichment and p value are shown. The p value was calculated by hypergeometric test. g Box-and-whisker plots showing expression of genes upregulated by mir-34a knockout, G9a knockout, LINE1 knockdown, and Caf-1 p150 or p60 subunit knockdown in cells treated with H2O2. The p value was determined by Wilcoxon signed-rank test. h RT-qPCR of Pias4 mRNA in ESCs treated with H2O2 with or without addition of NAC. The β-actin gene was used as a control. Data were normalized to DMSO treatment. Mean ± SD are shown, n = 4. Sequences of qPCR primers are listed in Supplementary Table S3. i Representative western blotting image of PIAS4 protein in ESCs treated with H2O2 with or without addition of NAC. j Quantification of PIAS4 protein in ESCs treated with H2O2 with or without addition of NAC. Data were normalized to GAPDH and then to untreated ESCs. Mean ± SD are shown, n = 3. The p value was calculated by one-way ANOVA with two-tailed Dunnett’s test. k The Venn diagram (Up) shows the overlap between siPias4-upregulated and H2O2-upregulated genes, and the Venn diagram (Bottom) shows the overlap between siPias4-downregulated and H2O2-downregulated genes. Fold enrichment and p value are shown. The p value was calculated by hypergeometric test. l Fraction of 2C::tdTomato-positive cells in DMSO or H2O2-treated ESCs with or without Pias4 overexpression. Mean ± SD are shown, n = 5. The p value was calculated by one-way ANOVA with two-tailed Dunnett’s test. m RT-qPCR of MERVL, Zscan4d, and Dux in DMSO or H2O2-treated ESCs with or without Pias4 overexpression. The β-actin gene was used as a control. Data were normalized to DMSO-treated ESCs transfected with control overexpression vectors with no addition of doxycycline. Mean ± SD are shown, n = 5. The p value was calculated by one-way ANOVA with two-tailed Dunnett’s test. Sequences of qPCR primers are listed in Supplementary Table S3. n Summary graph. High ROS level destabilizes PIAS4 protein, in turn leading to the activation of 2C-like transcriptional program
References
-
- Beddington RS, Robertson EJ. An assessment of the developmental potential of embryonic stem cells in the midgestation mouse embryo. Development. 1989;105:733–737. - PubMed
LinkOut - more resources
Full Text Sources
