Review
. 2019 Dec 4;5(12):eaaw9883.
doi: 10.1126/sciadv.aaw9883. eCollection 2019 Dec.

The polar regions in a 2°C warmer world

Affiliations
Review

The polar regions in a 2°C warmer world

Eric Post et al. Sci Adv. .

Abstract

Over the past decade, the Arctic has warmed by 0.75°C, far outpacing the global average, while Antarctic temperatures have remained comparatively stable. As Earth approaches 2°C warming, the Arctic and Antarctic may reach 4°C and 2°C mean annual warming, and 7°C and 3°C winter warming, respectively. Expected consequences of increased Arctic warming include ongoing loss of land and sea ice, threats to wildlife and traditional human livelihoods, increased methane emissions, and extreme weather at lower latitudes. With low biodiversity, Antarctic ecosystems may be vulnerable to state shifts and species invasions. Land ice loss in both regions will contribute substantially to global sea level rise, with up to 3 m rise possible if certain thresholds are crossed. Mitigation efforts can slow or reduce warming, but without them northern high latitude warming may accelerate in the next two to four decades. International cooperation will be crucial to foreseeing and adapting to expected changes.


Figures

Fig. 1
Fig. 1. Temperature trends and variability for the Arctic and Antarctic regions.
(A) Annual mean anomalies of the combined Land-Ocean Temperature Index (L-OTI) for the Arctic (64°N to 90°N), Antarctic (64°S to 90°S), and globe between 1880 and 2018 (zonal data bins defined by data acquired at https://data.giss.nasa.gov relative to the mean period 1951–1980). Temperature anomalies for the Arctic during each of the four IPYs, the first of which was based in the Arctic, are highlighted in purple. (B) Annual [January to December (J-D)] mean temperature change (°C) in the Northern (left) and Southern (right) hemispheres for 1986–2005 (upper) and 1986–2018 (lower) relative to the mean period of 1951–1980. Generated from the NASA/Goddard Institute for Space Studies (GISS) online plotting tool (2); the GISS analysis is based on updated Global Historical Climatology Network v3/SCAR (2, 3) and updates to Analysis (v3).
Fig. 2
Fig. 2. Approximate year by which the 2°C warming threshold is reached for the Arctic and Antarctic compared to the globe as a whole.
Expected time to 2°C warming above the 1981–2005 mean under RCP8.5 (red) and RCP4.5 (blue) for the globe (open circles) compared to the Arctic [solid circles; (A and B)] and Antarctic [solid circles; (C and D)]. Means of 36 CMIP5 ensemble runs by Overland et al. (1) are shown. In (B) and (D), symbols positioned at year 2100 indicate that 2°C warming could be at 2100 or later.
Fig. 3
Fig. 3. Greater warming likely in the Arctic and Antarctic with 2°C global warming.
Expected magnitude of monthly and mean annual warming above the 1981–2005 mean in the Arctic (solid circles) and Antarctic (open circles) with 2°C global warming under RCP8.5 (red) and RCP4.5 (blue) according to 36 CMIP5 ensemble runs by Overland et al. (1).
Fig. 4
Fig. 4. Declining Northern Hemisphere sea-ice extent.
Northern Hemisphere monthly sea-ice extent anomalies (relative to 1981–2010) from 1850 to 2018 updated after the Walsh et al. (14) dataset. Image credit: A. Barrett.
Fig. 5
Fig. 5. Reduced pollinator abundance following shorter overlap with flowering duration.
Association between current-year pollinator abundance and the number of days of overlap between pollinator presence and community-wide flowering during the previous year at Zackenberg, Greenland (1996–2009). White symbols denote muscid fly abundance, and gray symbols denote chironomid fly abundance. Modified from Høye et al. (84). Background photo of syrphid fly (Diptera) on dwarf fireweed (Chamerion latifolium) in Greenland. Photo credit: C. Urbanowicz.
Fig. 6
Fig. 6. Extensive reindeer mortality in West Siberia.
Semidomesticated reindeer belonging to Nenets herders frozen in position from the most extensive and severe rain-on-snow event on record for Yamal Peninsula, West Siberia, in which at least 61,000 animals died of starvation during winters of 2013–2014. Photo credit: R. Serotetto.
Fig. 7
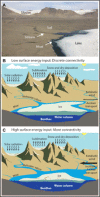
Fig. 7. Contrasting patterns of connectivity among components of an Antarctic ecosystem.
Controls on (A) the McMurdo dry valleys of Antarctica during (B) an austral summer of low surface energy input (solar radiation, conduction from air temperatures, etc.) and during (C) an austral summer of high surface energy input to the landscape. These physical changes to the system have direct implications for biological communities in each part of the ecosystem. Image credit: E. Parrish.

References

    1. Overland J. E., Wang M., Walsh J. E., Stroeve J. C., Future arctic climate changes: Adaptation and mitigation time scales. Earths Future 2, 68–74 (2014).
    1. GISTEMPTeam, NASA Goddard Institute for Space Studies (2018); https://science.gsfc.nasa.gov/earth/giss/.
    1. Hansen J., Ruedy R., Sato M., Lo K., Global surface temperature change. Rev. Geophys. 48, 2010RG000345 (2010).
    1. Intergovernmental Panel on Climate Change, Climate Change 2014: Impacts, Adaptation, and Vulnerability, in Contribution of Working Group II to the Fifth Assessment Report of the Intergovernmental Panel on Climate Change, C. B. Field, V. R. Barros, D. J Dokken, K. J. Mach, M. D. Mastrandrea, T. E. Bilir, M. Chatterjee, K. L. Ebi, Y. O. Estrada, R. C. Genova, B. Girma, E. S. Kissel, A. N. Levy, S. MacCracken, P. R. Mastrandrea, L. L. White, Eds. (Cambridge Univ. Press, 2014), pp. 1132.
    1. Ivy D. J., Solomon S., Calvo N., Thompson D. W. J., Observed connections of Arctic stratospheric ozone extremes to Northern Hemisphere surface climate. Environ. Res. Lett. 12, 024004 (2017).

Publication types