. 2019 Dec 11:2:123.
doi: 10.1038/s41746-019-0197-7. eCollection 2019.

Quantifying neurologic disease using biosensor measurements in-clinic and in free-living settings in multiple sclerosis

Affiliations

Quantifying neurologic disease using biosensor measurements in-clinic and in free-living settings in multiple sclerosis

Tanuja Chitnis et al. NPJ Digit Med. .

Abstract

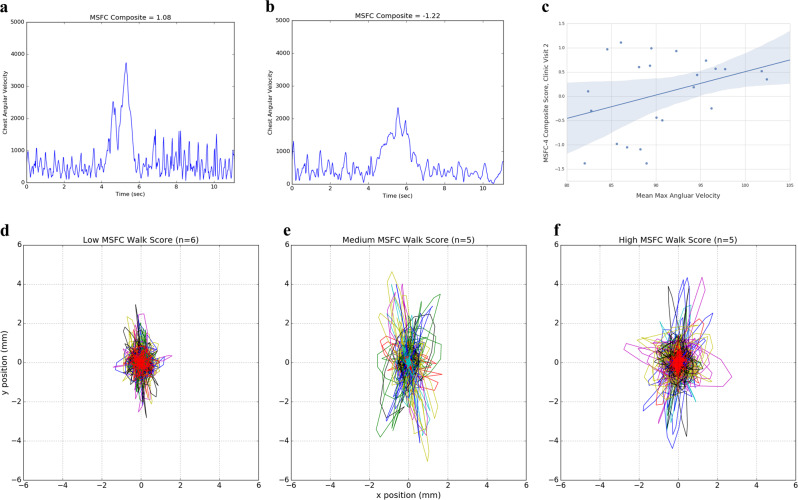
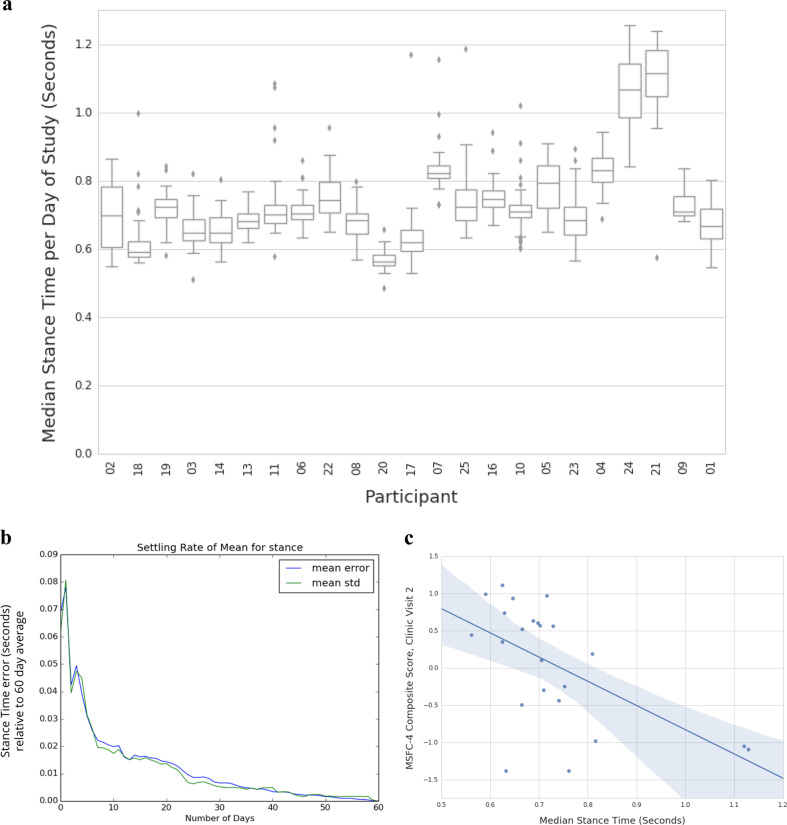
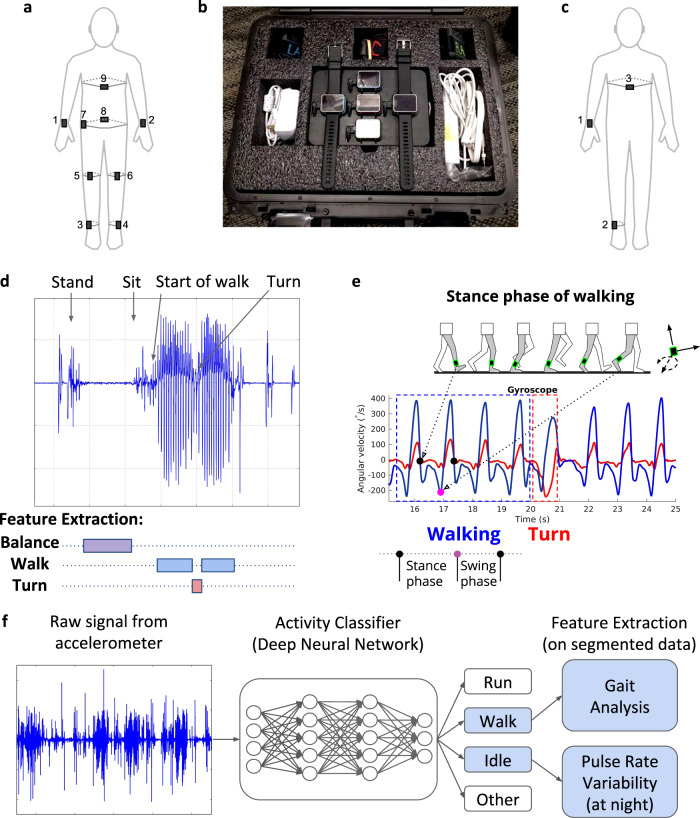
Technological advances in passive digital phenotyping present the opportunity to quantify neurological diseases using new approaches that may complement clinical assessments. Here, we studied multiple sclerosis (MS) as a model neurological disease for investigating physiometric and environmental signals. The objective of this study was to assess the feasibility and correlation of wearable biosensors with traditional clinical measures of disability both in clinic and in free-living in MS patients. This is a single site observational cohort study conducted at an academic neurological center specializing in MS. A cohort of 25 MS patients with varying disability scores were recruited. Patients were monitored in clinic while wearing biosensors at nine body locations at three separate visits. Biosensor-derived features including aspects of gait (stance time, turn angle, mean turn velocity) and balance were collected, along with standardized disability scores assessed by a neurologist. Participants also wore up to three sensors on the wrist, ankle, and sternum for 8 weeks as they went about their daily lives. The primary outcomes were feasibility, adherence, as well as correlation of biosensor-derived metrics with traditional neurologist-assessed clinical measures of disability. We used machine-learning algorithms to extract multiple features of motion and dexterity and correlated these measures with more traditional measures of neurological disability, including the expanded disability status scale (EDSS) and the MS functional composite-4 (MSFC-4). In free-living, sleep measures were additionally collected. Twenty-three subjects completed the first two of three in-clinic study visits and the 8-week free-living biosensor period. Several biosensor-derived features significantly correlated with EDSS and MSFC-4 scores derived at visit two, including mobility stance time with MSFC-4 z-score (Spearman correlation -0.546; p = 0.0070), several aspects of turning including turn angle (0.437; p = 0.0372), and maximum angular velocity (0.653; p = 0.0007). Similar correlations were observed at subsequent clinic visits, and in the free-living setting. We also found other passively collected signals, including measures of sleep, that correlated with disease severity. These findings demonstrate the feasibility of applying passive biosensor measurement techniques to monitor disability in MS patients both in clinic and in the free-living setting.

Keywords: Multiple sclerosis; Sensors and probes.


Conflict of interest statement

Competing interestsThe authors declare no competing interests.

Figures

Fig. 1
Fig. 1
In-clinic measures correlated with disease severity at the second clinic visit. Gyroscopic measurements at chest during turns, measuring angular velocity, differs with disease severity. a, b Representative traces for turns from less (a) and more (b) disabled subjects for angular velocity during turns during the timed-up and go test. c Spearman correlation across the entire cohort for the mean max angular velocity of observed turns (95% confidence interval shown for trend line). Postural sway also shows increased deviation in both left–right (x) and anterior–posterior (y) directions as disability scores increase; individual traces (unique color by subject) for 30-s balance portions are shown for three cohort subgroups based on MSFC walk score for (d) low disability, (e) medium disability, and (f) high disability.
Fig. 2
Fig. 2
Properties of free-living mobility measures extracted during classified walking periods. a Box and whiskers plots representing the distribution of daily stance time measures for that subject across each of the 56 days of measurement during the study; subjects are sorted by MSFC-4 clinic visit 2 scores. b Variability of the Stance time median value by number of days of observation within subjects. A variable number of days (from 1 up to all 56 + days) was compared to the overall study time median, demonstrating how averaging different ranges of data can help control for the overall variability. With 1 week’s worth of data, the standard error for stance time is within 0.02 s compared to 0.08 s with just 1 day’s worth of data. c Spearman correlation for median stance time, calculated across the entire 8-week free-living period; there is a correlation (−0.56, q-value = 0.0052) between this free-living measure and the MSFC-4 composite score at visit 2.
Fig. 3
Fig. 3
Experimental design and data segmentation. ac Biosensor diagram, including (a) nine sensor locations used in clinic, (b) the free-living kit of biosensors for wrists, ankles, and chest given to participants and (c) locations for daily wear. d Example segmentation and featurization of data from the in clinic assessments, where an example trace from the left ankle accelerometer is shown during structured activities that included standing, maintain balance for 30 s, sitting, and then performing a 25-foot timed-up and go test with a 180 degree turn in the middle. e Example featurization (based on multiple angular velocity signals) for detecting stance and swing phase of a step when walking, as well as turns. f Workflow for classifying activity from unstructured free-living data, where an activity classifier takes raw accelerometer input from the wrist-worn biosensor to identify idle, walking, running, and other activity periods in the data. Segmented data for walking undergo gait analysis using same algorithms as used for in clinic data featurization and shown in (e). Idle minutes are used to assess pulse rate variability, particularly at night to estimate stages of sleep.

References

    1. Janca A, et al. WHO/WFN Survey of neurological services: a worldwide perspective. J. Neurological Sci. 2006;247:29–34. doi: 10.1016/j.jns.2006.03.003. - DOI - PubMed
    1. Pugliatti M, et al. The epidemiology of multiple sclerosis in Europe. Eur. J. Neurol.: Off. J. Eur. Federation Neurological Soc. 2006;13:700–722. doi: 10.1111/j.1468-1331.2006.01342.x. - DOI - PubMed
    1. Reich DS, Lucchinetti CF, Calabresi PA. Multiple Sclerosis. N. Engl. J. Med. 2018;378:169–180. doi: 10.1056/NEJMra1401483. - DOI - PMC - PubMed
    1. Matsuda PN, Shumway-Cook A, Ciol MA, Bombardier CH, Kartin DA. Understanding falls in multiple sclerosis: association of mobility status, concerns about falling, and accumulated impairments. Phys. Ther. 2012;92:407–415. doi: 10.2522/ptj.20100380. - DOI - PubMed
    1. Racosta JM, et al. Cardiovascular autonomic dysfunction in multiple sclerosis: a meta-analysis. Mult. Scler. Relat. Disord. 2015;4:104–111. doi: 10.1016/j.msard.2015.02.002. - DOI - PubMed