. 2020 May;98(5):902-920.
doi: 10.1002/jnr.24568. Epub 2019 Dec 15.

Murine maternal dietary restriction affects neural Humanin expression and cellular profile

Affiliations

Murine maternal dietary restriction affects neural Humanin expression and cellular profile

Claire Baldauf et al. J Neurosci Res. 2020 May.

Abstract

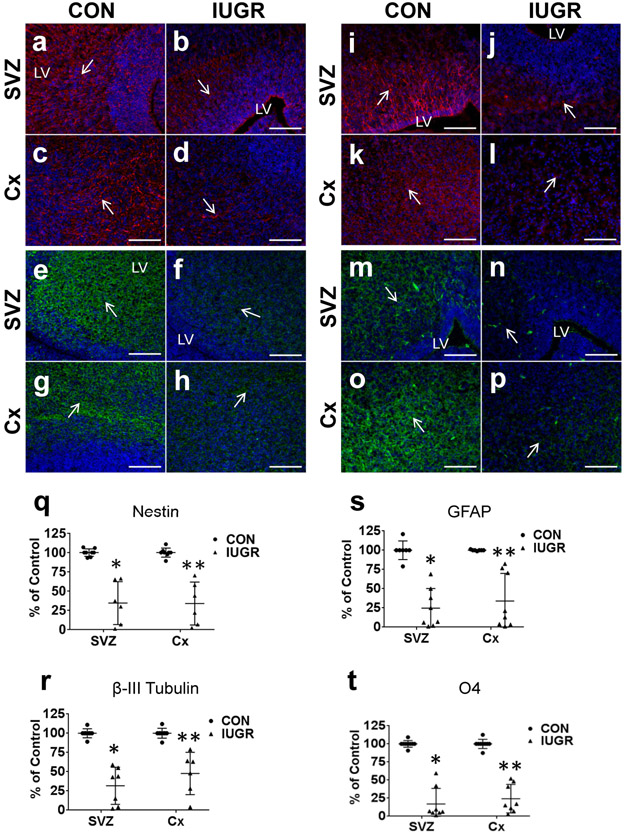
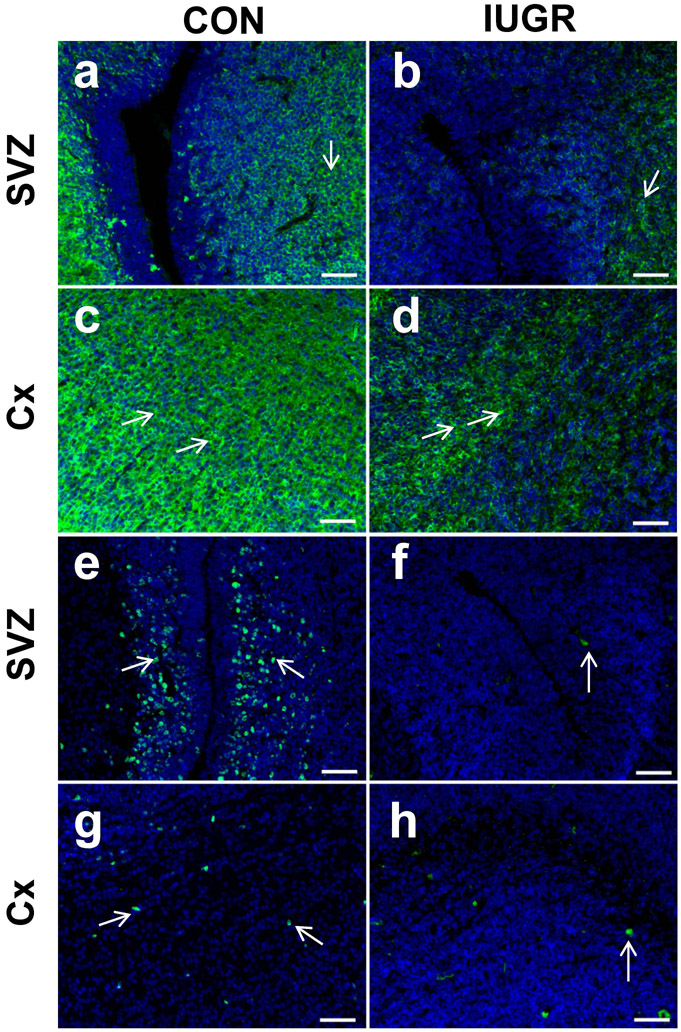
To understand the cellular basis for the neurodevelopmental effects of intrauterine growth restriction (IUGR), we examined the global and regional expression of various cell types within murine (Mus musculus) fetal brain. Our model employed maternal calorie restriction to 50% daily food intake from gestation day 10-19, producing IUGR offspring. Offspring had smaller head sizes with larger head:body ratios indicating a head sparing IUGR effect. IUGR fetuses at embryonic day 19 (E19) had reduced nestin (progenitors), β-III tubulin (immature neurons), Glial fibrillary acidic protein (astrocytes), and O4 (oligodendrocytes) cell lineages via immunofluorescence quantification and a 30% reduction in cortical thickness. No difference was found in Bcl-2 or Bax (apoptosis) between controls and IUGR, though qualitatively, immunoreactivity of doublecortin (migration) and Ki67 (proliferation) was decreased. In the interest of examining a potential therapeutic peptide, we next investigated a novel pro-survival peptide, mouse Humanin (mHN). Ontogeny examination revealed highest mHN expression at E19, diminishing by postnatal day 15 (P15), and nearly absent in adult (3 months). Subanalysis by sex at E19 yielded higher mHN expression among males during fetal life, without significant difference between sexes postnatally. Furthermore, female IUGR mice at E19 had a greater increase in cortical mHN versus the male fetus over their respective controls. We conclude that maternal dietary restriction-associated IUGR interferes with neural progenitors differentiating into the various cellular components populating the cerebral cortex, and reduces cerebral cortical size. mHN expression is developmental stage and sex specific, with IUGR, particularly in the females, adaptively increasing its expression toward mediating a pro-survival approach against nutritional adversity.

Keywords: Humanin; RRID:AB_10695870; RRID:AB_10950489; RRID:AB_1616567; RRID:AB_1619688; RRID:AB_2286684; RRID:AB_2313584; RRID:AB_2313773; RRID:AB_2336177; RRID:AB_2340375; RRID:AB_2340432; RRID:AB_305670; RRID:AB_443209; RRID:AB_477629; RRID:AB_477662; RRID:AB_532250; RRID:AB_561053; RRID:AB_631729; RRID:AB_650336; RRID:AB_732011; RRID:AB_772206; RRID:AB_793998; RRID:SCR_002140; RRID:SCR_002368; RRID:SCR_002798; RRID:SCR_013673; RRID:SCR_014246; RRID:SCR_017411; fetal brain; intrauterine growth restriction; neurodevelopment; nutrient restriction.


Conflict of interest statement

Conflicts of Interest: The authors declare no competing financial interests.

Figures

Figure 1.
Figure 1.
Comparison of cellular profile within intra-uterine growth restricted (IUGR) versus control murine fetal brain in regions of the subventricular zone (SVZ) and cerebral cortex (Cx). 10 μM coronal frozen sections were taken at embryonic day 19. Fluorescence quantification of IUGR versus control were compared using two-tailed Student t-test. Male and female samples were pooled. The IUGR brain demonstrated significantly lower expression than control in all markers (nestin, β-III Tubulin, GFAP, O4). a-d, nestin (red) expression, a cytoskeletal protein marking neural progenitor cells (arrows). q, Nestin quantification (CON n=8, IUGR n=6) in SVZ (t5 = 5.69; *P=0.002) and Cx (t5 = 5.71; **P=0.002). e-h, β-III Tubulin expression (green), marking newly generated immature neurons (arrows). r, β-III Tubulin quantification (CON n=8, IUGR n=7) in SVZ (t6 = 7.31; *P<0.001) and Cx: (t6 = 4.58; **P=0.004). i-l, Glial fibrillary acidic protein (GFAP) (red), a marker for astrocytes (arrows). s, GFAP quantification (n=7/group) in SVZ (t8 = 6.59; *P<0.001) and Cx (t6 = 5.2; **P=0.002). m-p, O4 (green), a marker for mature, immature, and pre-oligodendrocytes (arrows). t, O4 quantification (CON n=9, IUGR n=8) in SVZ (t7 = 10.73; *P<0.001) and Cx (t8 = 10.51; **P<0.001). Fluorescence quantification is shown (q-t) with IUGR expressed as a percent of control. Data are shown as means ± standard deviation. Scale bars 100 μM.
Figure 2.
Figure 2.
Western blot analysis examining murine fetal brain in regions of the subventricular zone (SVZ) and cerebral cortex (Cx) lysate of males and females at embryonic day 19 in control versus intra-uterine growth restricted (IUGR) fetal mice. a, Representative western blots demonstrating nestin, Glial Fibrillary Acidic Protein (GFAP) and β-III Tubulin on the top with their corresponding loading controls (Vinculin) below. N=4/group. b, c Graphs demonstrating the quantification of protein density as a ratio to the loading control, expressed as a percent of control in males (b) and females (c) respectively. Using two-tailed Student t-test, IUGR and CON groups were compared in SVZ and Cx regions for both sexes. Significant difference was found for nestin in the male SVZ and GFAP in the male Cx (nestin: t6=15.77, *P<0.0001; GFAP: t6=12.08, **P<0.0001). The remaining comparisons were not significant. N=4/group, data are shown as means ± standard error of the mean.
Figure 3.
Figure 3.
Comparison of doublecortin (a-d) and Ki67 (e-h) expression within control versus intra-uterine growth restricted (IUGR) murine fetal brain in regions of the subventricular zone (SVZ) and cerebral cortex (Cx). 10 μM coronal frozen sections taken at embryonic day 19. Doublecortin is a marker for neural migration, and Ki67 is a marker for proliferation. There appears to be qualitatively a lower expression in the IUGR brain for both markers. Scale bars 50 μM.
Figure 4.
Figure 4.
Cortical thickness of control versus intra-uterine growth restricted (IUGR) fetal murine brain at embryonic day 19. Sections were 10 μM frozen coronal with pooled male and female samples. a, Full cerebral cortex thickness was measured from the edge of the lateral ventricle through the marginal zone in a perpendicular orientation to the cortical layers (depicted by a large white arrow). Intermediate zone thickness was measured from the edge of the cortical plate to the edge of the subventricular zone (red bracket) b, Quantification using two-tailed Student t-test (n=4/group) showed a 29.5% reduction in cerebral cortex thickness of the IUGR brain compared to control (t6 =2.8, *P-value=0.031). There was a 71% reduction in intermediate zone thickness of the IUGR brain compared to control (t6=6.3, **P-value=0.0007). Scale bars 50 μM. Data are shown as means ± standard deviation.
Figure 5.
Figure 5.
Immunofluorescence staining of mouse Humanin (mHN) expression (green) in the cerebral cortex (Cx) and subventricular zone (SVZ) at differing stages of murine brain development. Sections were frozen 10 μM and coronal. a-c, At embryonic day (E10) the cortex has only two layers, the ventricular zone (VZ) and pre-plate (PP) with both expressing mHN (arrows). d-f, At E15 mHN was expressed strongly in the marginal zone (MZ) and intermediate zone (IZ) of the Cx (arrows) with lighter staining within the cortical plate (CP). Periventricular cells lining the lateral ventricle (LV) also show mHN expression (arrow). g-i, Similar to E15 Cx, mHN expression at E19 was localized to the MZ and IZ of the Cx as well as periventricular cells (arrows). By the adult stage at 3 months (j-l), mHN was minimally expressed. Scale bars, 100 μm.
Figure 6.
Figure 6.
Western blot analysis demonstrating mouse Humanin (mHN) expression in regions of the subventricular zone (SVZ) and cerebral cortex (Cx) at three developmental time points in males and females (n=4/group): embryonic day 19 (E19), post-natal day 15 (P15) and 3-month-old adult. a, Representative Western blots for males (left) and females (right) probed with anti-HN antibody. Corresponding vinculin loading control shown below. Both 14kD and 6kD bands were included in the quantification for mHN. Multiple comparison of mHN expression in males (b, c) and females (d,e) in the Cx and SVZ regions at the three developmental time points. Quantification of protein density given as a ratio to vinculin, expressed as a percent of E19 concentration. One-way ANOVA with Fisher’s PLSD was performed and there were significant differences between groups in males, but not females. Expression of mHN decreased over time with highest amounts at E19 and lowest in adulthood. In the male Cx: F(2, 9)=30.53, P<0.0001, *P=0.004, *P<0.001 and ***P=0.003; in male SVZ, F(2, 9)=28.38 ƗP=0.004,ǂP<0.001, $P=0.005; Females appeared to trend in this pattern as well but the results did not reach significance. NS, non-significant. Data are shown as means ± standard error of the mean.
Figure 7.
Figure 7.
Dual immunostaining of mouse Humanin (mHN) (green, first row) plus each of four different cell markers with known periventricular expression (red, second row). DAPI is blue. Coronal frozen sections at 10 μM of murine brain at embryonic day 19 (E19) in the region of the ventricular zone (VZ). White dotted boxes in the merged images outline an area focused upon to increase magnification in order to present details in an inset at the bottom left corner of the image. Expression of mHN in this area was within the periventricular cells lining the lateral ventricle (LV) (see arrows). a-d, Vimentin is an intermediate filament protein expressed in mesenchymal cells and several neural cell types. Here its expression as seen in the choroid plexus (CP), periventricular cells, and throughout the VZ (arrows at CP and VZ). Merged image reveals discrete red and green signals indicating that Vimentin and mHN co-express in some cells but do not co-localize (arrow). e-h, Notch-1 is a transmembrane signaling protein that helps maintain radial glial cells (RGCs) in their undifferentiated state. Notch-1 demonstrates expression in the periventricular cells extending to the VZ (one arrow each site). Merged images appear yellow at the ventricular surface (arrow), however confocal imaging (Supplemental Video 2) demonstrates no true co-localization. i-l, Nestin is an intermediate filament protein expressed in progenitor cells during the early stages of central nervous system development. Nestin was seen throughout the VZ (arrow) with some cells expressing both nestin and mHN, though no co-localization was seen (arrow). m-p, Sox-2 is a transcription factor essential for maintaining pluripotency of embryonic stem cells. Sox-2 staining was seen in the nucleus, appearing pink where it co-expresses with DAPI (arrow in VZ demonstrating pink cells). Expression was strongest in the VZ, decreasing as it moves away from the LV. Clear separation of red and green signals indicated no co-localization between mHN and Sox-2 (arrow). Scale bars, 50 μm. Inset image (in merged images) scale bars = 10 μm.
Figure 8.
Figure 8.
Western blots (a & b) and immunostaining (c) of mouse Humanin (mHN) protein, in control versus intra-uterine growth restricted (IUGR) murine embryonic day 19 (E19) fetal brain in regions of the subventricular zone (SVZ) and cerebral cortex (Cx). a, Representative western blots showing both 14kD and 6kD mHN bands in males (left lanes) and females (right lanes). b, Quantification of mHN protein density as a ratio to loading control, expressed as a percent of control. Results were analyzed as sex-specific sub-sets, region specific (SVZ and Cx) and protein bands (14kD and 6kD) as labeled. In female Cx, both mHN at 6kD and 14kD were significantly increased in IUGR compared with CON (6kD, t6=7.7611, *p=0.0003; 14kD, t6=5.913, **p=0.001). Statistical test was two-tailed Student t-test with n=4/group, Data are shown as means ± standard error of the mean. c, Immunostaining of mHN coronal frozen sections (10 μM) taken at embryonic day 19 (E19). Control and IUGR brain demonstrate similar expression patterns. Within the SVZ, mHN was expressed in periventricular cells lining the lateral ventricle (LV) while in the Cx it was primarily within the intermediate zone (IZ) and marginal zone (MZ) (arrows). Scale bars 100μM.

Similar articles

Cited by

References

    1. Arakawa T, Niikura T, Tajima H, & Kita Y (2006). The secondary structure analysis of a potent Ser14Gly analog of antiAlzheimer peptide, Humanin, by circular dichroism. J Pept Sci, 12(10), 639–642. doi:10.1002/psc.773 - DOI - PubMed
    1. Artavanis-Tsakonas S, & Muskavitch MA (2010). Notch: the past, the present, and the future. Curr Top Dev Biol, 92, 1–29. doi:10.1016/S0070-2153(10)92001-2 - DOI - PubMed
    1. Artavanis-Tsakonas S, Rand MD, & Lake RJ (1999). Notch signaling: cell fate control and signal integration in development. Science, 284(5415), 770–776. - PubMed
    1. Capt C, Passamonti M, & Breton S (2016). The human mitochondrial genome may code for more than 13 proteins. Mitochondrial DNA A DNA Mapp Seq Anal, 27(5), 3098–3101. doi:10.3109/19401736.2014.1003924 - DOI - PubMed
    1. Chai GS, Duan DX, Ma RH, Shen JY, Li HL, Ma ZW, … Liu G (2014). Humanin attenuates Alzheimer-like cognitive deficits and pathological changes induced by amyloid beta-peptide in rats. Neurosci Bull, 30(6), 923–935. doi:10.1007/s12264-014-1479-3 - DOI - PMC - PubMed

Publication types

MeSH terms

Substances