Review
. 2019;63(8-9-10):407-416.
doi: 10.1387/ijdb.190265pd.

The excitable signal transduction networks: movers and shapers of eukaryotic cell migration

Affiliations
Review

The excitable signal transduction networks: movers and shapers of eukaryotic cell migration

Dhiman S Pal et al. Int J Dev Biol. 2019.

Abstract

In response to a variety of external cues, eukaryotic cells display varied migratory modes to perform their physiological functions during development and in the adult. Aberrations in cell migration result in embryonic defects and cancer metastasis. The molecular components involved in cell migration are remarkably conserved between the social amoeba Dictyostelium and mammalian cells. This makes the amoeba an excellent model system for studies of eukaryotic cell migration. These migration-associated components can be grouped into three networks: input, signal transduction and cytoskeletal. In migrating cells, signal transduction events such as Ras or PI3K activity occur at the protrusion tips, referred to as 'front', whereas events such as dissociation of PTEN from these regions are referred to as 'back'. Asymmetric distribution of such front and back events is crucial for establishing polarity and guiding cell migration. The triggering of these signaling events displays properties of biochemical excitability including all-or-nothing responsiveness to suprathreshold stimuli, refractoriness, and wave propagation. These signal transduction waves originate from a point and propagate towards the edge of the cell, thereby driving cytoskeletal activity and cellular protrusions. Any change in the threshold for network activation alters the range of the propagating waves and the size of cellular protrusions which gives rise to various migratory modes in cells. Thus, this review highlights excitable signal transduction networks as key players for coordinating cytoskeletal activities to drive cell migration in all eukaryotes.


Conflict of interest statement

COMPETING FINANCIAL INTERESTS

The authors declare no competing financial interests.

Figures
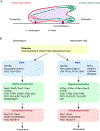
Figure 1.
Figure 1.. Molecular components involved in eukaryotic migration.
(A) Eukaryotic migration is achieved by extending actin-rich protrusions at the leading edge of the cell (as shown in green), coordinated with actomyosin-based contraction at the trailing edge (denoted in red). These cells develop active sites for actin polymerization, called focal adhesions, underneath the leading edge for integrin-dependent adhesion and migration. (B) Independent genetic and biochemical experimentation have identified various components involved in directed cell migration which can be grouped into 3 networks- input, signal transduction, and cytoskeletal events. Some of the important components for each of these networks have been highlighted in the cartoon. A variety of external stimuli, such as chemoattractant (chemicals), electric fields and mechanical forces, locally activate the signal transduction networks through input networks, leading to cytoskeletal events such as F-actin polymerization at the front and actomyosin-based contraction at the back of the cell. This coordinated activation of these networks results in chemotaxis (directed cell migration) and is functionally conserved in Dictyostelium (left) and mammalian cells (right).
Figure 2.
Figure 2.. Complementary distributive pattern of front and back activities in Dictyostelium cells undergoing various morphological changes.
Front activities, such as Ras or PI3K activation, occur at the protrusions of migrating vegetative or developed cells, respectively (denoted in dark green, top row). These front activities are complemented with back activities, such as dissociation of PTEN, at the cellular protrusions (denoted in red, bottom row). During cytokinesis, these front molecules are found at the poles of the dividing cells and the back molecules accumulate at the cleavage furrow. This complimentary pattern of front and back molecules is conserved in fused Dictyostelium cells. Upon global or gradient chemoattractant stimulation, latrunculin A-treated cells also show opposite distribution of front and back activities.
Figure 3.
Figure 3.. Conservation of PIP3 and F-actin waves in Dictyostelium and mammalian cells.
(A) Time lapse merged confocal images showing distribution of LimE (red) and PHcrac (green) in waves at the basal surface of a migrating fused Dictyostelium cell (left). Intensity plot across the white arrow in image “24 sec” (right). (B) Time lapse merged confocal images of LifeAct (red) and PHAkt (green) in waves at the basal surface of a RAW 264.7 macrophage cell (left). Intensity plot across the white arrow in image “288 sec” (right).
Figure 4.
Figure 4.. Cartoon depicting molecular architecture of STEN and the various feedback loops involved.
The positive feedback in STEN is brought about by mutual inhibition of active (F; activation of Ras/Rap) and inactive (B; PIP2) states at the cell cortex, and a delayed negative feedback from R (refractory), due to delayed PKB activation by PIP3, to F state. The PKBs feeds into CEN and promotes F-actin polymerization which, in turn, provides a fast positive and slow negative feedbacks to STEN. Abbreviations: STEN, signal transduction excitable networks; CEN, cytoskeletal excitable networks.
Figure 5.
Figure 5.. Perturbation of STEN threshold alters wave behavior and ultimately changes protrusion pattern necessary for cell migration.
(A) Left; confocal images showing LimE patterns in the protrusions of single (top) or basal surface of fused (bottom) Dictyostelium cells, in absence of any synthetic perturbation to the threshold for STEN activation. Right; cartoon depicting the cortical wave patterns corresponding to cellular morphology in the ‘unperturbed’ single (top) or fused (bottom) cells. (B) Left; confocal images showing LimE distribution on the basal surface of single (top) or fused (bottom) Dictyostelium cells, upon lowering of the threshold for STEN activation. In single cells, it causes the size of cellular protrusions to expand from small macropinosomes or pseudopodia (as seen in unperturbed cells) to wide, sheet-like protrusions resembling lamellipodia. This ultimately changes the migratory mode of the cells from amoeboid to oscillatory or fan-shaped. Right; cartoon depicting the cortical wave patterns corresponding to cellular morphology in the single (top) or fused (bottom) cells.

References

    1. Allen GM, Mogilner A and Theriot JA (2013). “Electrophoresis of cellular membrane components creates the directional cue guiding keratocyte galvanotaxis.” Curr Biol 23(7): 560–568. - PMC - PubMed
    1. Alvarez-Gonzalez B, Meili R, Firtel R, Bastounis E, Del Alamo JC and Lasheras JC (2014). “Cytoskeletal Mechanics Regulating Amoeboid Cell Locomotion.” Appl Mech Rev 66(5). - PMC - PubMed
    1. Anderson KI and Cross R (2000). “Contact dynamics during keratocyte motility.” Curr Biol 10(5): 253–260. - PubMed
    1. Andre E, Brink M, Gerisch G, Isenberg G, Noegel A, Schleicher M, Segall JE and Wallraff E (1989). “A Dictyostelium mutant deficient in severin, an F-actin fragmenting protein, shows normal motility and chemotaxis.” J Cell Biol 108(3): 985–995. - PMC - PubMed
    1. Arai Y, Shibata T, Matsuoka S, Sato MJ, Yanagida T and Ueda M (2010). “Self-organization of the phosphatidylinositol lipids signaling system for random cell migration.” Proc Natl Acad Sci U S A 107(27): 12399–12404. - PMC - PubMed

Publication types