. 2020 May;29(9):1596-1610.
doi: 10.1111/mec.15329. Epub 2020 Jan 2.

Ancient DNA suggests modern wolves trace their origin to a Late Pleistocene expansion from Beringia

Affiliations

Ancient DNA suggests modern wolves trace their origin to a Late Pleistocene expansion from Beringia

Liisa Loog et al. Mol Ecol. 2020 May.

Abstract

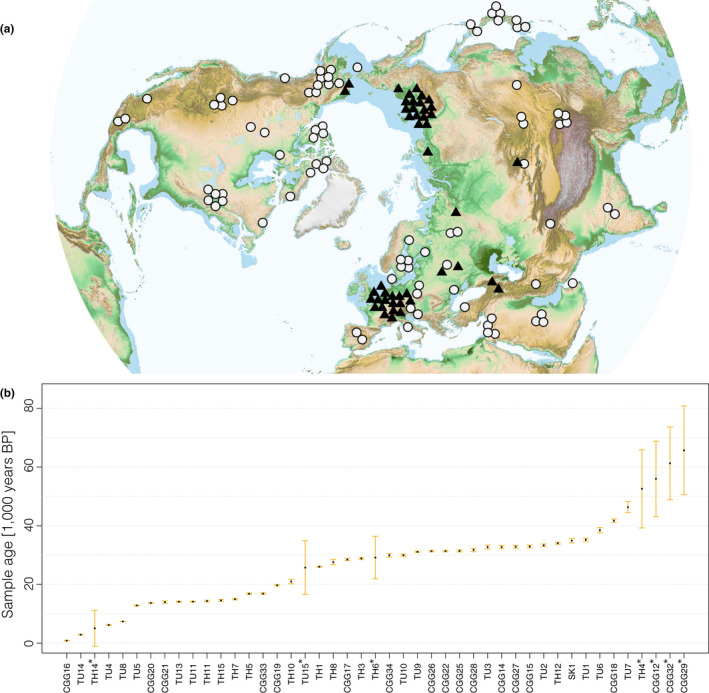
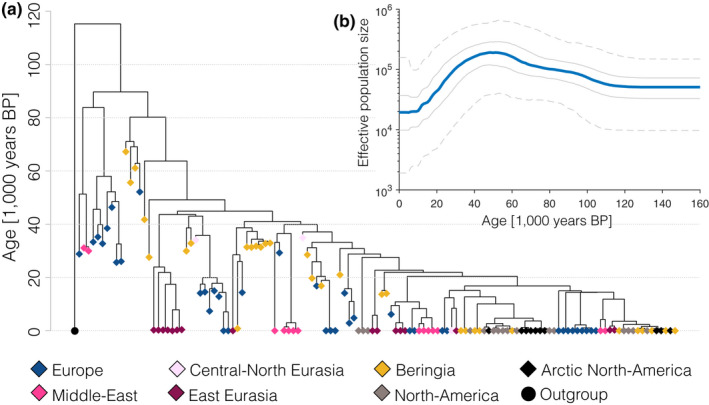
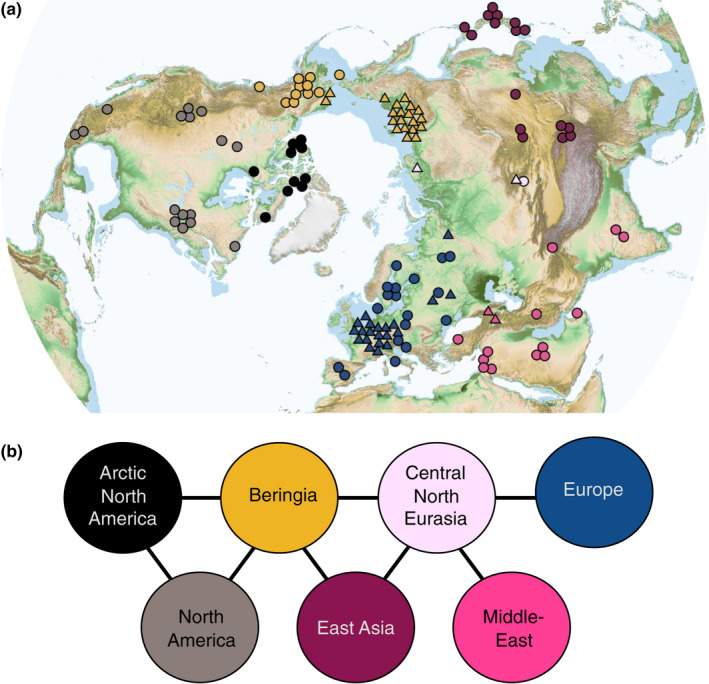
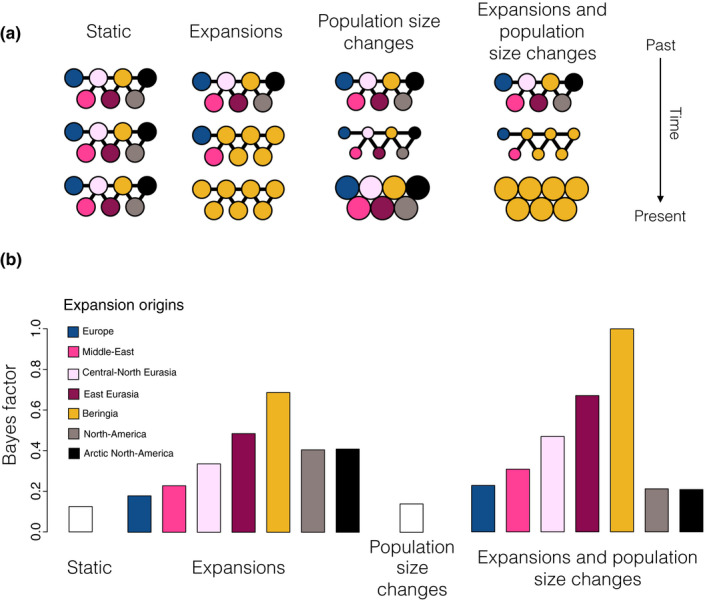
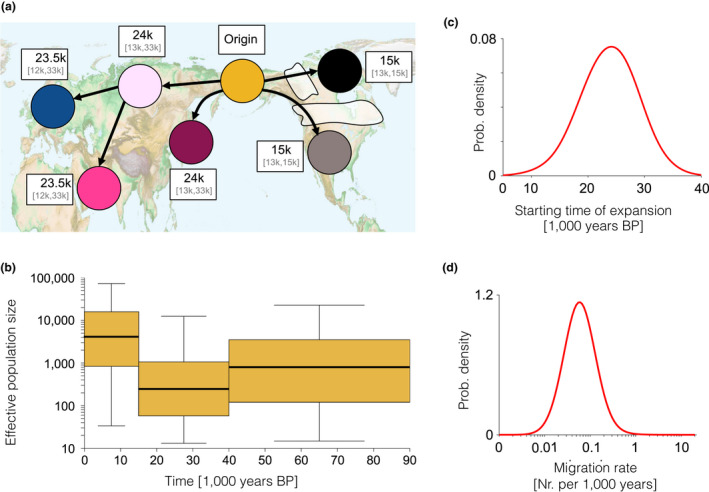
Grey wolves (Canis lupus) are one of the few large terrestrial carnivores that have maintained a wide geographical distribution across the Northern Hemisphere throughout the Pleistocene and Holocene. Recent genetic studies have suggested that, despite this continuous presence, major demographic changes occurred in wolf populations between the Late Pleistocene and early Holocene, and that extant wolves trace their ancestry to a single Late Pleistocene population. Both the geographical origin of this ancestral population and how it became widespread remain unknown. Here, we used a spatially and temporally explicit modelling framework to analyse a data set of 90 modern and 45 ancient mitochondrial wolf genomes from across the Northern Hemisphere, spanning the last 50,000 years. Our results suggest that contemporary wolf populations trace their ancestry to an expansion from Beringia at the end of the Last Glacial Maximum, and that this process was most likely driven by Late Pleistocene ecological fluctuations that occurred across the Northern Hemisphere. This study provides direct ancient genetic evidence that long-range migration has played an important role in the population history of a large carnivore, and provides insight into how wolves survived the wave of megafaunal extinctions at the end of the last glaciation. Moreover, because Late Pleistocene grey wolves were the likely source from which all modern dogs trace their origins, the demographic history described in this study has fundamental implications for understanding the geographical origin of the dog.

Keywords: Approximate Bayesian Computation; Pleistocene; ancient DNA; coalescent modelling; megafauna; population structure; population turnover; wolves.


Figures

Figure 1
Figure 1
Geographical distribution of modern (<500 years old, circles) and ancient (>500 years old, triangles) samples (a) and temporal distribution of ancient samples (b) used in the analyses. The geographical locations of the samples have been slightly adjusted for clarity (see Table S1 for exact sample locations). *Samples dated by molecular dating [Colour figure can be viewed at wileyonlinelibrary.com]
Figure 2
Figure 2
(a) Tip calibrated beast tree of all samples used in the spatial analyses (diamonds), coloured by geographical region. The circle represents an outgroup (modern Indian wolf, not used in the analyses). (b) The effective population size through time from the beast analysis (Bayesian skyline plot). The solid blue line represents the median estimate and the grey lines represent the interquartile range (sold lines) and 95% intervals (dashed lines) [Colour figure can be viewed at wileyonlinelibrary.com]
Figure 3
Figure 3
(a) Sample locations and geographical regions, with boundaries indicated by dashed lines. The dark blue indicates sea levels shallow enough to be land during the Last Glacial Maximum (sea depth < 120 m). (b) Model network of populations (“demes”), connected by gene flow, corresponding to the regions in (a)
Figure 4
Figure 4
Spatially and temporally explicit analysis. (a) Illustration of the different scenarios, with circles representing one deme each for the seven different geographical regions (see panel b for colour legend and text for full description of the scenarios). Solid lines represent population connectivity. The static scenario (far left) shows stable populations through time. The expansion scenario (middle left) shows how one deme (here yellow) expands and sequentially replaces the populations in all other demes (from top to bottom). The population size change scenario (middle right) illustrates how population size in the demes can change through time (large or small population size shown as large or small circles, respectively). We also show a combined scenario (far right) of both expansion and population size change. (b) Likelihood of each demographic scenario relative to the most likely scenario, shown as Bayes factors, estimated using Approximate Bayesian Computation analyses (see text for details). For expansion scenarios (including the combined expansion and population size changes), we colour code each bar according to the origin of the expansion (see colour legend)
Figure 5
Figure 5
The inferred scenario of wolf demography from the Bayesian analysis using our spatially and temporally explicit model (see Figure 4 and the main text). (a) Geographical representation of the expansion scenario (out of Beringia) with median and 95% confidence interval (CI) for the date of the population replacement in each deme given in white boxes next to each deme. (b) Effective population size (thick line, boxes and whiskers show the median, interquartile range and 95% CI, respectively, for each time period). (c) Posterior distribution of migration rate and (d) starting time of expansion [Colour figure can be viewed at wileyonlinelibrary.com]

Comment in

References

    1. Aggarwal, R. K. , Kivisild, T. , Ramadevi, J. , & Singh, L. (2007). Mitochondrial DNA coding region sequences support the phylogenetic distinction of two Indian wolf species. Journal of Zoological Systematics and Evolutionary Research, 45, 163–172. 10.1111/j.1439-0469.2006.00400.x - DOI
    1. Amante, C. , & Eakins, B. W. (2016). ETOPO1 1 Arc‐Minute Global Relief Model: Procedures, Data Sources and Analysis. NOAA Technical Memorandum NESDIS NGDC‐24. Retrieved from https://www.ngdc.noaa.gov/mgg/global/
    1. Barnosky, A. D. , Koch, P. L. , Feranec, R. S. , Wing, S. L. , & Shabel, A. B. (2004). Assessing the causes of late Pleistocene extinctions on the continents. Science, 306, 70–75. 10.1126/science.1101476 - DOI - PubMed
    1. Baryshnikov, G. F. , Mol, D. , & Tikhonov, A. N. (2009). Finding of the Late Pleistocene carnivores in Taimyr Peninsula (Russia, Siberia) with paleoecological context. Russian Journal of Theriology, 8, 107–113. 10.15298/rusjtheriol.08.2.04 - DOI
    1. Beaumont, M. A. , Zhang, W. , & Balding, D. J. (2002). Approximate Bayesian Computation in population genetics. Genetics, 162, 2025–2035. - PMC - PubMed

Publication types

LinkOut - more resources