. 2019 Dec 16:8:e52135.
doi: 10.7554/eLife.52135.

PCK1 and DHODH drive colorectal cancer liver metastatic colonization and hypoxic growth by promoting nucleotide synthesis

Affiliations

PCK1 and DHODH drive colorectal cancer liver metastatic colonization and hypoxic growth by promoting nucleotide synthesis

Norihiro Yamaguchi et al. Elife. .

Abstract

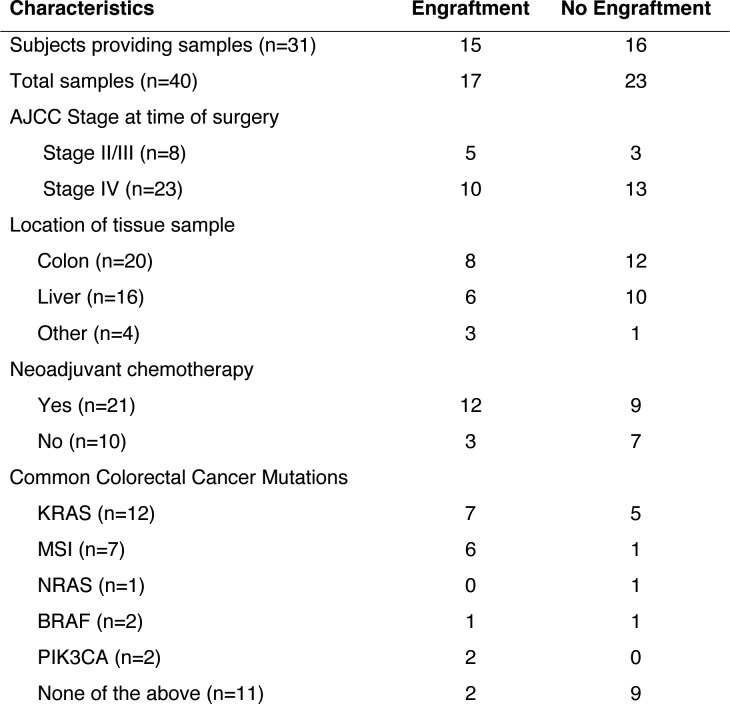
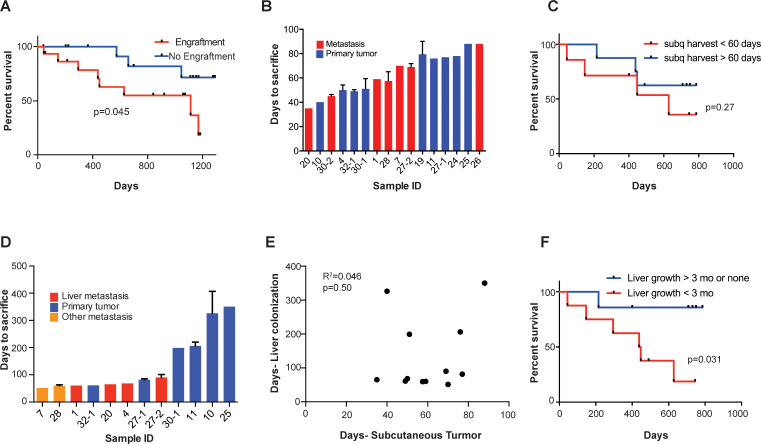
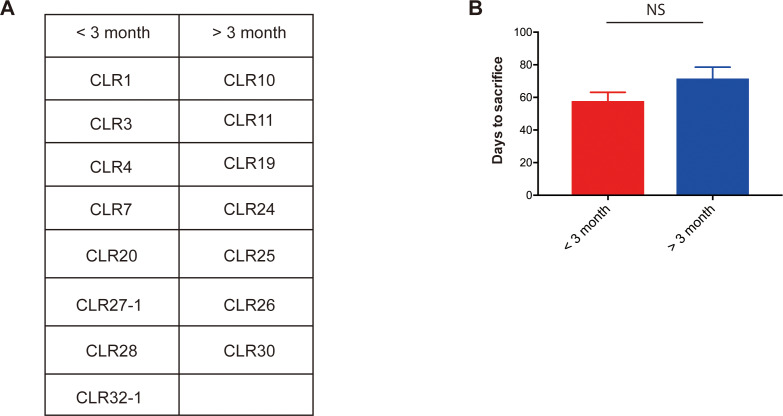
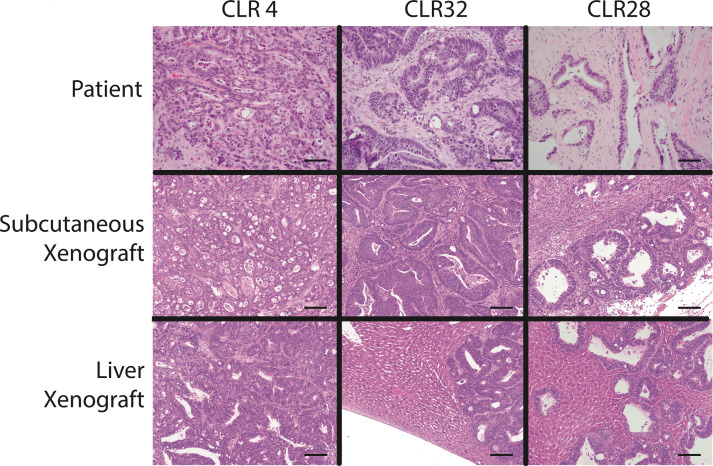
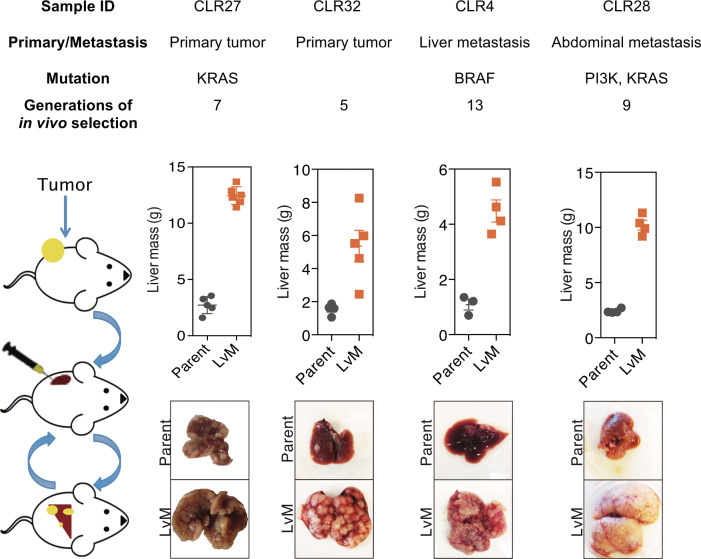
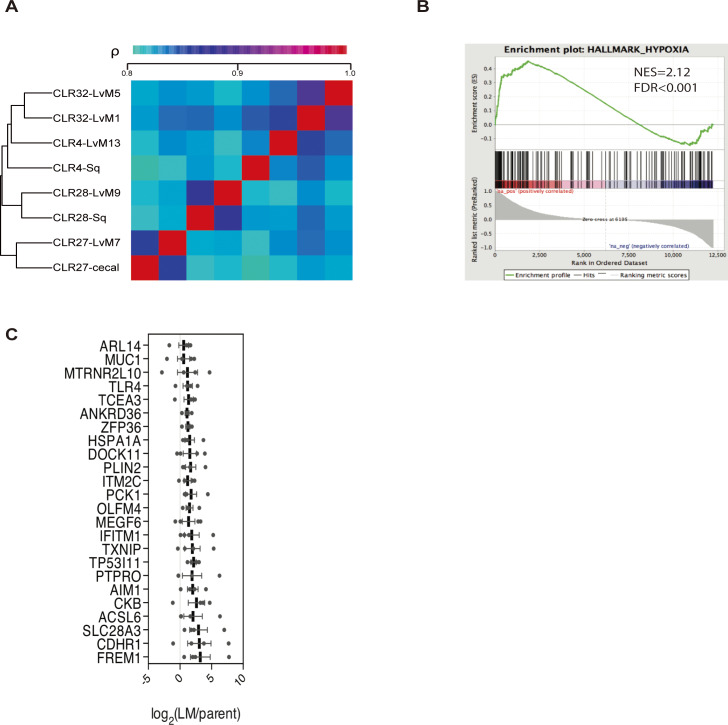
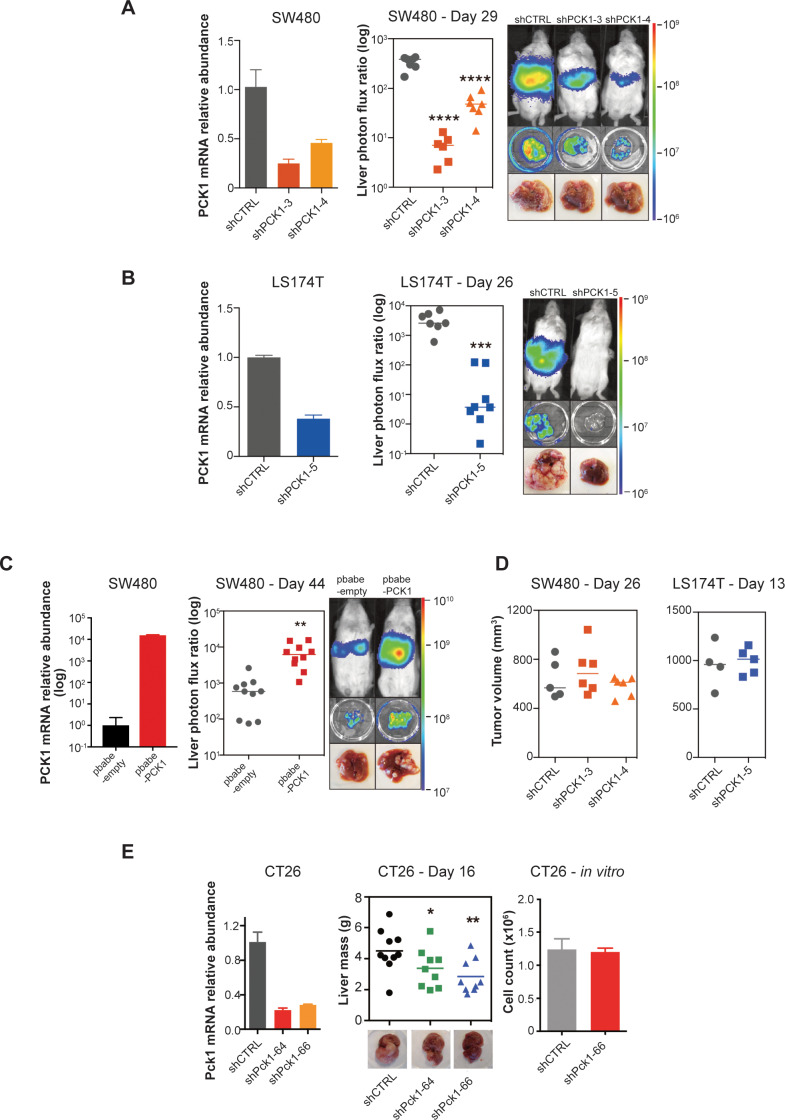
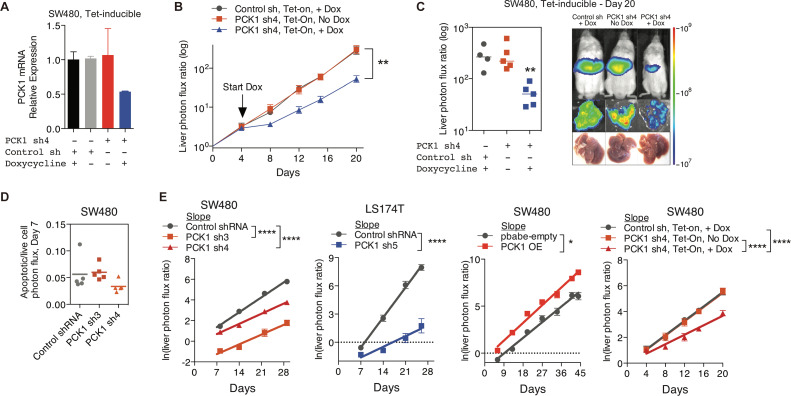
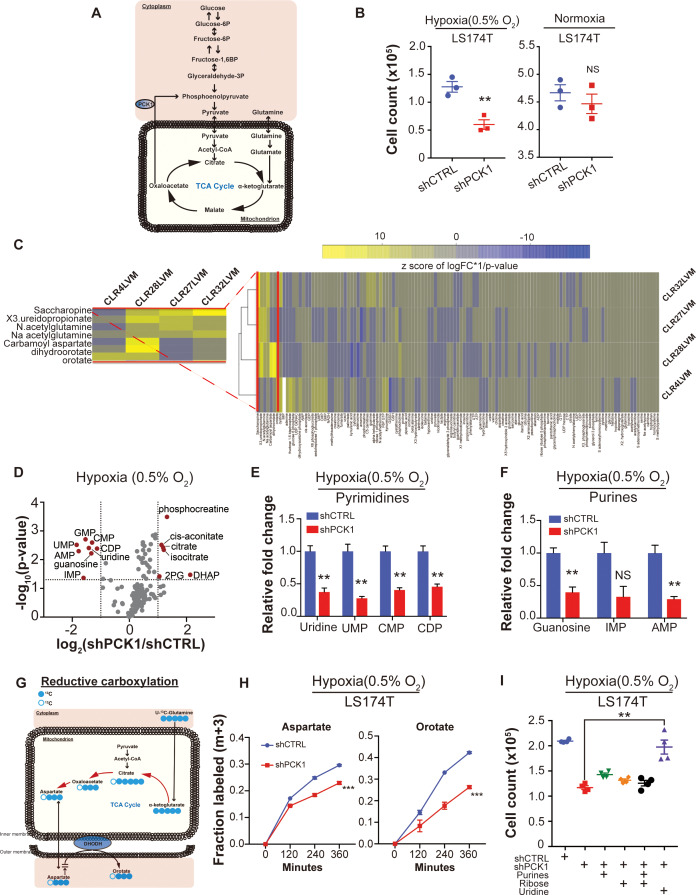
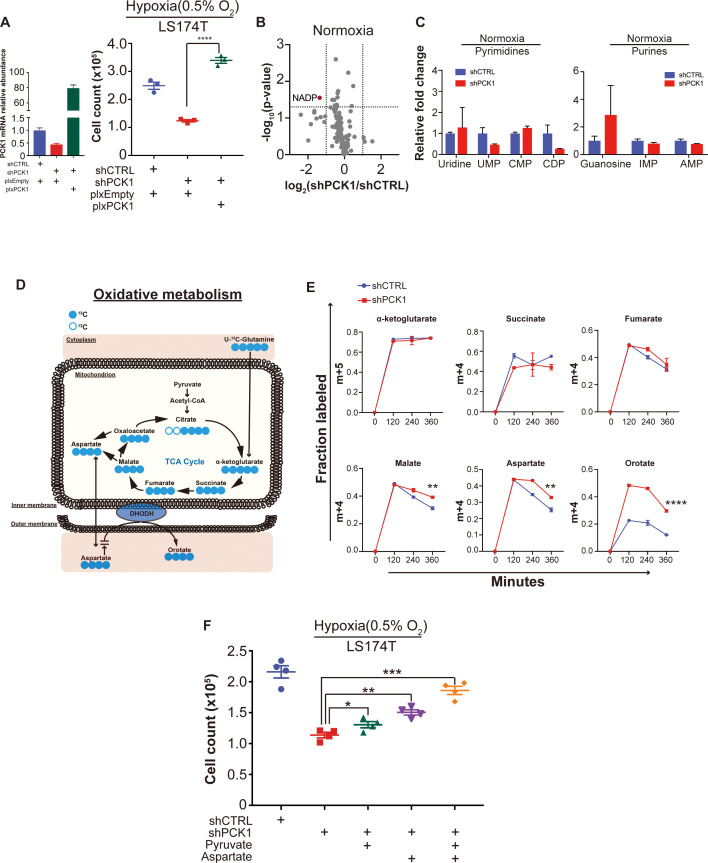
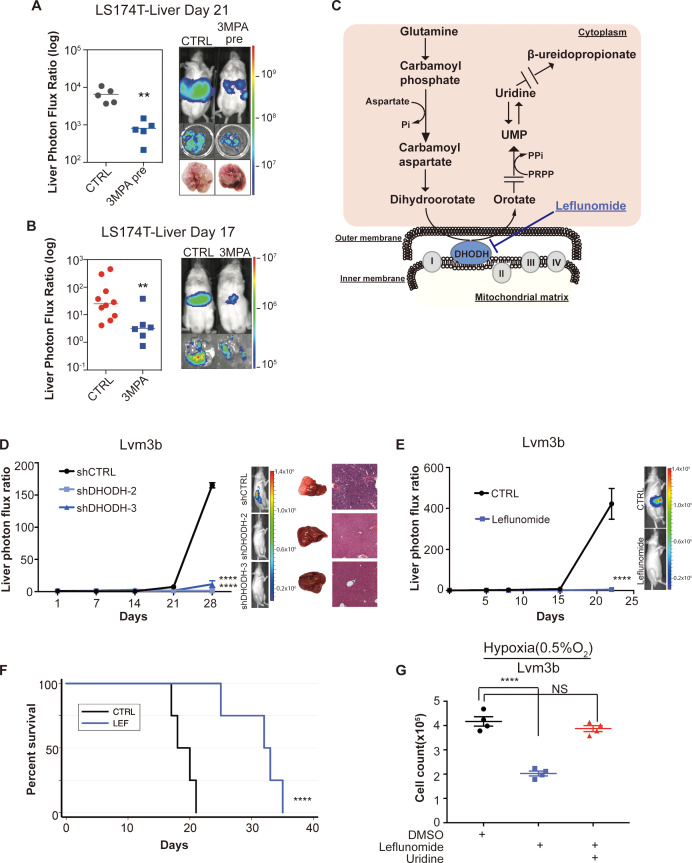
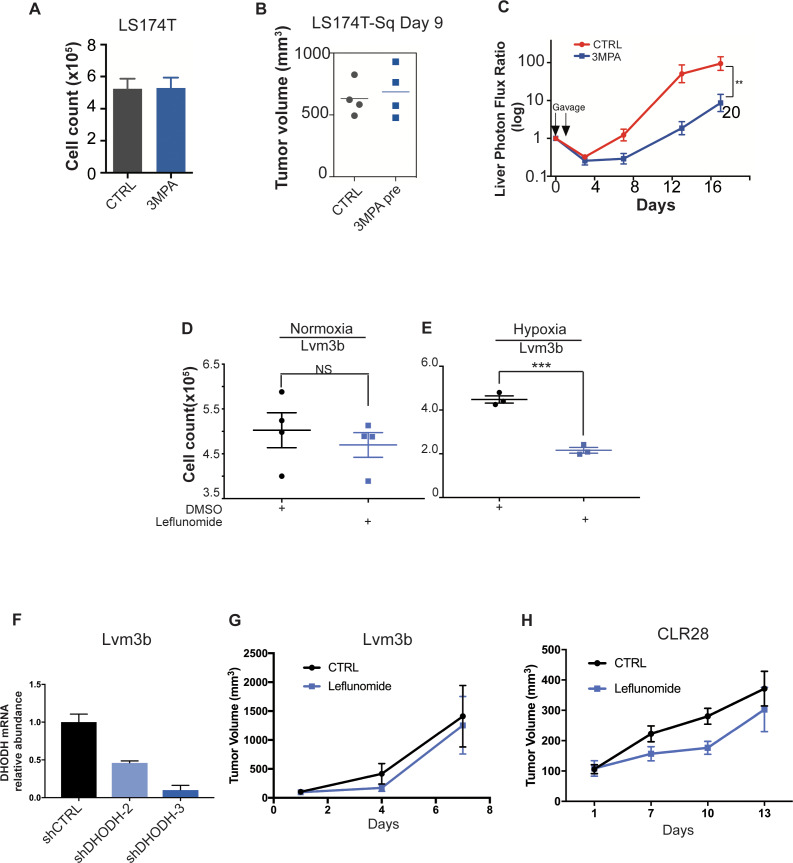
Colorectal cancer (CRC) is a major cause of human death. Mortality is primarily due to metastatic organ colonization, with the liver being the main organ affected. We modeled metastatic CRC (mCRC) liver colonization using patient-derived primary and metastatic tumor xenografts (PDX). Such PDX modeling predicted patient survival outcomes. In vivo selection of multiple PDXs for enhanced metastatic colonization capacity upregulated the gluconeogenic enzyme PCK1, which enhanced liver metastatic growth by driving pyrimidine nucleotide biosynthesis under hypoxia. Consistently, highly metastatic tumors upregulated multiple pyrimidine biosynthesis intermediary metabolites. Therapeutic inhibition of the pyrimidine biosynthetic enzyme DHODH with leflunomide substantially impaired CRC liver metastatic colonization and hypoxic growth. Our findings provide a potential mechanistic basis for the epidemiologic association of anti-gluconeogenic drugs with improved CRC metastasis outcomes, reveal the exploitation of a gluconeogenesis enzyme for pyrimidine biosynthesis under hypoxia, and implicate DHODH and PCK1 as metabolic therapeutic targets in CRC metastatic progression.

Keywords: cancer biology; cancer metabolism; cancer metastasis; human; human biology; medicine; mouse.


Conflict of interest statement

NY, EW, AN, ML, HG, YJ, PP, LS, TK, JL, Ed, ST No competing interests declared

Figures

Figure 1.
Figure 1.. Clinical characteristics of the subjects who provided the samples that created CRC patient-derived xenografts.
Figure 2.
Figure 2.. Subcutaneous engraftment and liver colonization growth rate, but not subcutaneous growth rate, correlate with patient outcomes in CRC PDXs.
(A) Approximately 50 mm3 of surgically resected colorectal cancer tissue was dissociated and injected subcutaneously into NSG mice. The mice were monitored for the presence of a subcutaneous tumor (engraftment) for 1 year. The Kaplan-Meier curve demonstrates patient survival based on subcutaneous engraftment of their corresponding CRC patient-derived xenograft (p=0.045, log-rank test). (B–C) Subcutaneous growth of CRC PDXs to the point requiring euthanasia of the host mice varied from 35 to 88 days and did not correlate with patient survival (p=0.27, log-rank test). (D–E) Subcutaneous tumor growth and liver colonization growth were not correlated (R2 = 0.046, p=0.50, Pearson correlation). (F) Liver colonization growth of CRC PDXs varied from 51 to 407 days and correlated with patient survival (p=0.031, log-rank test).
Figure 2—figure supplement 1.
Figure 2—figure supplement 1.. Metastatic CRC liver PDXs fell into two biologically distinct groups.
(A) mCRC PDXs were categorized into either a group requiring euthanasia within 3 months after splenic injection or longer than 3 months. (B) Liver growth rate of those mCRC PDXs did not associate with subcutaneous growth rate (p=0.09, Mann-Whitney test).
Figure 2—figure supplement 2.
Figure 2—figure supplement 2.. Histology of colorectal cancer patient-derived xenografts resembled the original tumor in both subcutaneous and liver graft sites.
Patient and xenograft samples were stained with H and E. Photomicrographs were taken at 10x magnification. Scale bar represents 100 μm.
Figure 3.
Figure 3.. In vivo selection generates derivatives with enhanced ability to colonize mouse livers.
In vivo selection was performed on four different CRC PDX samples derived from various anatomical locations and mutational backgrounds. The illustration on the left depicts the process used to generate the liver metastatic derivatives. Tumor samples from surgical specimens were inoculated subcutaneously into NSG mice. When the tumor reached the threshold size, it was removed from the mouse, dissociated into a single-cell suspension, and injected into the spleens of another set of mice as a means of introducing the colorectal cancer cells into the portal circulation. When the mice were deemed ill, the liver tumors were removed, dissociated, and re-injected to establish a next-generation liver derivative. This was repeated numerous times (Range: 5–13) with each PDX sample to obtain a distant liver metastatic CRC PDX derivative requiring euthanasia of mice in ~3 weeks after injection of cancer cells. Each of the CRC PDX liver derivatives grew significantly faster in the livers compared to their parent populations.
Figure 3—figure supplement 1.
Figure 3—figure supplement 1.. In vivo-selected xenograft tumors more closely resembled their parental counterparts transcriptomically and led to identification of candidate metastatic liver colonization genes.
(A) Phylogenetic heatmap of parental and liver-metastatic derived CRC PDXs using complete clustering and Euclidian distance function. (B) Hypoxia hallmark gene signature was upregulated in CRC liver metastatic derivatives compared to parental xenografts (NES = 2.12, FDR adjusted p value (q-value) <0.001). (C) Twenty-four genes met significance (q < 0.05) as candidate CRC liver metastasis promoter genes; these genes were significantly upregulated across the liver-metastatic derivatives compared to their parental counterparts.
Figure 4.
Figure 4.. Candidate metastatic liver colonization genes identified by comparing in vivo selected liver metastatic PDXs to their parental counterparts.
(A) Among 24 significantly upregulated genes, the 10 most highly upregulated genes (>1.5 logFC) are annotated. (B) The expression levels of candidate liver metastatic promoting genes were upregulated in patient liver metastases compared to primary tumors (GSE41258) (hypergeometric p=0.007). (C) Up-regulation of candidate liver metastasis promoting genes was significantly correlated with upregulation in patient liver metastases. Notably, PCK1 was more upregulated in liver metastases of patients than in the mouse model (rho = 0.37, p=0.047, Pearson correlation tested with Student’s t-test). (D) PCK1 expression in CRC PDXs as measured by qRT-PCR. CLR32-parental (n = 3), CLR32-liver metastatic derivative, CLR27-parental, CLR27-liver metastatic derivative (n = 2), CLR28-parental, CLR28-liver metastatic derivative, CLR4-parental, and CLR4-liver metastatic derivative (n = 4). (E) PCK1 is upregulated in CRC liver metastases compared to CRC primary tumors of another large publicly available dataset (GSE 50760) (p=0.01, Student’s t-test). (F–G) PCK1 was significantly upregulated in paired liver metastases compared to primary tumors within the same patient; this was observed in two independent datasets (GSE14297 and GSE6988) (p=0.01 in GSE14297; p<0.0001 in GSE6988, Wilcoxon matched paired signed rank test for the comparison).
Figure 5.
Figure 5.. PCK1 modulates colorectal cancer liver colonization.
PCK1 expression was measured by qRT-PCR in (A) PCK1 knockdown SW480 cells (n = 3). (B) PCK1 knockdown LS174T cells (n = 3) (C) PCK1 overexpressing SW480 cells (n = 3), and (E) PCK1 knockdown CT26 cells (n = 3). (A) Liver metastases in mice injected intrasplenically with 3.5 × 10⁵ SW480 cells expressing a control hairpin (n = 7) or 3.5 × 10⁵ SW480 cells expressing two independent PCK1 shRNAs (n = 6 for each shRNA hairpin) (p<0.0001 for shCTRL vs shPCK1-3 and shCTRL vs shPCK1-4, Student’s t-test, Bonferroni adjusted). (B) Liver metastases in mice injected intrasplenically with 5 × 10⁵ LS174T cells expressing a control hairpin (n = 7) or 5 × 10⁵ LS174T cells expressing an shPCK1 (n = 8) (p<0.0001, Student’s t-test). (C) Liver metastases in mice injected intrasplenically with 5 × 10⁴ SW480 cells expressing pbabe-empty control (n = 10) or 5 × 10⁴ SW480 cells overexpressing PCK1 (n = 10) (p=0.003, Student’s t-test). (D) Subcutaneous tumors injected with 1 × 10⁶ SW480 cells expressing a control hairpin (n = 5) or two independent shPCK1 hairpins (n = 6 for each shRNA hairpin) (p=0.53 for shCTRL vs shPCK1-3, p=0.45 for shCTRL vs shPCK1-4, Student’s t-test); subcutaneous tumors injected bilaterally with 1 × 10⁶ LS174T cells expressing a control hairpin (n = 4) or an shPCK1 (n = 5) (p=ns for comparison). (E) Liver mass of Balb-c mice injected intraspenically with 5 × 10⁵ CT26 cells expressing either a control hairpin (n = 10) or two independent shPCK1 hairpins (n = 9 for each hairpin) (p=0.039 for shCTRL vs shPCK1-64; p=0.005 for shCTRL vs shPCK1-66, Student’s t-test). In vitro growth is not affected by PCK1 knockdown in CT26 cells (n = 4) (p=0.589, Student’s t-test). 5 × 10⁴ cells were seeded in triplicate on day 0 and counted on day 3.
Figure 5—figure supplement 1.
Figure 5—figure supplement 1.. PCK1 modulation of colorectal cancer cells continuously alters population growth in the liver.
(A) PCK1 expression was measured by qRT-PCR in SW480 cells transduced with an inducible control shRNA or inducible PCK1 shRNA (n = 2). Cells were exposed to 1 µg/ml doxycycline or control media for 48 hr. (B and C) 5 × 10⁵ SW480 cells transduced with either an inducible control shRNA (n = 4) or inducible PCK1 shRNA (n = 10) were injected intrasplenically on day 0. On day 4, doxycycline (n = 4 for inducible control shRNA; n = 5 for inducible PCK1 shRNA) or a control diet (n = 5 for inducible PCK1 shRNA) were initiated (p=0.004 for inducible PCK1 shRNA with doxycycline vs inducible control shRNA with doxycycline and inducible PCK1 shRNA with control diet on day 20, Student’s t-test). (D) Apoptotic rate was not increased in PCK1-depleted colorectal cancer cells in the liver. Apoptotic rate was measured in vivo on day 7 post-injection of SW480 cells using Vivoglo caspase 3/7 substrate (p=0.222 for shCTRL vs shPCK1-3, p=0.190 for shCTRL vs shPCK1-4, Mann-Whitney test, Bonferroni adjusted). (E) The in vivo growth rate of colorectal cancer cells in the liver, as calculated through the natural log of the liver photon flux ratio, was altered upon PCK1 modulation (p<0.0001, p<0.0001, p<0.0001, p=0.03, p<0.0001, and p<0.0001 for SW480 shCTRL vs shPCK1-3, vs shPCK1-4, LS174T shCTRL vs shPCK1-5, SW480 pbabe-empty vs PCK1 OE, SW480 shCTRL vs shPCK1-4 Dox+, vs shPCK1-4 Dox-, respectively, Analysis of covariance(ANCOVA).
Figure 6.
Figure 6.. Metabolomics analysis reveals PCK1-dependent pyrimidine nucleotide synthesis under hypoxia in CRC.
(A) Schematic of PCK1 related metabolic pathway. (B) Hypoxia and normoxia cell viability assay of LS174T cells. 2 × 10⁵ LS174T cells expressing either control hairpin or shPCK1 hairpin were cultured under normoxia for 24 hr and then were moved to hypoxic chamber (0.5% O2) for 5 days or remained under normoxia for 5 days. PCK1 depleted cells had a significantly lower cell count under hypoxia (p=0.006, Student’s t-test). No difference under normoxia was observed (p=0.43, Student’s t-test). (C) Unsupervised hierarchical clustering of 170 polar metabolites’ profiling data. Parental PDXs were used as references to the corresponding highly metastatic PDXs. (D) Volcano plot showing the metabolite profile of LS174T cells expressing shCTRL or shPCK1 under hypoxia. Log2 fold change versus -log10 (p-value) was plotted. Dotted lines along x-axis represent ±log(National Cancer Institute, 2019) fold change and dotted lines along y-axis represent -log10(0.05). All metabolites either significantly enriched or depleted in shPCK1 cells compared to shCTRL are denoted as red points. All other metabolites detected are represented as gray points. (E) Pyrimidine metabolite levels in LS174T shCTRL versus shPCK1 cells under hypoxia. (q = 0.004, 0.003, 0.003, and 0.004 in Uridine, UMP, CMP, and CDP respectively, Student’s t-test, FDR adjusted at Q value of 0.01). (F) Purine metabolite levels in LS174T shCTRL versus shPCK1 cells under hypoxia (q = 0.003, 0.014, and 0.003 in Guanosine, IMP, and AMP respectively, Student’s t-test, FDR adjusted at Q value of 0.01). (G) Schematic of U-13C-glutamine stable isotope labeling of metabolites undergoing reductive carboxylation. (H) m+three fraction labeled orotate and aspartate in shCTRL or shPCK1 LS174T cells from 0 to 6 hr of U-13C-glutamine labeling under 0.5% O2. m+three fraction labeled aspartate and orotate were significantly reduced in shPCK1 cells (p=0.0004 and p<0.0001 respectively, Student’s t-test). (I) Hypoxia cell viability assay in 6 mM Glucose + purines, ribose, or uridine rescue. 2 × 10⁵ LS174T cells expressing either control hairpin or shPCK1 hairpin were cultured under normoxia for 24 hr and then were moved to hypoxic chamber (0.5% O2) for 5 days. Upon the exposure to hypoxia, purines (inosine and adenosine, both at 100 uM), ribose (20 mM) and uridine (100 uM) were added to the corresponding cells. (p=0.002, 0.06, 0.47, and 0.001 in shPCK1 vs shPCK1 plus purines, ribose, ribose and purines, and uridine respectively, Student’s t-test, Bonferroni adjusted). All data are represented as mean ± SEM from n = 3 biological replicates.
Figure 6—figure supplement 1.
Figure 6—figure supplement 1.. Metabolomic analysis reveals PCK1-dependent pyrimidine synthesis under hypoxia in CRC.
(A) PCK1 expression was measured by qRT-PCR in control shRNA or PCK1 shRNA expressing LS174T cells transduced with empty expression vector or PCK1 expressing vector. Hypoxia cell viability assay with 2 × 10⁵ control shRNA or PCK1 shRNA expressing LS174T cells expressing either empty vector or PCK1 expression vector were cultured under normoxia for 24 hr and then were moved to hypoxic chamber (0.5% O2) for 5 days. PCK1-depleted cells that were generated to re-express PCK1 (rescued expression) exhibited significantly more cell growth than PCK1 depleted cells (p<0.0001, Student’s t-test) (B) Volcano plot showing the metabolite profile of LS174T cells expressing shCTRL or shPCK1 under normoxia. Log2 fold change versus -log10 (p-value) was plotted. Dotted lines along x-axis represent ±log(National Cancer Institute, 2019) fold change and dotted lines along y-axis represent -log10 (0.05). All metabolites either significantly enriched or depleted in shPCK1 cells compared to shCTRL are denoted as red points. All other metabolites detected are depicted as gray points. (C) Pyrimidine metabolite levels in LS174T shCTRL versus shPCK1 cells under normoxia (q = 0.79, 0.20, 0.20, and 0.20 in Uridine, UMP, CMP, and CDP, respectively, Student’s t-test, FDR adjusted at Q value of 0.01). Purine metabolite levels in LS174T shCTRL versus shPCK1 cells under normoxia (q = 0.44, 0.36, and 0.36 in Guanosine, IMP, and AMP respectively, Student’s t-test, FDR adjusted at Q value of 0.01). (D) Schematic of U-13C-glutamine stable isotope labeling of metabolites undergoing oxidative metabolism. (E) m+four or m+five fraction labeled metabolites in shCTRL or shPCK1 LS174T cells from 0 to 6 hr of U-13C-glutamine labeling under 0.5% O2. m+four malate, aspartate, and orotate were significantly increased in shPCK1 cells (p=0.003, 0.01,<0.0001 respectively, Student’s t-test, Bonferroni adjusted). (F) Hypoxia cell viability assay in 6 mM Glucose + pyruvate, or aspartate rescue. 2 × 10⁵ LS174T cells expressing either control hairpin or shPCK1 hairpin were cultured under normoxia for 24 hr and then were moved to hypoxic chamber (0.5% O2) for 5 days. Upon exposure to hypoxia, pyruvate(1 mM), aspartate(10 mM) or both pyruvate(1 mM) and aspartate(10 mM) were added to the corresponding cells (p=0.046, 0.002, and 0.0002 in shPCK1 vs shPCK1 plus pyruvate, aspartate, and both pyruvate and aspartate respectively, Student’s t-test, Bonferroni adjusted).
Figure 7.
Figure 7.. Genetic and pharmacologic inhibition of DHODH decreases in vivo CRC liver metastatic colonization.
(A) 3 MPA pre-treatment decreased liver colonization of LS174T CRC cells. 1 × 10⁶ control LS174T cells or 3 MPA pre-treated LS174T cells were injected intrasplenically (p=0.01, Student’s t-test). (B) Oral administration of 3 MPA decreased liver colonization of LS174T CRC cells. One hour prior to the intrasplenic injection of 1 × 10⁶ LS174T cells, mice were gavaged with either 3 MPA (200 mg/kg in aqueous solution; n = 6) or control (n = 10). Mice received a second dose on day 1. Four mice in the 3 MPA died prior to imaging on day 3 and were not included in the analysis. two independent experimental results were pooled. (p=0.008 for 3 MPA vs control, Student’s t-test). (C) Schematic of de novo pyrimidine synthesis pathway. (D) Genetic silencing of DHODH decreased liver colonization of mCRC cells. 1 × 10⁶ Lvm3b cells expressing a control hairpin or hairpins targeting DHODH were intrasplenically injected to athymic nude mice (n = 4 per each cohort) on day 1 and were imaged every week. Luciferase bioluminescent images and corresponding gross liver images and H and E stains are depicted (p<0.0001 in shDHODH-2 and p<0.0001 in shDHODH-3, Student’s t-test, Bonferroni adjusted). (E) Leflunomide inhibits liver metastatic colonization of Lvm3b cells. 1 × 10⁶ Lvm3b cells were intrasplenically injected into athymic nude mice (n = 4 per each cohort) on day 1 and leflunomide (7.5 mg/kg mouse body weight) or DMSO treatment was begun on day 1. The mice were imaged every week. Firefly luciferase bioluminescent images are shown (p<0.0001, Student’s t-test). (F) Kaplan-Meier plot of the experiment shown in B (n = 4 per each cohort) (p=0.007, log-rank test). (G) Uridine supplementation rescued leflunomide induced cell growth reduction under hypoxia. 2 × 10⁵ Lvm3b cells were cultured under normoxia for 24 hr and then were moved to hypoxic chamber (0.5% O2) for 5 days. Upon the exposure to hypoxia, leflunomide (100 uM) and uridine (100 uM) was added to the corresponding cells (p<0.001 for DMSO vs leflunomide; p=0.25 for DMSO vs leflunomide/uridine, Student’s t-test).
Figure 7—figure supplement 1.
Figure 7—figure supplement 1.. DHODH inhibition suppressed metastatic liver colonization and hypoxic cell growth of CRC cells.
(A) Twenty-four-hour exposure to 1 mM 3 MPA in media did not alter LS174T cell growth in vitro (p=0.89, Student’s t-test) (n = 3). 2 × 10⁴ LS174T cells were seeded in triplicate. On day 1, the media was replaced with either control media or media supplemented with 1 mM 3 MPA. On day 2, all the media was replaced with control media. The experiment was terminated on day 5. (B) 3 MPA pre-treatment did not change subcutaneous tumor growth. Following 3 MPA treatment, 1 × 10⁶ control LS174T cells or 3 MPA pre-treated LS174T cells were injected subcutaneously into mice (p=0.87, Student’s t-test). (C) Time course liver photon flux ratio of control treated and 3 MPA treated mice (p=0.005 for control vs 3 MPA on day 17, Student’s t-test). (D) Cell viability assay using Lvm3b cells under normoxia. Leflunomide treatment did not significantly alter cell growth under normoxia (p=0.52, Student’s t-test). (E) Cell viability assay using Lvm3b cells under hypoxia (0.5% oxygen). Leflunomide treatment significantly reduced cell viability under hypoxia (p<0.001, Student’s t-test). (F) Relative abundance of DHODH transcripts measured through qRT-PCR. (G–H) Primary tumor growth assays of Lvm3b (G) and CLR28 (H). Daily intraperitoneal leflunomide treatment (7.5 mg/kg mouse body weight) was started on day 1 of tumor injections. Leflunomide treatment did not significantly change primary tumor growth of either Lvm3b (p=0.58) or CLR28 tumors (p=0.47, Student’s t-test).

References

    1. Bajzikova M, Kovarova J, Coelho AR, Boukalova S, Oh S, Rohlenova K, Svec D, Hubackova S, Endaya B, Judasova K, Bezawork-Geleta A, Kluckova K, Chatre L, Zobalova R, Novakova A, Vanova K, Ezrova Z, Maghzal GJ, Magalhaes Novais S, Olsinova M, Krobova L, An YJ, Davidova E, Nahacka Z, Sobol M, Cunha-Oliveira T, Sandoval-Acuña C, Strnad H, Zhang T, Huynh T, Serafim TL, Hozak P, Sardao VA, Koopman WJH, Ricchetti M, Oliveira PJ, Kolar F, Kubista M, Truksa J, Dvorakova-Hortova K, Pacak K, Gurlich R, Stocker R, Zhou Y, Berridge MV, Park S, Dong L, Rohlena J, Neuzil J. Reactivation of dihydroorotate Dehydrogenase-Driven pyrimidine biosynthesis restores tumor growth of Respiration-Deficient Cancer cells. Cell Metabolism. 2019;29:399–416. doi: 10.1016/j.cmet.2018.10.014. - DOI - PMC - PubMed
    1. Birsoy K, Wang T, Chen WW, Freinkman E, Abu-Remaileh M, Sabatini DM. An essential role of the mitochondrial electron transport chain in cell proliferation is to enable aspartate synthesis. Cell. 2015;162:540–551. doi: 10.1016/j.cell.2015.07.016. - DOI - PMC - PubMed
    1. Boroughs LK, DeBerardinis RJ. Metabolic pathways promoting Cancer cell survival and growth. Nature Cell Biology. 2015;17:351–359. doi: 10.1038/ncb3124. - DOI - PMC - PubMed
    1. Bracht K, Nicholls AM, Liu Y, Bodmer WF. 5-Fluorouracil response in a large panel of colorectal Cancer cell lines is associated with mismatch repair deficiency. British Journal of Cancer. 2010;103:340–346. doi: 10.1038/sj.bjc.6605780. - DOI - PMC - PubMed
    1. Chandel NS. Navigating Metabolism. Cold Spring Harbor, New York: Cold Spring Harbor Laboratory Press; 2015.

Publication types

MeSH terms

Substances

Associated data