. 2019 Dec 16;14(12):e0220422.
doi: 10.1371/journal.pone.0220422. eCollection 2019.

Multiple cyanotoxin congeners produced by sub-dominant cyanobacterial taxa in riverine cyanobacterial and algal mats

Affiliations

Multiple cyanotoxin congeners produced by sub-dominant cyanobacterial taxa in riverine cyanobacterial and algal mats

Laura T Kelly et al. PLoS One. .

Abstract

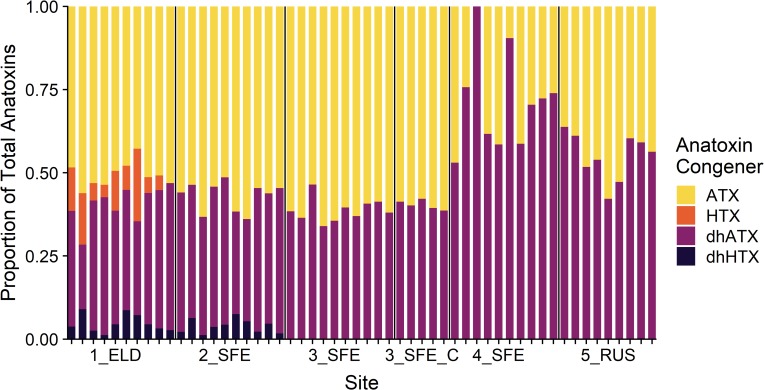
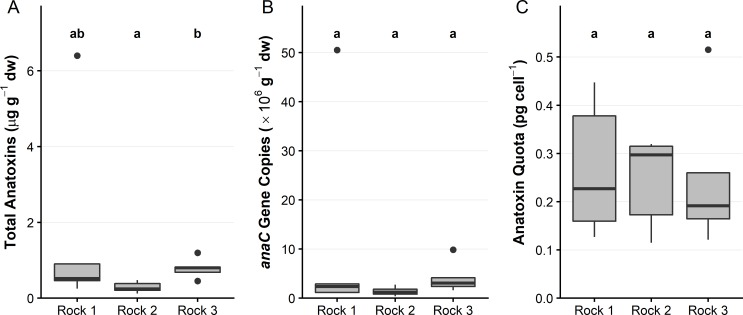
Benthic cyanobacterial proliferations in rivers are have been reported with increasing frequency worldwide. In the Eel and Russian rivers of California, more than a dozen dog deaths have been attributed to cyanotoxin toxicosis since 2000. Periphyton proliferations in these rivers comprise multiple cyanobacterial taxa capable of cyanotoxin production, hence there is uncertainty regarding which taxa are producing toxins. In this study, periphyton samples dominated by the cyanobacterial genera Anabaena spp. and Microcoleus spp. and the green alga Cladophora glomerata were collected from four sites in the Eel River catchment and one site in the Russian River. Samples were analysed for potential cyanotoxin producers using polymerase chain reaction (PCR) in concert with Sanger sequencing. Cyanotoxin concentrations were measured using liquid chromatography tandem-mass spectrometry, and anatoxin quota (the amount of cyanobacterial anatoxins per toxigenic cell) determined using droplet digital PCR. Sequencing indicated Microcoleus sp. and Nodularia sp. were the putative producers of cyanobacterial anatoxins and nodularins, respectively, regardless of the dominant taxa in the mat. Anatoxin concentrations in the mat samples varied from 0.1 to 18.6 μg g-1 and were significantly different among sites (p < 0.01, Wilcoxon test); however, anatoxin quotas were less variable (< 5-fold). Dihydroanatoxin-a was generally the most abundant variant in samples comprising 38% to 71% of the total anatoxins measured. Mats dominated by the green alga C. glomerata contained both anatoxins and nodularin-R at concentrations similar to those of cyanobacteria-dominated mats. This highlights that even when cyanobacteria are not the dominant taxa in periphyton, these mats may still pose a serious health risk and indicates that more widespread monitoring of all mats in a river are necessary.


Conflict of interest statement

The authors have declared that no competing interests exist.

Figures

Fig 1
Fig 1. Map of sampling sites on the South Fork Eel River and on the Russian River in California, USA.
Blue areas on the map refer to the Eel River watershed, while green denotes the Russian River watershed. Sites are labelled in order of increasing drainage area from 1 to 5, while the suffix refers to the river: ELD = Elder Creek, SFE = South Fork Eel, RUS = Russian River.
Fig 2
Fig 2. Anatoxin and microcystin/nodularin concentrations vary by site.
(A) Summed anatoxin (the total of the four congeners; anatoxin-a, homoanatoxin-a, dihydroanatoxin-a and dihydrohomoanatoxin-a); and (B) summed microcystins and nodularin-R from 10 replicate attached periphyton samples (n = 5 for Cladophora-dominated samples; 3_SFE_C). collected from each of four sites on the Eel River on 29 July 2018 and 9 attached periphyton samples from one site on the Russian River on 31 July 2018. Colours represent the dominant taxa in mats collected from each site. dw = dry weight. Note log scale on the y-axes. Lines within the boxes are medians, the ends of boxes are quartiles and whiskers extend to the lowest or highest data point ≤ 1.5 × the interquartile range. Black dots are outliers. A Kruskal-Wallis test and pairwise Wilcoxon rank sum test with a Benjamini-Hochberg adjustment was used to identify sites that were significantly different from one another (p <0.05), denoted by the letter above the plot. Dotted lines represent the analytical limit of quantitation and bold dashed lines the analytical limit of detection.
Fig 3
Fig 3. The composition of anatoxin congeners from attached periphyton samples collected at the five sites.
Each vertical bar represents one periphyton sample and the vertical black lines delineate each site. 3_SFE_C represents Cladophora-dominated samples at site 3_SFE. ATX = anatoxin-a, HTX = homoanatoxin-a, dhATX = dihydroanatoxin-a, dhHTX = dihydrohomoanatoxin-a.
Fig 4
Fig 4. Anatoxin concentrations, anaC gene copies and anatoxin quota among three sites on the Eel and Russian rivers.
(A) Summed anatoxin concentrations; (B) anaC gene copies; and (C) anatoxin quota, from five attached periphyton samples collected from two sites on the Eel River and one site on the Russian River. dw = dried weight. Note the different y-axis scales. See Fig 2 for interpretation of boxplots. A Kruskal-Wallis test and pairwise Wilcoxon rank sum test with a Benjamini-Hochberg adjustment was used to identify sites that were significantly different from one another (p <0.05), denoted by the letter above the plot.
Fig 5
Fig 5. Anatoxin concentrations, anaC gene copies and anatoxin quota among fine-scale samples from three rocks at 4_SFE on the Eel river.
(A) Summed anatoxin concentrations; (B) anaC gene copy concentrations; and (C) anatoxin quota from five mat samples collected from each of three rocks at 4_SFE. dw = dried weight. Note the different y-axis scales. See Fig 2 for interpretation of boxplots. A Kruskal-Wallis test and pairwise Wilcoxon rank sum test with a Benjamini-Hochberg adjustment was used to identify rocks that were significantly different from one another (p <0.05), denoted by the letter above the plot.

References

    1. Edwards C, Beattie KA, Scrimgeour CM, Codd GA. Identification of anatoxin-a in benthic cyanobacteria (blue-green algae) and in associated dog poisonings at Loch Insh, Scotland. Toxicon. 1992;30(10): 1165–75. 10.1016/0041-0101(92)90432-5 - DOI - PubMed
    1. Mez K, Beattie KA, Codd GA, Hanselmann K, Hauser B, Naegeli H, et al. Identification of a microcystin in benthic cyanobacteria linked to cattle deaths on alpine pastures in Switzerland. Eur J Phycol. 1997;32(2): 111–7.
    1. Hamill KD. Toxicity in benthic freshwater cyanobacteria (blue‐green algae): First observations in New Zealand. New Zealand Journal of Marine and Freshwater Research. 2001;35(5).
    1. Hudon C, De Sève M, Cattaneo A. Increasing occurrence of the benthic filamentous cyanobacterium Lyngbya wollei: a symptom of freshwater ecosystem degradation. Freshwater Science. 2014;33(2): 606–18.
    1. Gaget V, Humpage AR, Huang Q, Monis P, Brookes JD. Benthic cyanobacteria: A source of cylindrospermopsin and microcystin in Australian drinking water reservoirs. Water Research. 2017;124: 454–64. 10.1016/j.watres.2017.07.073 - DOI - PubMed

Publication types