Multicenter Study
. 2020 Mar:208:116456.
doi: 10.1016/j.neuroimage.2019.116456. Epub 2019 Dec 10.

Evaluating the reliability of neurocognitive biomarkers of neurodegenerative diseases across countries: A machine learning approach

Affiliations
Multicenter Study

Evaluating the reliability of neurocognitive biomarkers of neurodegenerative diseases across countries: A machine learning approach

M Belen Bachli et al. Neuroimage. 2020 Mar.

Abstract

Accurate early diagnosis of neurodegenerative diseases represents a growing challenge for current clinical practice. Promisingly, current tools can be complemented by computational decision-support methods to objectively analyze multidimensional measures and increase diagnostic confidence. Yet, widespread application of these tools cannot be recommended unless they are proven to perform consistently and reproducibly across samples from different countries. We implemented machine-learning algorithms to evaluate the prediction power of neurocognitive biomarkers (behavioral and imaging measures) for classifying two neurodegenerative conditions -Alzheimer Disease (AD) and behavioral variant frontotemporal dementia (bvFTD)- across three different countries (>200 participants). We use machine-learning tools integrating multimodal measures such as cognitive scores (executive functions and cognitive screening) and brain atrophy volume (voxel based morphometry from fronto-temporo-insular regions in bvFTD, and temporo-parietal regions in AD) to identify the most relevant features in predicting the incidence of the diseases. In the Country-1 cohort, predictions of AD and bvFTD became maximally improved upon inclusion of cognitive screenings outcomes combined with atrophy levels. Multimodal training data from this cohort allowed predicting both AD and bvFTD in the other two novel datasets from other countries with high accuracy (>90%), demonstrating the robustness of the approach as well as the differential specificity and reliability of behavioral and neural markers for each condition. In sum, this is the first study, across centers and countries, to validate the predictive power of cognitive signatures combined with atrophy levels for contrastive neurodegenerative conditions, validating a benchmark for future assessments of reliability and reproducibility.

Keywords: Alzheimer’s disease; Classification; Executive functions; Frontotemporal dementia; Machine-learning; Voxel-based morphometry.


Conflict of interest statement

Declarations of competing interest None.

Figures

Fig. 1.
Fig. 1.
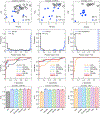
Standardize (grey box): data were standardized by converting them to z-scores, so that each feature in the control group had a zero mean and standard deviation of one. Data exploration (light orange boxes): these procedures were used only to explore and obtain knowledge about the behavior of the data. Clustering: we used a k-means algorithm with k = 2 to separate groups in two clusters to explore data distribution, and evaluate the presence of potential sub-groups of participants (details in section 2.4.1). Visualization and inspection: the hypothetically most informative features (cognitive screenings and atrophy) were inspected by graphing pairs of dimensions for the reference dataset (Country-1) (details in section 2.4). Principal component analysis (PCA): We used MATLAB’s default implementation of PCA to explore the most informative combination of features as measured by the explained variance of the data. Classification (light green boxes): Within-country classification: we implemented a logistic regression classifier with cognitive and brain atrophy features within the Country-1 dataset, given that it was the largest one with full completion of cognitive screenings. To evaluate the performance of this model, we used a leave-two-out cross-validation scheme. Cross-country classification: this was performed to further validate the generalization and prediction power of our findings. The logistic regression classifier was trained with Country-1 subjects and tested on participants from Country-2 or Country-3. Finally, to evaluate the relevance of each feature, after performing the classification with the whole feature set, the procedure was repeated but one-by-one each of the features was omitted in the classification (details in sections 2.4.2 and 2.4.3).
Fig. 2.
Fig. 2.. Atrophy measures and cognitive data distribution.
A. Real distribution of IFS and atrophy data. The degree of brain atrophy and the IFS score are standardized in z-scores. B. Real distribution of ACE and atrophy data. The degree of brain atrophy and the IFS score are standardized in z-scores. C. Clustering of IFS and atrophy results from panel A. Red-white circles represent patients wrongly identified as controls, and red diamonds represent controls who were mistaken with patients. D. Clustering of ACE and atrophy results from panel B. Red-white circles represent patients wrongly identified as controls, and red diamonds represent controls who were mistaken with patients.
Fig. 3.
Fig. 3.. Within-country classification.
The two top panels depict the histograms of the probability of belonging to the patient group, as revealed by logistic regression. The bottom panels correspond to ROC curves obtained for the groups’ data from the first row. Different curves show the ROC calculation omitting the feature denoted in the legend on a one-by-one basis.
Fig. 4.
Fig. 4.. Cross-country classification.
The three top panels depict the real data distribution in z-score values. The three middle panels show the histograms of the probability of belonging to the diseased group, as revealed by logistic regression. The graphs in the three bottom panels correspond to the ROC curves obtained for each condition, by considering all the features (“All”) or by omitting the single features indicated in the legends. The fourth row illustrate the effect of removing a single feature from classification. Removing IFS or ACE affects results the most, which indicates their high informativeness in distinguishing FTD and AD from controls.

References

    1. Abdulkadir A, Mortamet B, Vemuri P, et al., 2011. Effects of hardware heterogeneity on the performance of SVM Alzheimer’s disease classifier. Neuroimage 58 (3), 785–792. - PMC - PubMed
    1. Amieva H, Lafont S, Rouch-Leroyer I, et al., 2004. Evidencing inhibitory deficits in Alzheimer’s disease through interference effects and shifting disabilities in the Stroop test. Arch. Clin. Neuropsychol. : Off. J. Natl. Acad. Neuropsychologists 19 (6), 791–803. - PubMed
    1. Arbabshirani MR, Plis S, Sui J, Calhoun VD, 2017. Single subject prediction ofbrain disorders in neuroimaging: promises and pitfalls. Neuroimage 145 (Pt B), 137–165. - PMC - PubMed
    1. Baez S, Couto B, Torralva T, et al., 2014. Comparing moral judgments of patients with frontotemporal dementia and frontal stroke. JAMA neurology 71 (9), 1172–1176. - PubMed
    1. Baez S, Manes F, Huepe D, et al., 2014. Primary empathy deficits in frontotemporal dementia. Front. Aging Neurosci. 6, 262. - PMC - PubMed

Publication types