

Convolutional neural network enhancement of fast-scan low-dose cone-beam CT images for head and neck radiotherapy
- PMID: 31842014
- PMCID: PMC8011532
- DOI: 10.1088/1361-6560/ab6240
Convolutional neural network enhancement of fast-scan low-dose cone-beam CT images for head and neck radiotherapy
Abstract
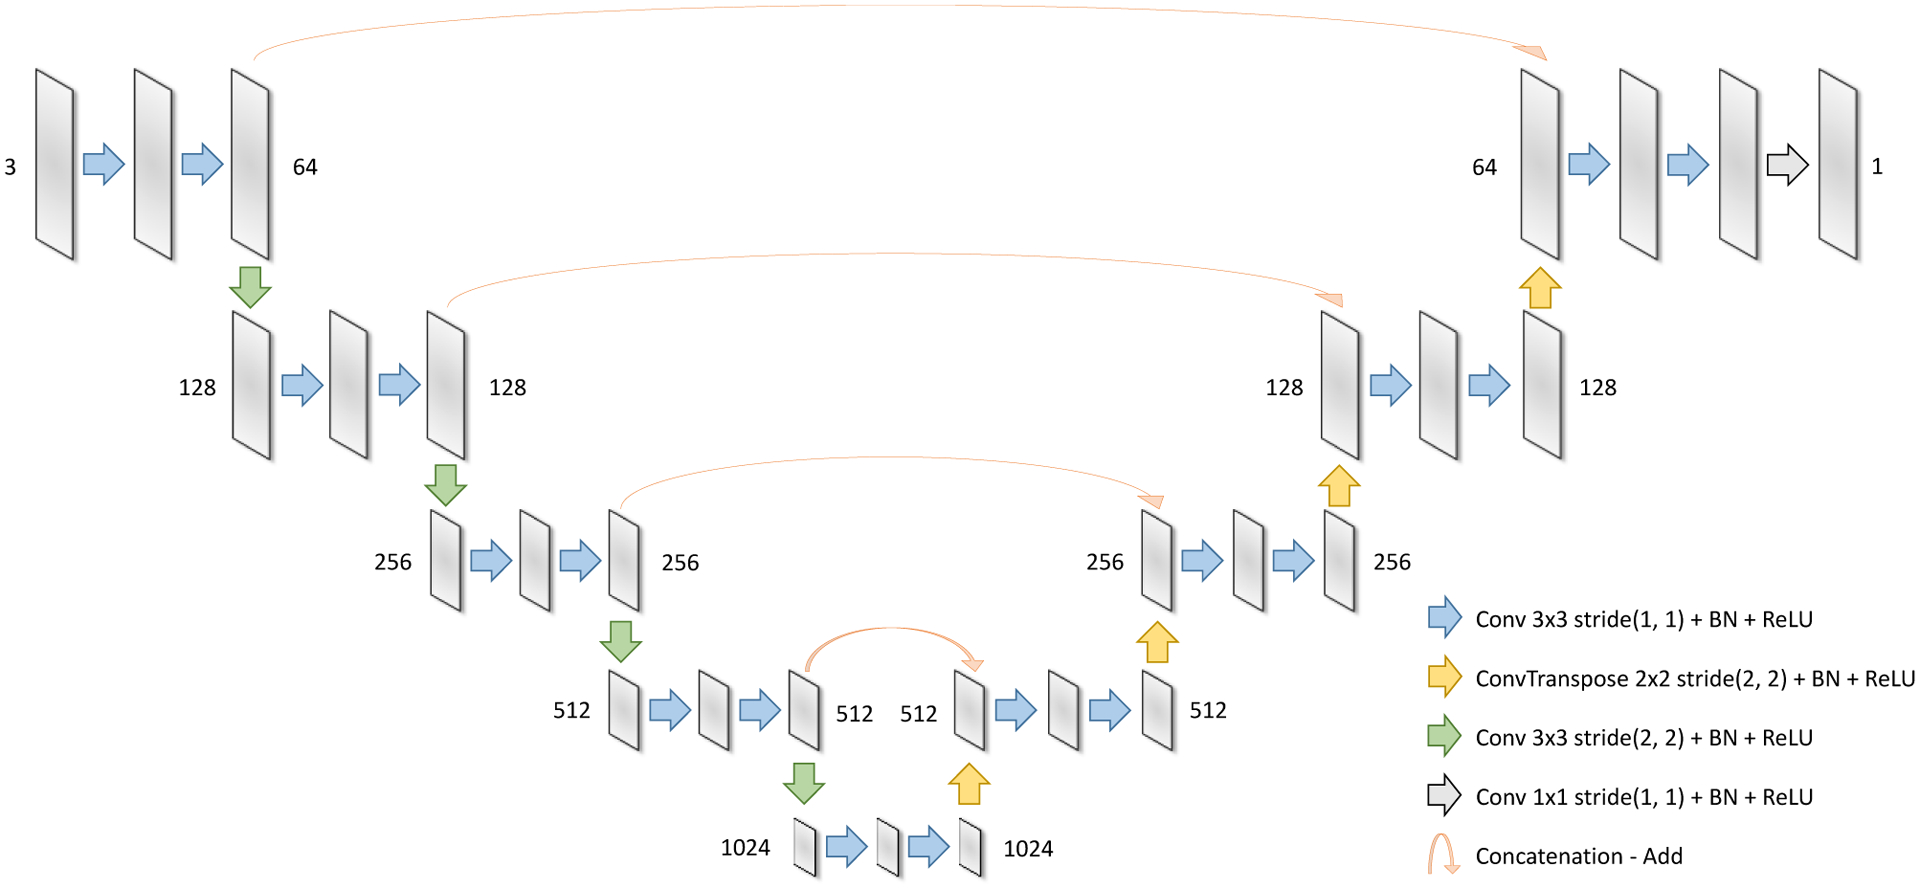
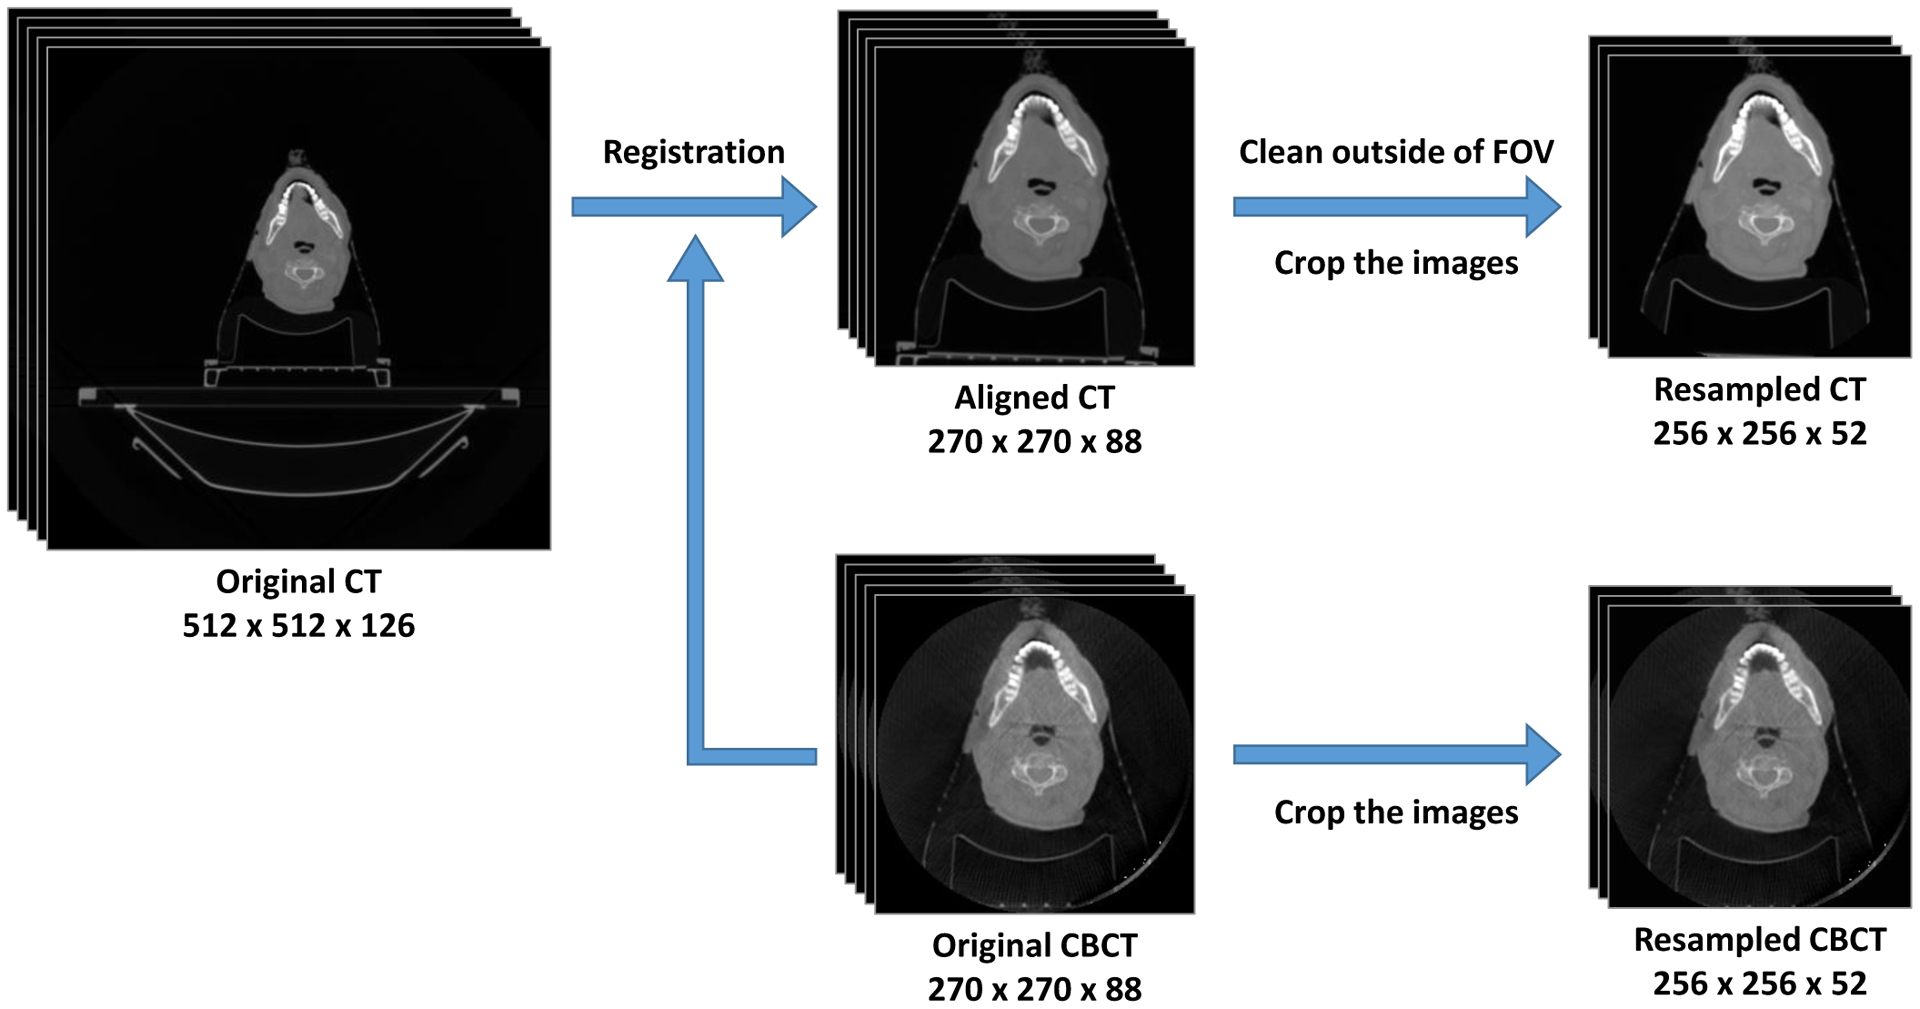
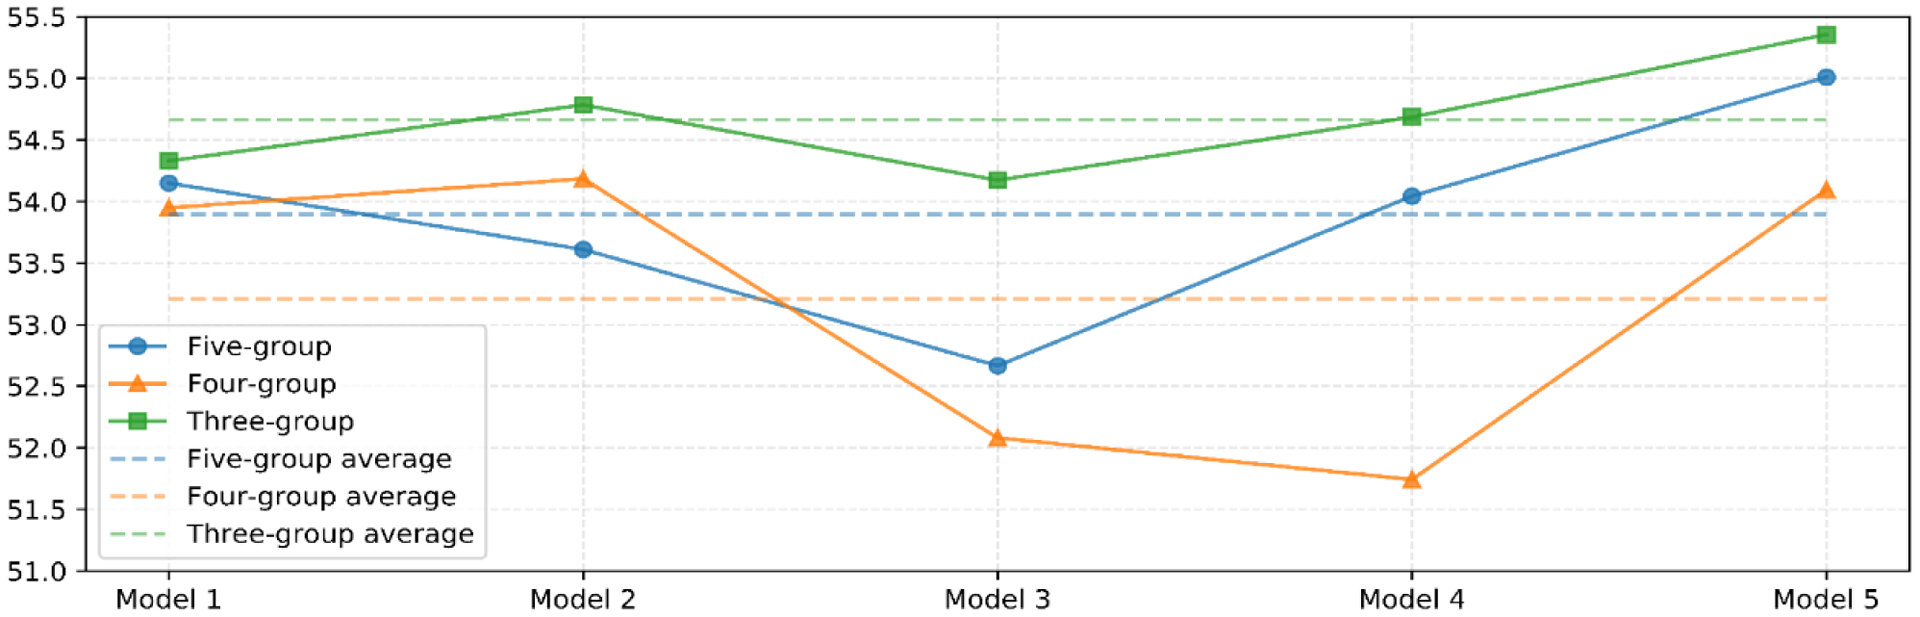
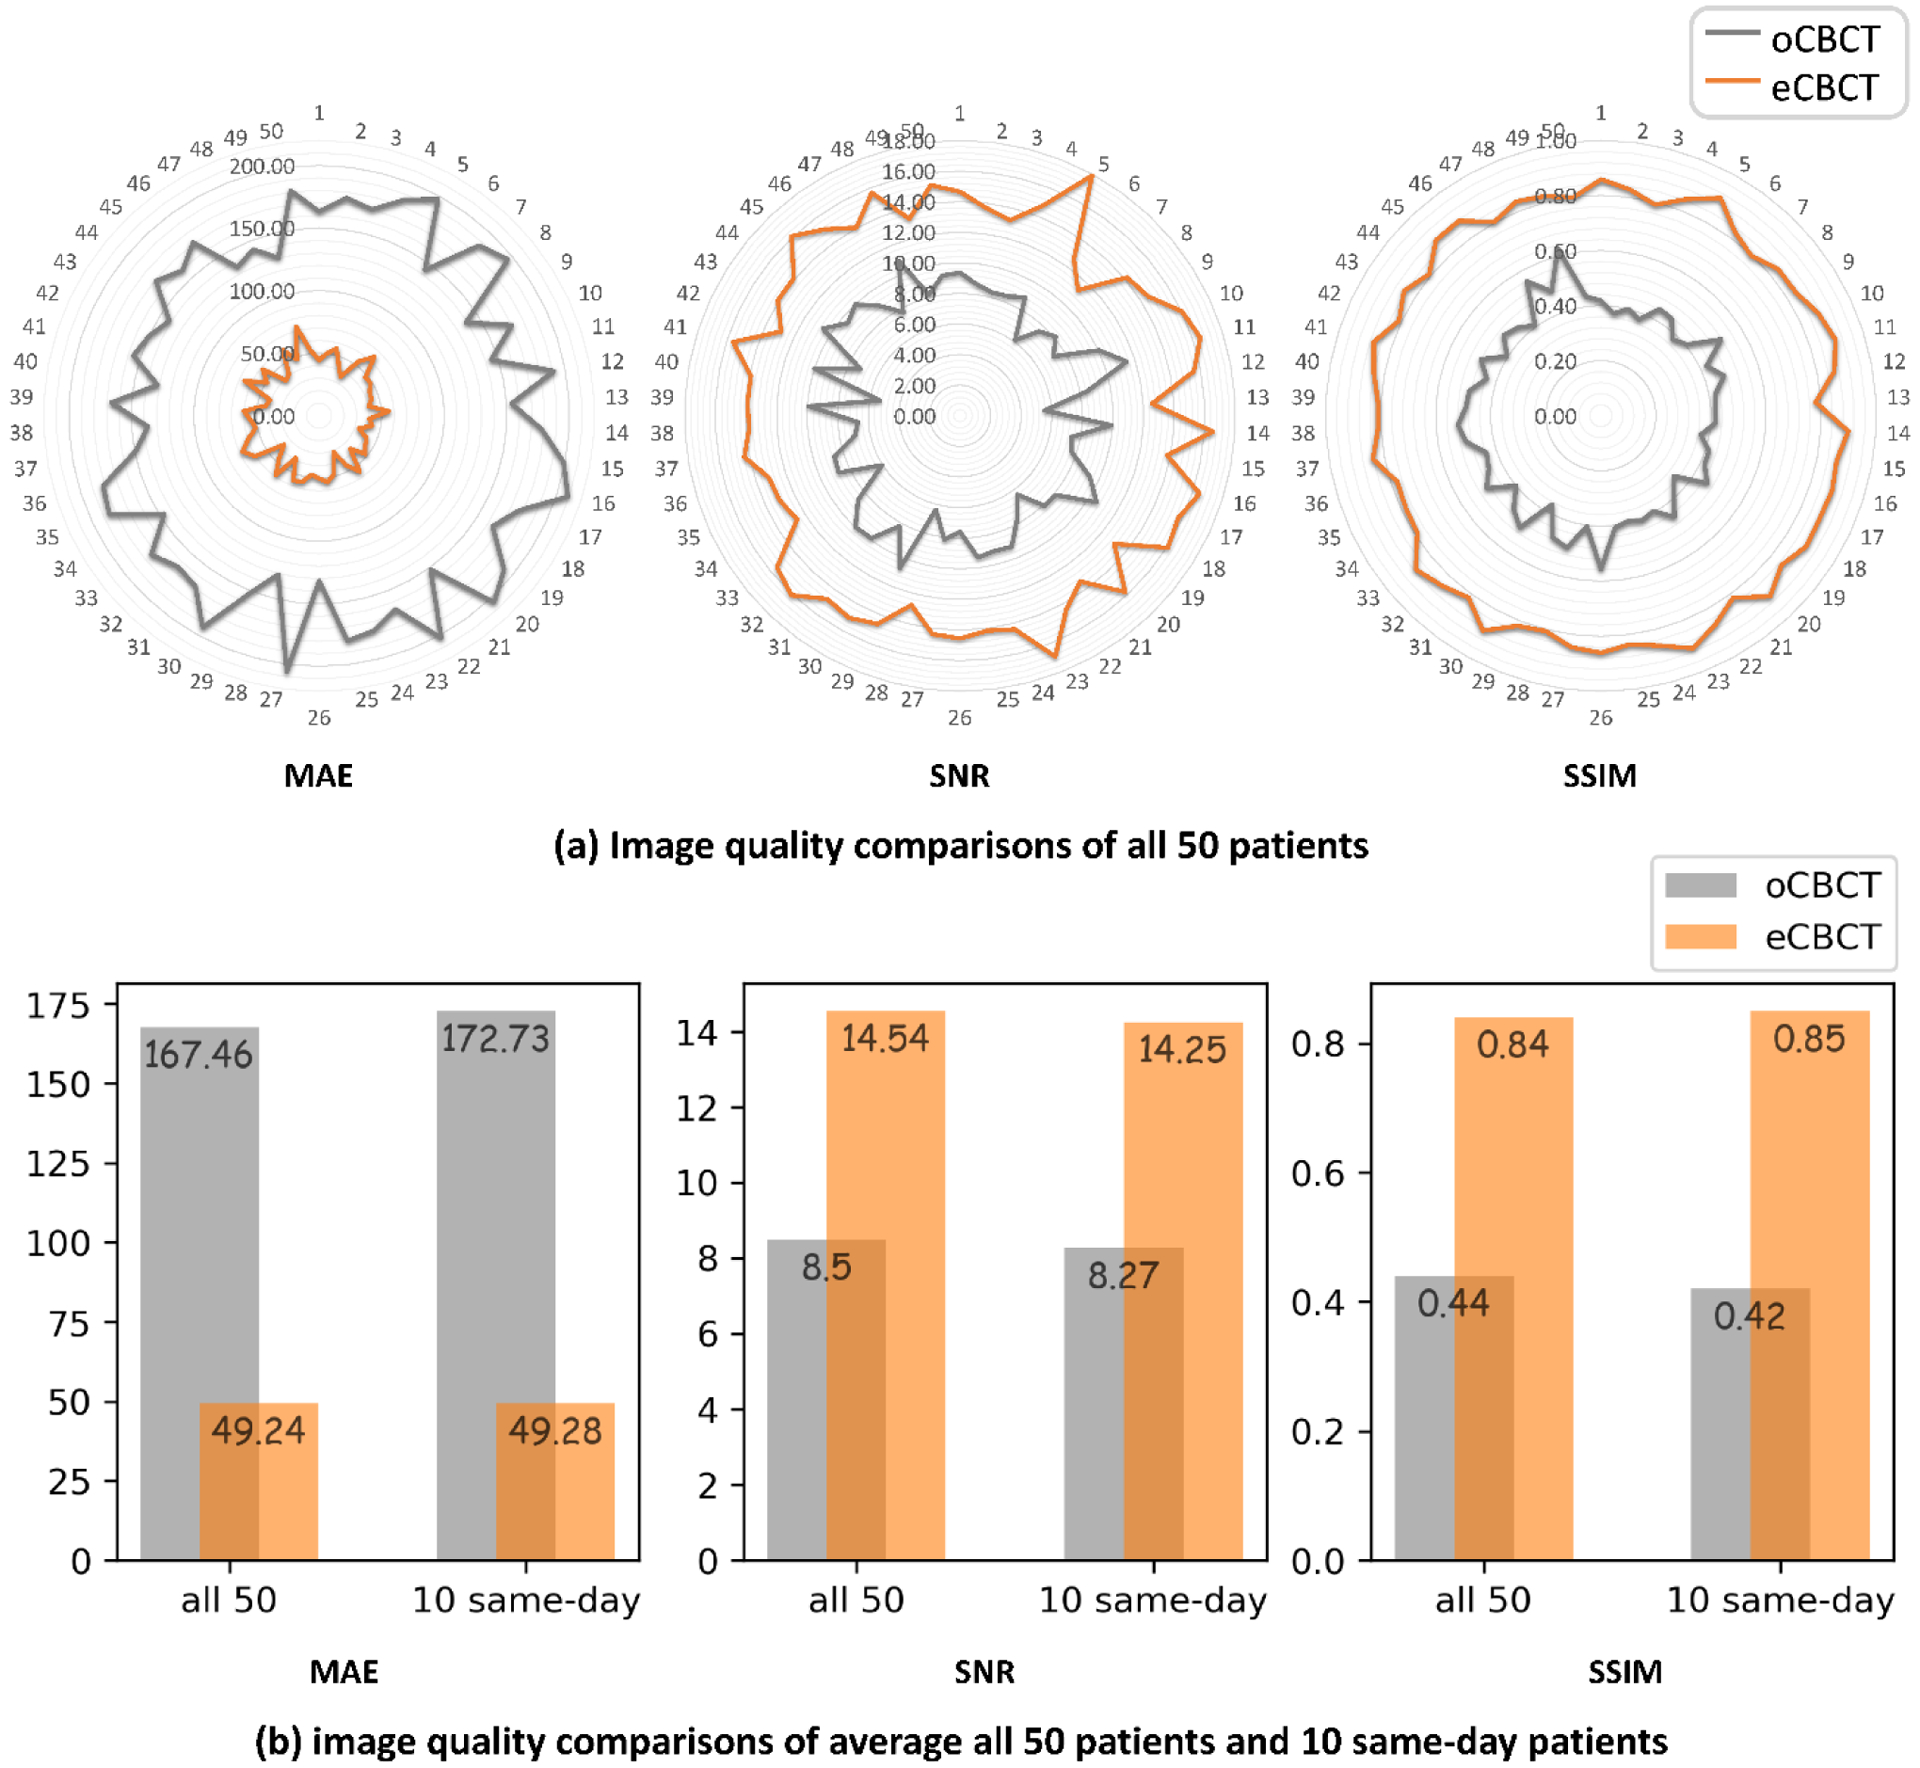
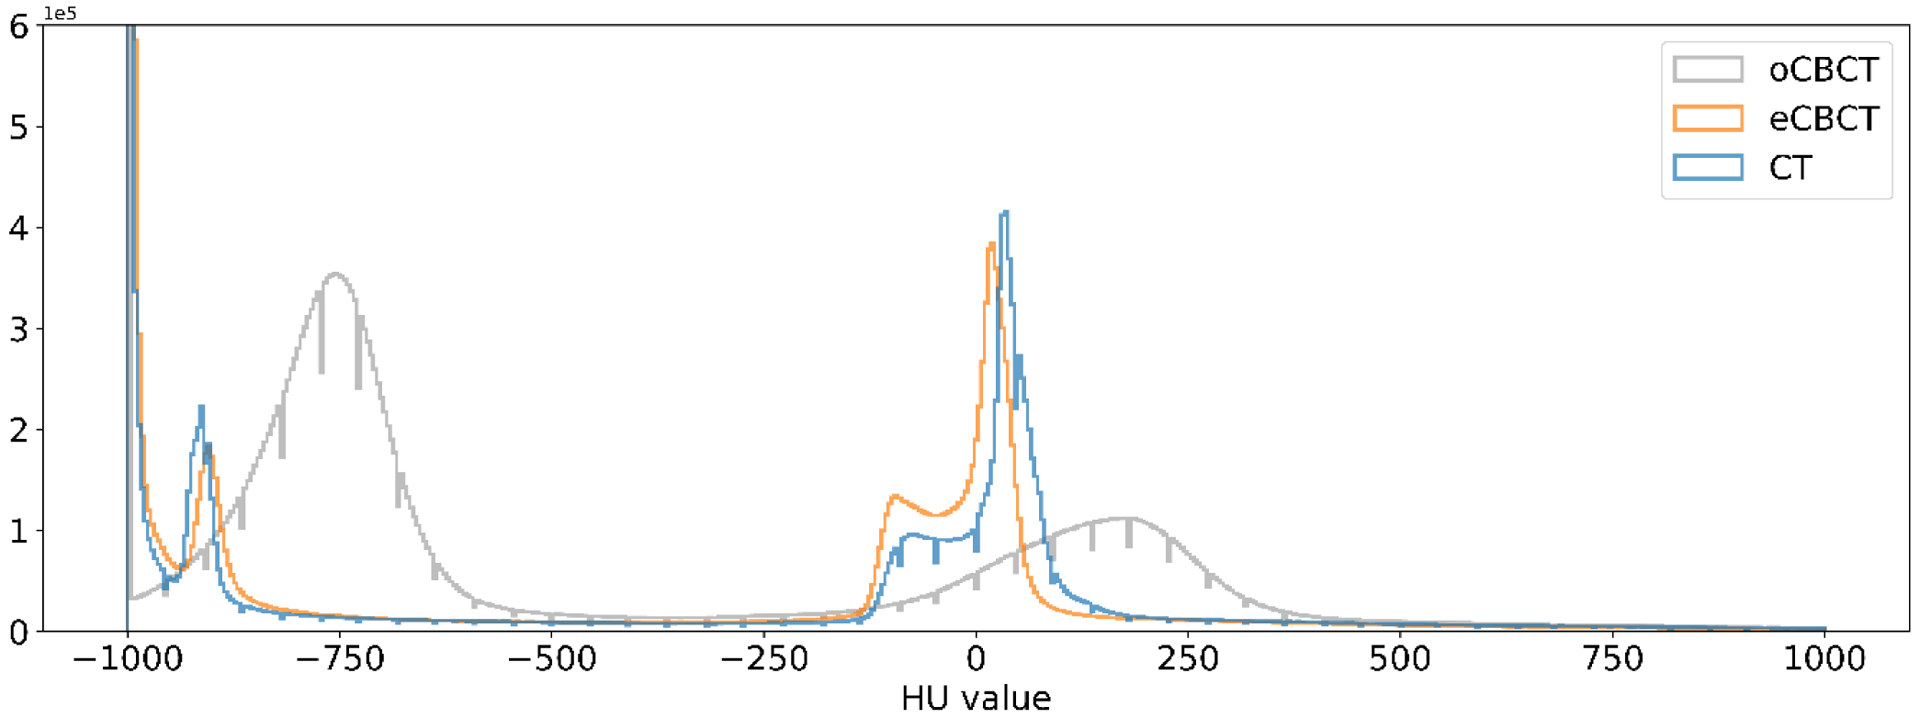
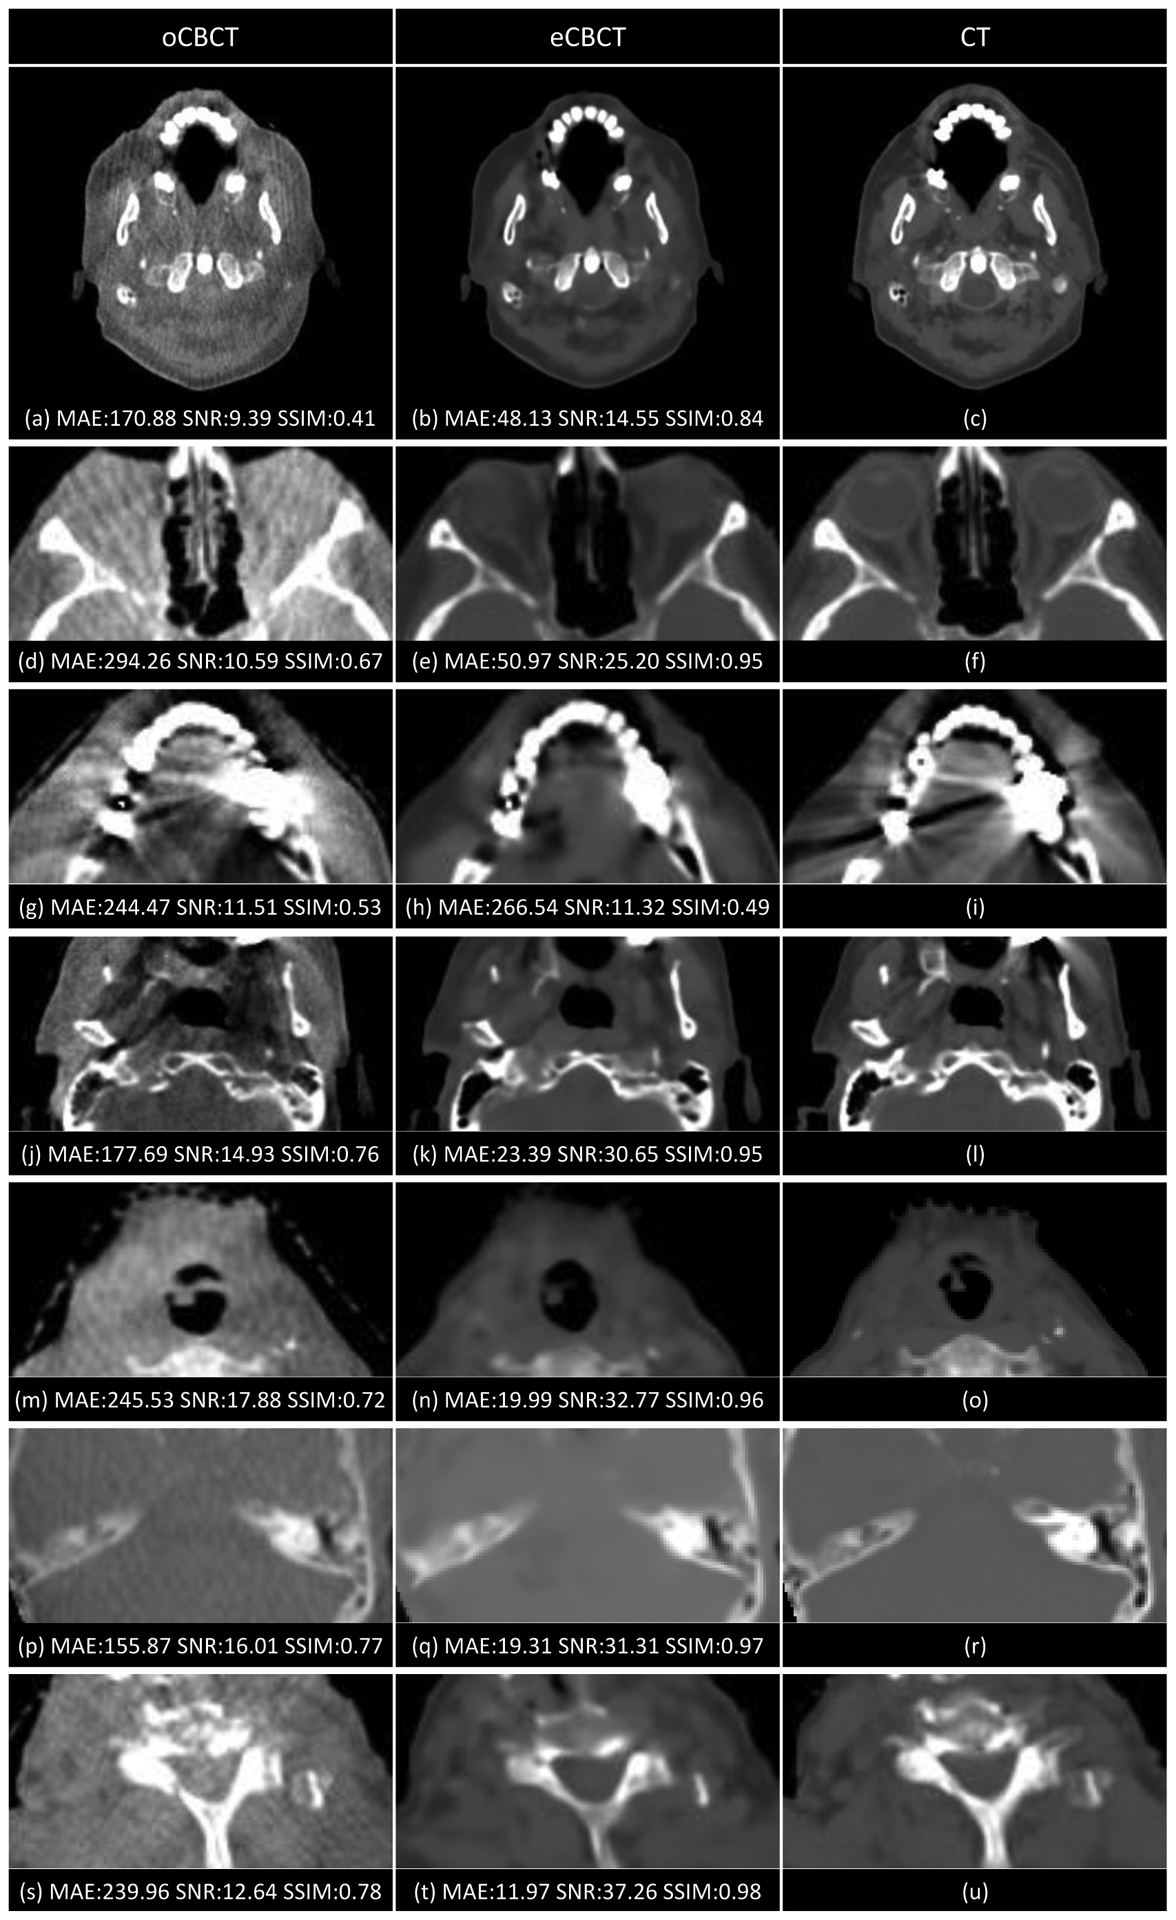
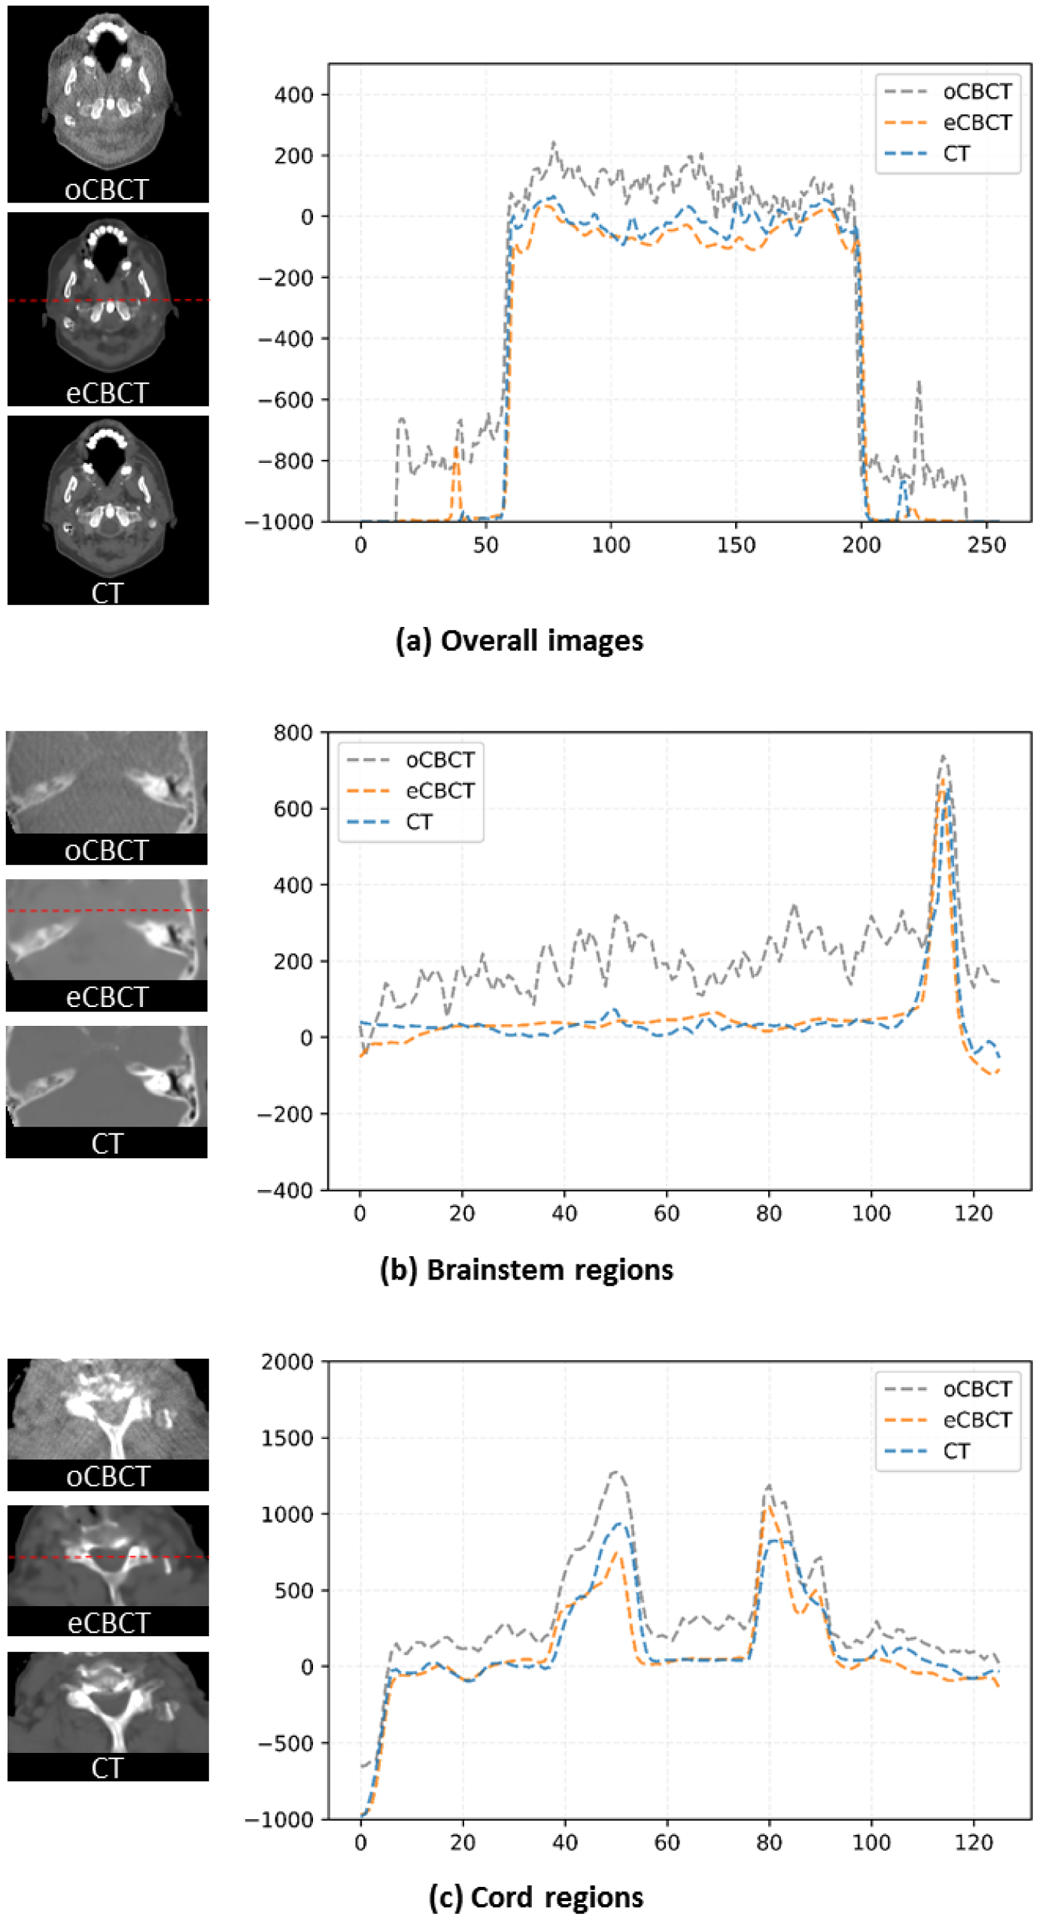
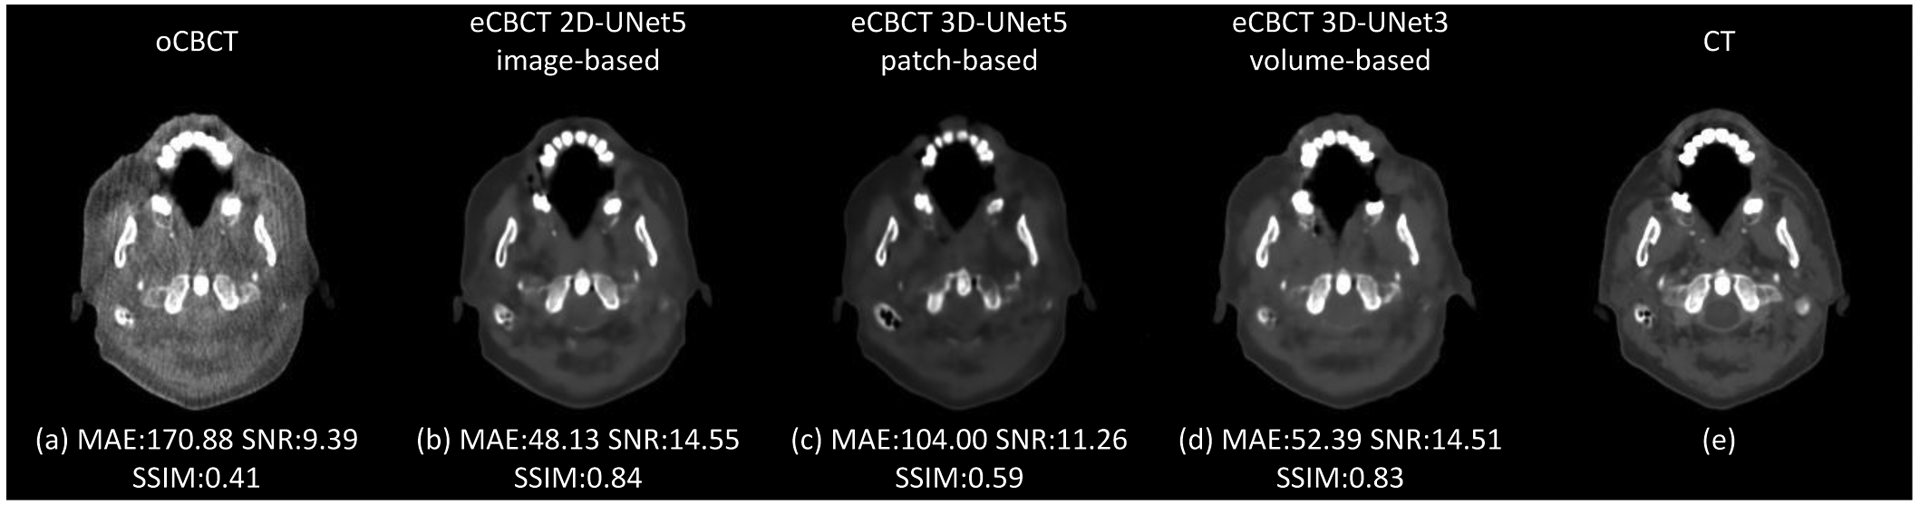
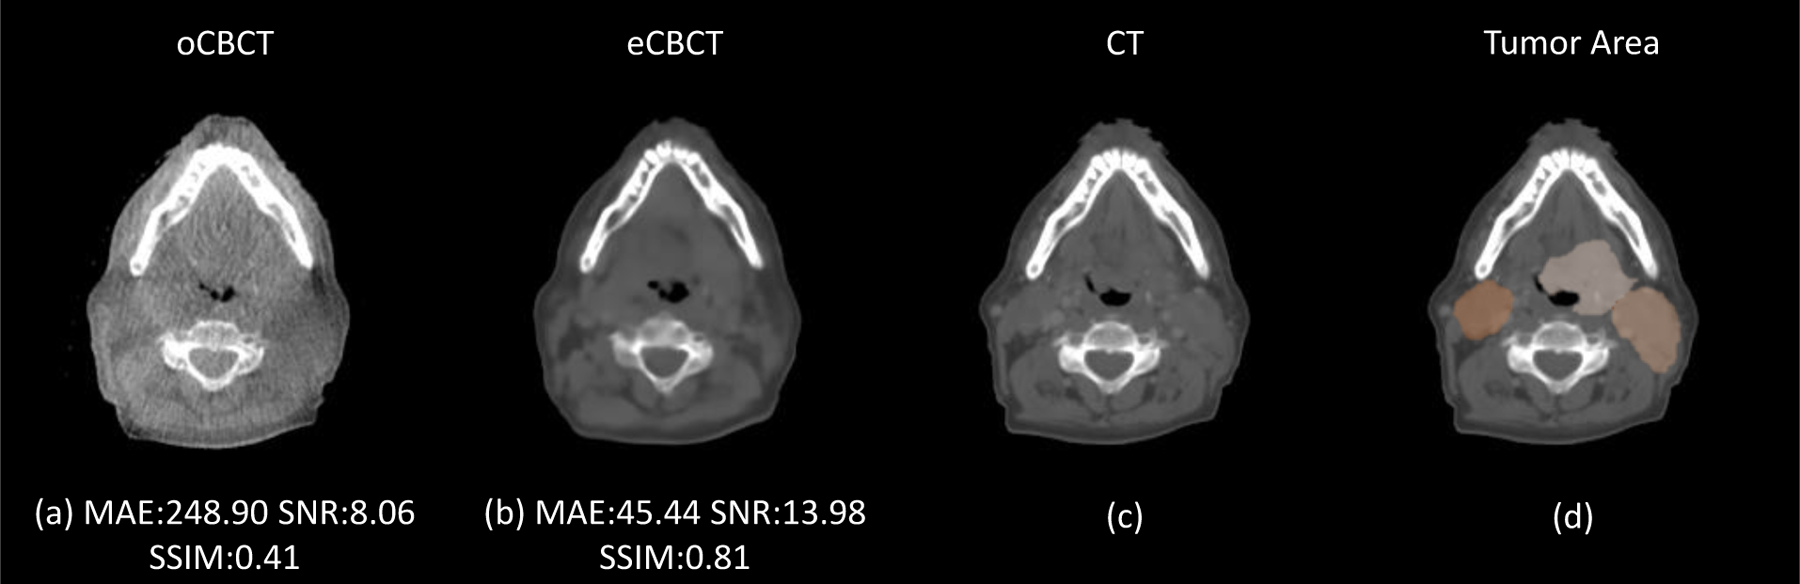
To improve image quality and CT number accuracy of fast-scan low-dose cone-beam computed tomography (CBCT) through a deep-learning convolutional neural network (CNN) methodology for head-and-neck (HN) radiotherapy. Fifty-five paired CBCT and CT images from HN patients were retrospectively analysed. Among them, 15 patients underwent adaptive replanning during treatment, thus had same-day CT/CBCT pairs. The remaining 40 patients (post-operative) had paired planning CT and 1st fraction CBCT images with minimal anatomic changes. A 2D U-Net architecture with 27-layers in 5 depths was built for the CNN. CNN training was performed using data from 40 post-operative HN patients with 2080 paired CT/CBCT slices. Validation and test datasets include 5 same-day datasets with 260 slice pairs and 10 same-day datasets with 520 slice pairs, respectively. To examine the impact of differences in training dataset selection and network performance as a function of training data size, additional networks were trained using 30, 40 and 50 datasets. Image quality of enhanced CBCT images were quantitatively compared against the CT image using mean absolute error (MAE) of Hounsfield units (HU), signal-to-noise ratio (SNR) and structural similarity (SSIM). Enhanced CBCT images reduced artifact distortion and improved soft tissue contrast. Networks trained with 40 datasets had imaging performance comparable to those trained with 50 datasets and outperformed those trained with 30 datasets. Comparison of CBCT and enhanced CBCT images demonstrated improvement in average MAE from 172.73 to 49.28 HU, SNR from 8.27 to 14.25 dB, and SSIM from 0.42 to 0.85. The image processing time is 2 s per patient using a NVIDIA GeForce GTX 1080 Ti GPU. The proposed deep-leaning methodology was fast and effective for image quality enhancement of fast-scan low-dose CBCT. This method has potential to support fast online-adaptive re-planning for HN cancer patients.
Figures
Similar articles
-
Head and neck synthetic CT generated from ultra-low-dose cone-beam CT following Image Gently Protocol using deep neural network.Med Phys. 2022 May;49(5):3263-3277. doi: 10.1002/mp.15585. Epub 2022 Mar 14. Med Phys. 2022. PMID: 35229904
-
Improving CBCT quality to CT level using deep learning with generative adversarial network.Med Phys. 2021 Jun;48(6):2816-2826. doi: 10.1002/mp.14624. Epub 2021 May 14. Med Phys. 2021. PMID: 33259647 Free PMC article.
-
Projection-domain scatter correction for cone beam computed tomography using a residual convolutional neural network.Med Phys. 2019 Jul;46(7):3142-3155. doi: 10.1002/mp.13583. Epub 2019 Jun 5. Med Phys. 2019. PMID: 31077390 Free PMC article.
-
Generating synthesized computed tomography from CBCT using a conditional generative adversarial network for head and neck cancer patients.Technol Cancer Res Treat. 2022 Jan-Dec;21:15330338221085358. doi: 10.1177/15330338221085358. Technol Cancer Res Treat. 2022. PMID: 35262422 Free PMC article.
-
Generating synthetic CT from low-dose cone-beam CT by using generative adversarial networks for adaptive radiotherapy.Radiat Oncol. 2021 Oct 14;16(1):202. doi: 10.1186/s13014-021-01928-w. Radiat Oncol. 2021. PMID: 34649572 Free PMC article.
Cited by
-
Range probing as a quality control tool for CBCT-based synthetic CTs: In vivo application for head and neck cancer patients.Med Phys. 2021 Aug;48(8):4498-4505. doi: 10.1002/mp.15020. Epub 2021 Jul 11. Med Phys. 2021. PMID: 34077554 Free PMC article.
-
Deep learning methods for enhancing cone-beam CT image quality toward adaptive radiation therapy: A systematic review.Med Phys. 2022 Sep;49(9):6019-6054. doi: 10.1002/mp.15840. Epub 2022 Jul 18. Med Phys. 2022. PMID: 35789489 Free PMC article.
-
CBCT-based synthetic CT generated using CycleGAN with HU correction for adaptive radiotherapy of nasopharyngeal carcinoma.Sci Rep. 2023 Apr 24;13(1):6624. doi: 10.1038/s41598-023-33472-w. Sci Rep. 2023. PMID: 37095147 Free PMC article.
-
Deep learning synthesis of cone-beam computed tomography from zero echo time magnetic resonance imaging.Sci Rep. 2023 Apr 13;13(1):6031. doi: 10.1038/s41598-023-33288-8. Sci Rep. 2023. PMID: 37055501 Free PMC article.
-
A systematic review of the role of artificial intelligence in automating computed tomography-based adaptive radiotherapy for head and neck cancer.Phys Imaging Radiat Oncol. 2025 Feb 14;33:100731. doi: 10.1016/j.phro.2025.100731. eCollection 2025 Jan. Phys Imaging Radiat Oncol. 2025. PMID: 40026912 Free PMC article. Review.
References
-
- Chollet F and others. Keras. 2015 https://keras.io.
-
- Çiçek Ö, Abdulkadir A, Lienkamp SS, Brox T and Ronneberger O 2016. 3D U-Net: learning dense volumetric segmentation from sparse annotation International conference on medical image computing and computer-assisted intervention pp 424–32
-
- Dinkla AM. et al. Dosimetric evaluation of synthetic CT for head and neck radiotherapy generated by a patch-based 3D convolutional neural network. Med. Phys 2019 - PubMed
-
- de Gonzalez AB and Darby S 2004. Risk of cancer from diagnostic X-rays: estimates for the UK and 14 other countries Lancet 363 345–51 - PubMed
Publication types
MeSH terms
Grants and funding
LinkOut - more resources
Full Text Sources
Medical
Miscellaneous