. 2019 Dec 16;17(1):230.
doi: 10.1186/s12916-019-1466-7.

Calibration: the Achilles heel of predictive analytics

Collaborators, Affiliations

Calibration: the Achilles heel of predictive analytics

Ben Van Calster et al. BMC Med. .

Abstract

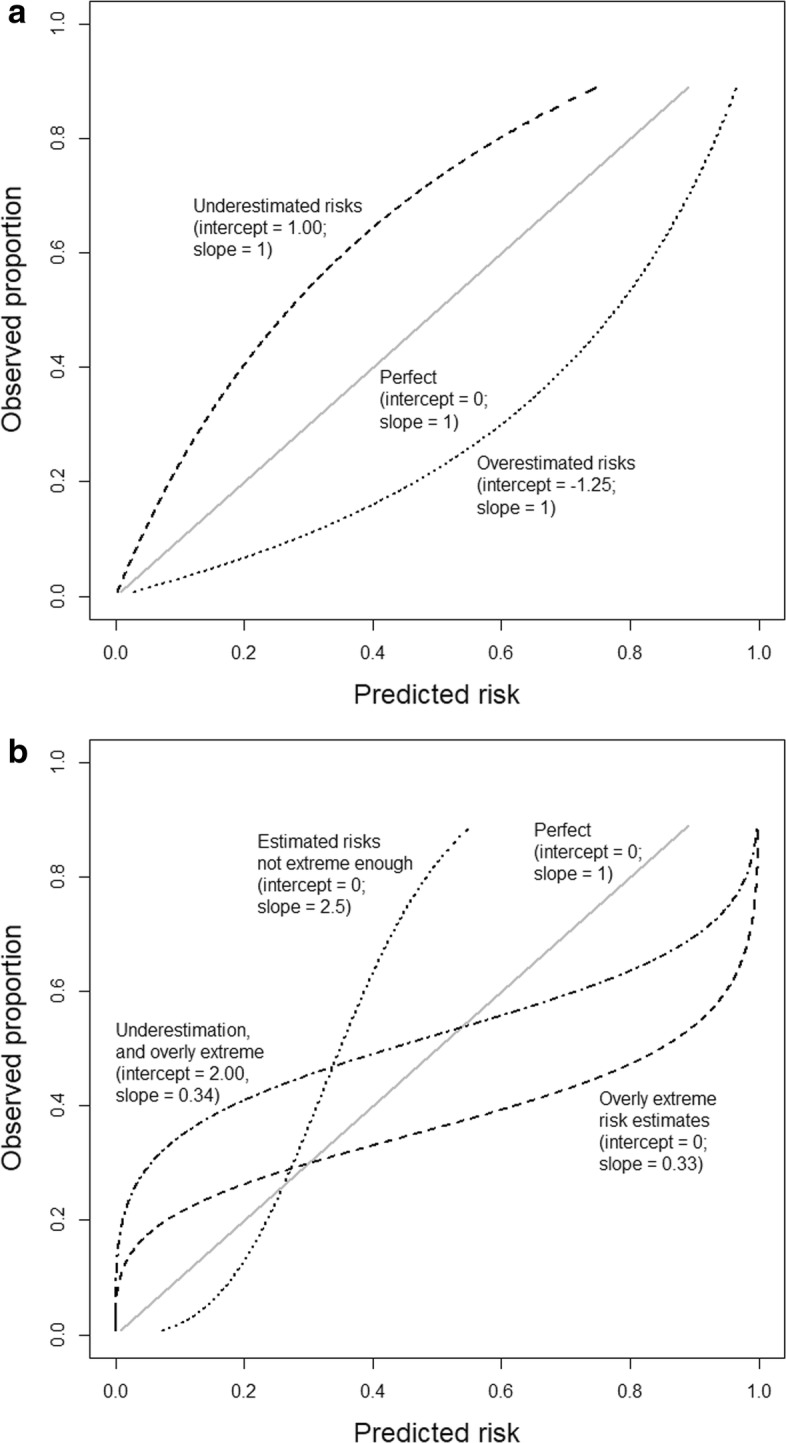
Background: The assessment of calibration performance of risk prediction models based on regression or more flexible machine learning algorithms receives little attention.

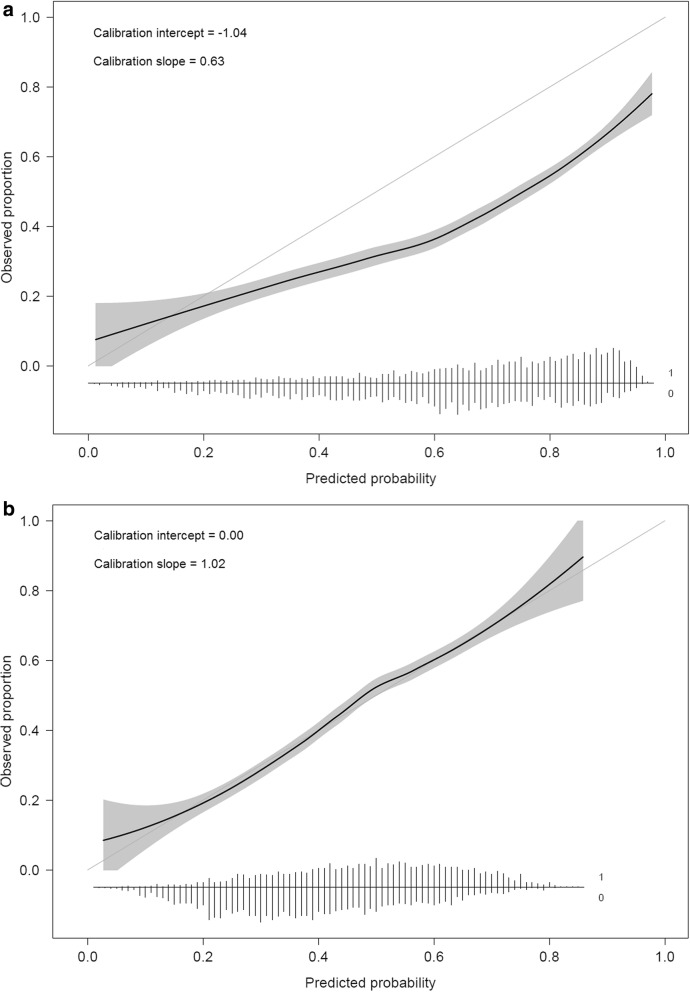
Main text: Herein, we argue that this needs to change immediately because poorly calibrated algorithms can be misleading and potentially harmful for clinical decision-making. We summarize how to avoid poor calibration at algorithm development and how to assess calibration at algorithm validation, emphasizing balance between model complexity and the available sample size. At external validation, calibration curves require sufficiently large samples. Algorithm updating should be considered for appropriate support of clinical practice.

Conclusion: Efforts are required to avoid poor calibration when developing prediction models, to evaluate calibration when validating models, and to update models when indicated. The ultimate aim is to optimize the utility of predictive analytics for shared decision-making and patient counseling.

Keywords: Calibration; Heterogeneity; Model performance; Overfitting; Predictive analytics; Risk prediction models.


Conflict of interest statement

The authors declare that they have no competing interests.

Figures

Fig. 1
Fig. 1
Illustrations of different types of miscalibration. Illustrations are based on an outcome with a 25% event rate and a model with an area under the ROC curve (AUC or c-statistic) of 0.71. Calibration intercept and slope are indicated for each illustrative curve. a General over- or underestimation of predicted risks. b Predicted risks that are too extreme or not extreme enough
Fig. 2
Fig. 2
Calibration curves when validating a model for obstructive coronary artery disease before and after updating. a Calibration curve before updating. b Calibration curve after updating by re-estimating the model coefficients. The flexible curve with pointwise confidence intervals (gray area) was based on local regression (loess). At the bottom of the graphs, histograms of the predicted risks are shown for patients with (1) and patients without (0) coronary artery disease. Figure adapted from Edlinger et al. [38], which was published under the Creative Commons Attribution–Noncommercial (CC BY-NC 4.0) license

References

    1. Steyerberg EW. Clinical prediction models. New York: Springer; 2009.
    1. Wessler BS, Paulus J, Lundquist CM, et al. Tufts PACE clinical predictive model registry: update 1990 through 2015. Diagn Progn Res. 2017;1:10. doi: 10.1186/s41512-017-0021-2. - DOI - PMC - PubMed
    1. Kleinrouweler CE, Cheong-See FM, Collins GS, et al. Prognostic models in obstetrics: available, but far from applicable. Am J Obstet Gynecol. 2016;214:79–90. doi: 10.1016/j.ajog.2015.06.013. - DOI - PubMed
    1. Van Calster B, Nieboer D, Vergouwe Y, De Cock B, Pencina MJ, Steyerberg EW. A calibration hierarchy for risk models was defined: from utopia to empirical data. J Clin Epidemiol. 2016;74:167–176. doi: 10.1016/j.jclinepi.2015.12.005. - DOI - PubMed
    1. Collins GS, de Groot JA, Dutton S, et al. External validation of multivariable prediction models: a systematic review of methodological conduct and reporting. BMC Med Res Methodol. 2014;14:40. doi: 10.1186/1471-2288-14-40. - DOI - PMC - PubMed

Publication types

LinkOut - more resources