. 2019 Dec 16;17(1):166.
doi: 10.1186/s12964-019-0487-3.

N-methyl-D-aspartate (NMDA) receptor expression and function is required for early chondrogenesis

Affiliations

N-methyl-D-aspartate (NMDA) receptor expression and function is required for early chondrogenesis

Csaba Matta et al. Cell Commun Signal. .

Abstract

Background: In vitro chondrogenesis depends on the concerted action of numerous signalling pathways, many of which are sensitive to the changes of intracellular Ca2+ concentration. N-methyl-D-aspartate (NMDA) glutamate receptor is a cation channel with high permeability for Ca2+. Whilst there is now accumulating evidence for the expression and function of NMDA receptors in non-neural tissues including mature cartilage and bone, the contribution of glutamate signalling to the regulation of chondrogenesis is yet to be elucidated.

Methods: We studied the role of glutamatergic signalling during the course of in vitro chondrogenesis in high density chondrifying cell cultures using single cell fluorescent calcium imaging, patch clamp, transient gene silencing, and western blotting.

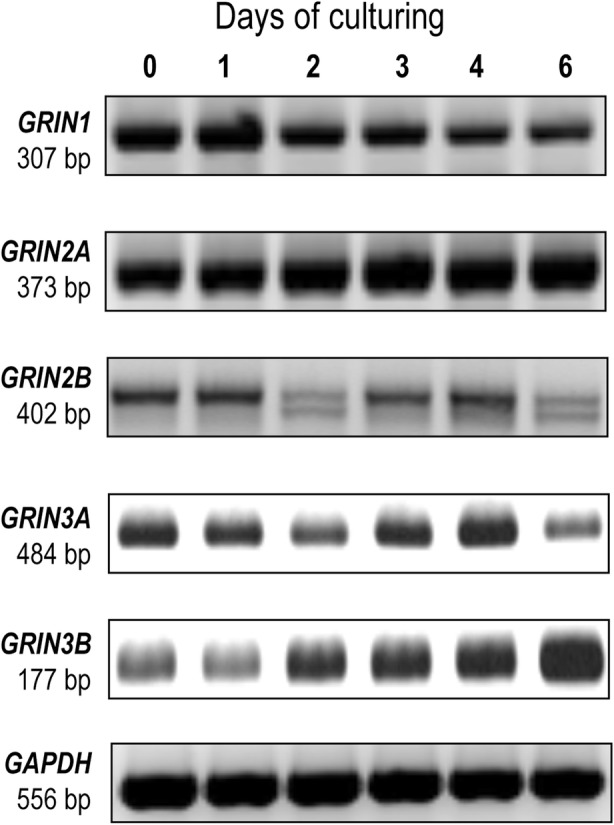
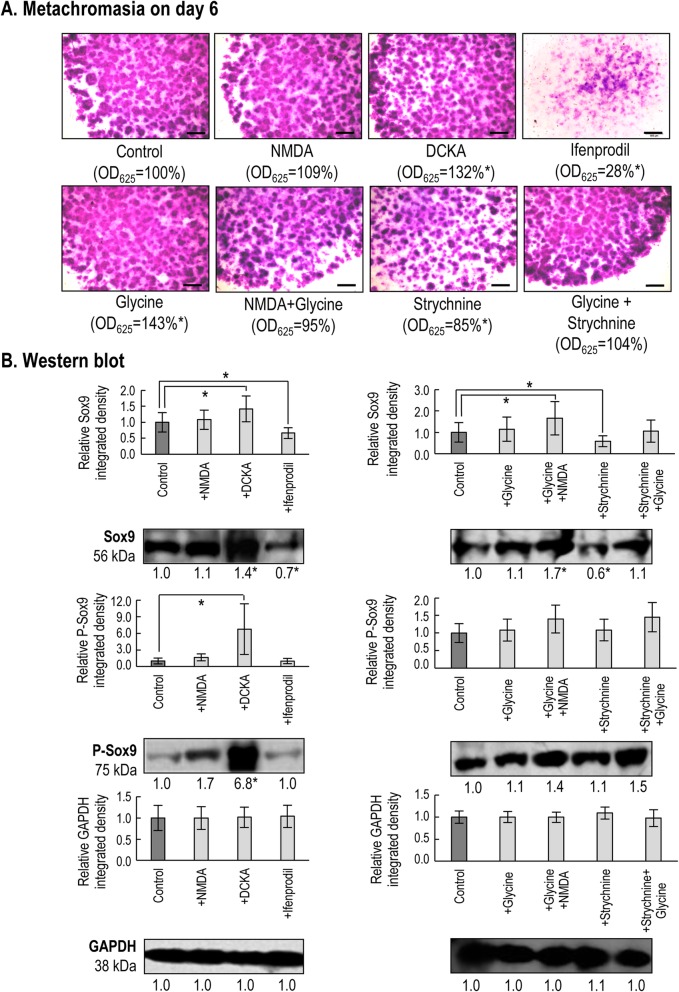
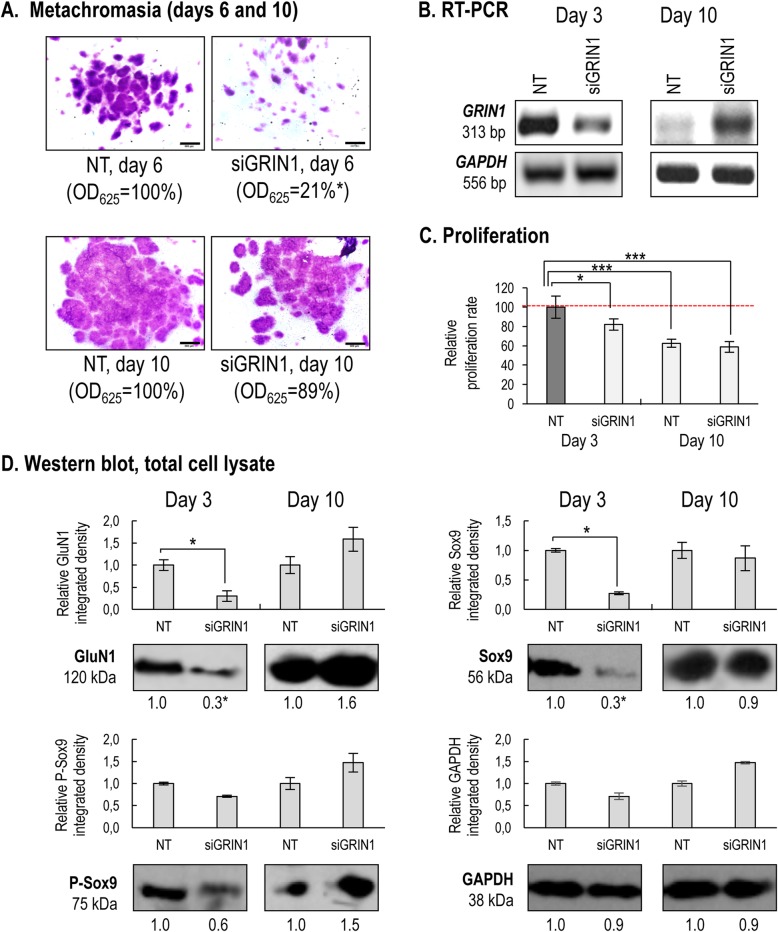
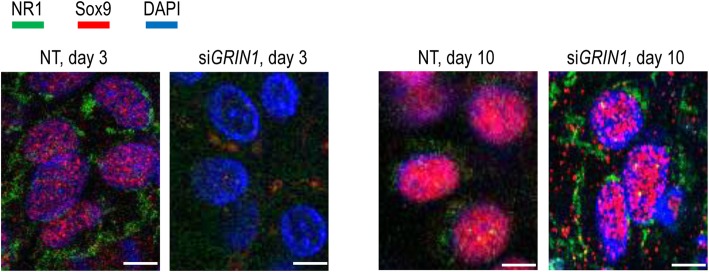
Results: Here we show that key components of the glutamatergic signalling pathways are functional during in vitro chondrogenesis in a primary chicken chondrogenic model system. We also present the full glutamate receptor subunit mRNA and protein expression profile of these cultures. This is the first study to report that NMDA-mediated signalling may act as a key factor in embryonic limb bud-derived chondrogenic cultures as it evokes intracellular Ca2+ transients, which are abolished by the GluN2B subunit-specific inhibitor ifenprodil. The function of NMDARs is essential for chondrogenesis as their functional knock-down using either ifenprodil or GRIN1 siRNA temporarily blocks the differentiation of chondroprogenitor cells. Cartilage formation was fully restored with the re-expression of the GluN1 protein.

Conclusions: We propose a key role for NMDARs during the transition of chondroprogenitor cells to cartilage matrix-producing chondroblasts.

Keywords: Chondrocyte; Chondrogenesis; Glutamate signalling; Glycine; N-methyl-D-aspartate receptor; NMDAR; Single cell calcium imaging; siRNA.


Conflict of interest statement

The authors declare that they have no competing interests. This paper was written by the authors within the scope of their academic and research positions. None of the authors have any relationships that could be construed as biased or inappropriate. The funding bodies were not involved in the study design, data collection, analysis and interpretation. The decision to submit the paper for publication was not influenced by any the funding bodies.

Figures

Fig. 1
Fig. 1
NMDAR subunit expression profile of chondrifying chicken micromass cultures during the entire culturing period (days 0–6). mRNA expression profiles of GRIN1, GRIN2A, GRIN2B, GRIN3A, GRIN3B and GRIN3C (n = 3 for each culturing day). Assays for GRIN2C and GRIN2D have also been performed but no bands at the expected size were detected (see Additional file 1: Fig. S2 in the Online Resource)
Fig. 2
Fig. 2
NMDAR subunit expression profile of chondrifying chicken micromass cultures during the entire culturing period (days 0–6). a. Protein expression profiles of GluN1, GluN2A, GluN2B, GluN3A and GluN3B subunits in total cell lysates (n = 3 for each culturing day). b. Protein expression profiles of GluN1, GluN2B, GluN3A and GluN3B subunits in the membrane fraction (n = 3 for each culturing day). Immunoblotting for GluN2A in the membrane fraction has also been performed but no bands at the expected size were detected (see Additional file 1: Fig. S2 in the Online Resource). Optical densities of bands from 3 parallel experiments were pooled and presented as bar graphs ± SEM, along with representative membrane images from a single experiment. The representative membrane images are out of 3 independent experiments, each showing a similar expression profile. For the total lysates, data normalization was performed by normalizing each data to the optical density values of the loading control (GAPDH) on the same day, and then to the day 0 cultures. For the membrane fraction, optical density values were normalized to the day 0 cultures. Significant (*P < 0.05) changes in protein levels of the mean optical densities of each day from 3 experiments relative to the previous day (mean) are marked
Fig. 3
Fig. 3
Effect of locally administered 20 μM NMDA on the cytosolic Ca2+ levels in Fura-2-loaded cells in micromass cultures at room temperature. a. Ca2+ transients evoked by administration of NMDA in cells on different days of culturing. When not indicated, Ca2+ transients were measured in the presence of 1.8 mM [Ca2+]e. Representative records of 3 independent experiments. Lines under graphs indicate the application of NMDA, KCl (120 mM) or Ca2+-free Tyrode’s. b. Changes in the peak amplitude of NMDA-evoked Ca2+ transients (average ± SEM) detected on different days of culturing in Fura-2-loaded cells. Numbers above bars represent the ratio of cells responding to the NMDA challenge. Representative data of 3 independent experiments, each showing similar trends of changes. c. Record showing the lack of Ca2+ transients evoked by administration of 10 μM glycine measured in the presence of 1.8 mM [Ca2+]e. Representative record of 3 independent experiments
Fig. 4
Fig. 4
Spontaneous Ca2+ oscillations in cells of micromass cultures on day 2 of culturing. Prior to measurements, cells were loaded with Fluo-4-AM for 30 min. Ca2+ oscillations were observed without agonist stimulation in Tyrode’s solution containing 1.8 mM [Ca2+]e at room temperature. Acquisition of line-scan images started immediately after changing the bath solution on cultures. a. Spontaneous Ca2+ oscillations in normal ([Ca2+]e = 1.8 mM) Tyrode’s solution, or following application of 20 μM NMDA or 20 μM ifenprodil. Line-scan diagrams show representative data out of 3 independent experiments. b. Box plot showing the distribution of the length of spontaneous events; control cells are black, NMDA-treated cells are grey. The box plot shows the full time at half maximum (FTHM) values of the detected spontaneous transients (dots: individual data points; +: mean values; whiskers: minimum and maximum values of the data sets; left and right borders of the boxes: the 25th and 75th percentiles). A significant (**P < 0.01, with Mann-Whitney test) change in event length following NMDA challenge relative to the control was detected
Fig. 5
Fig. 5
Effects of pharmacological modulation of NMDAR function on chondrogenesis. a. Metachromatic cartilage areas in 6-day-old high density colonies were visualised with DMMB dissolved in 3% acetic acid (pH 1.8). Metachromatic (purple) structures represent cartilaginous nodules formed by multiple cells and an ECM rich in polyanionic GAGs (n = 3 for each experimental condition). Original magnification was 2×. Scale bar, 1 mm. Optical density (OD625) was determined in supernatants of 6-day-old cultures (n = 3 for each experimental condition) containing toluidine blue extracted with 8% HCl dissolved in absolute ethanol. Representative data out of 3 independent experiments. Statistically significant (*P < 0.05) differences in extinction (OD625) of samples for TB relative to the respective vehicle control are marked. b. Protein expression and phosphorylation status of the master chondrogenic transcription factor Sox9 in 3-day-old cultures (n = 3 for each experimental condition). Optical densities of bands from 3 experiments were pooled and presented as bar graphs ± SEM, along with representative membrane images from a single experiment. The representative membrane images are out of 3 independent experiments, each showing a similar expression profile. Data normalization was performed by normalizing each data to the optical density values of the loading control (GAPDH) for the same experimental condition, and then to the control cultures (dark grey columns). Significant (*P < 0.05) alterations in protein levels of the mean signal densities from 3 experiments relative to the respective controls (mean) are marked
Fig. 6
Fig. 6
Mitochondrial activity, a measure of cell viability (a) and rate of proliferation (b) on day 3 determined by MTT test and 3H-thymidine incorporation assays, respectively, in micromass cultures (n = 3 for each experimental condition) following pharmacological modulation of NMDAR function. Representative data (average ± SEM) out of 3 independent experiments showing the same tendency of changes. For each experimental group, data were normalized to that of the respective vehicle control (not shown individually). Statistically significant (*P < 0.05) differences compared to the vehicle control are marked
Fig. 7
Fig. 7
Effects of transient gene silencing using of the GRIN1 siRNA on chondrogenesis. a. Metachromatic cartilage areas in 6 or 10-day-old high density colonies (n = 3 for each experimental condition on each day) were visualised with DMMB. Original magnification was 2×. Scale bar, 1 mm. Optical density (OD625) was determined in supernatants of 6 or 10-day-old cultures (n = 3 for each experimental condition on each day) containing extracted toluidine blue. Statistically significant (*P < 0.05) differences in extinction (OD625) of samples for TB are marked. b. mRNA expression of the GRIN1 gene following gene silencing with siRNA on culturing days 3 and 10 (n = 3 for each experimental condition on each day). Non-targeting (NT) siRNA was used as a control, and GAPDH was used as a reference gene. c. Proliferation rate on days 3 and 10 in micromass cultures (n = 3 for each experimental condition on each day; average ± SEM). Significant (*P < 0.05; ***P < 0.0001) changes of proliferation rate relative to the non-targeting (NT) control (on day 3) are marked. d. Protein expression of the GluN1 subunit, as well as expression and phosphorylation status of Sox9 in 3- and 10-day-old cultures (n = 3 for each experimental condition on each day). GAPDH was used as an internal control. Optical densities of bands from 3 experiments were pooled and presented as bar graphs ± SEM, along with representative membrane images from a single experiment. The representative membrane images are out of 3 independent experiments, each showing a similar expression profile. Data normalization was performed by normalizing the density date of the gene silenced cultures to the optical density values of the loading control (GAPDH) for the same experimental condition, and then to the NT control cultures (dark grey columns). Significant (*P < 0.05) alterations in protein levels of the mean signal densities from 3 experiments relative to the NT control (mean) on the same culturing day are marked. All panels show representative data out of 3 independent experiments showing the same tendency of changes
Fig. 8
Fig. 8
Intracellular localisation of Sox9 and GluN1, following transient gene silencing of GRIN1 on days 3 and 10. Primary antibodies were visualised with anti-rabbit Alexa Fluor 555 (for Sox9) or anti-mouse Alexa Flour 488 (for GluN1) secondary antibodies. Nuclear DNA was stained with DAPI. Non-targeting (NT) siRNA was used as a control. Images shown are representative out of 3 independent experiments. Scale bar, 15 μm

References

    1. Hollander AP, Dickinson SC, Kafienah W. Stem cells and cartilage development: complexities of a simple tissue. Stem Cells. 2010;28(11):1992–1996. doi: 10.1002/stem.534. - DOI - PMC - PubMed
    1. Matta C, Zakany R. Calcium signalling in chondrogenesis: implications for cartilage repair. Front Biosci (Schol Ed) 2013;5:305–324. doi: 10.2741/S374. - DOI - PubMed
    1. Matta C, Fodor J, Csernoch L, Zakany R. Purinergic signalling-evoked intracellular Ca(2+) concentration changes in the regulation of chondrogenesis and skeletal muscle formation. Cell Calcium. 2016;59(2–3):108–116. doi: 10.1016/j.ceca.2016.01.006. - DOI - PubMed
    1. Varga Z, Juhasz T, Matta C, Fodor J, Katona E, Bartok A, et al. Switch of voltage-gated K+ channel expression in the plasma membrane of chondrogenic cells affects cytosolic Ca2+−oscillations and cartilage formation. PLoS One. 2011;6(11):e27957. doi: 10.1371/journal.pone.0027957. - DOI - PMC - PubMed
    1. Fodor J, Matta C, Olah T, Juhasz T, Takacs R, Toth A, et al. Store-operated calcium entry and calcium influx via voltage-operated calcium channels regulate intracellular calcium oscillations in chondrogenic cells. Cell Calcium. 2013;54(1):1–16. doi: 10.1016/j.ceca.2013.03.003. - DOI - PubMed

Publication types

MeSH terms

LinkOut - more resources