Multicenter Study
. 2020 Jan;22(1):50-59.
doi: 10.1016/j.jmoldx.2019.08.004.

Acoustofluidic Salivary Exosome Isolation: A Liquid Biopsy Compatible Approach for Human Papillomavirus-Associated Oropharyngeal Cancer Detection

Affiliations
Multicenter Study

Acoustofluidic Salivary Exosome Isolation: A Liquid Biopsy Compatible Approach for Human Papillomavirus-Associated Oropharyngeal Cancer Detection

Zeyu Wang et al. J Mol Diagn. 2020 Jan.

Abstract

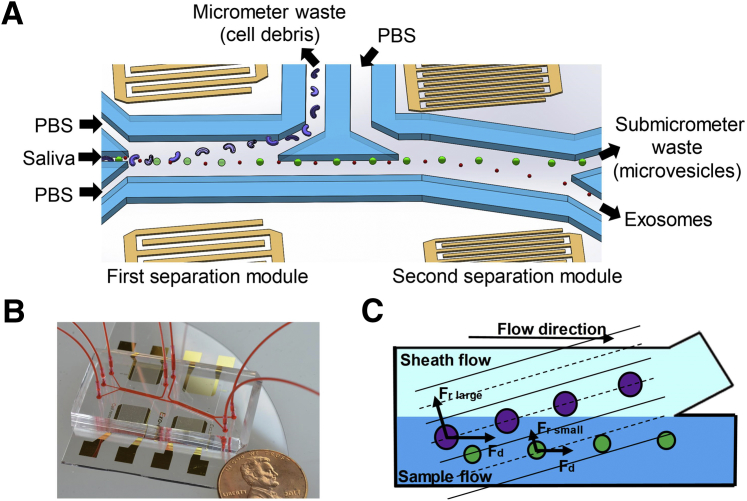
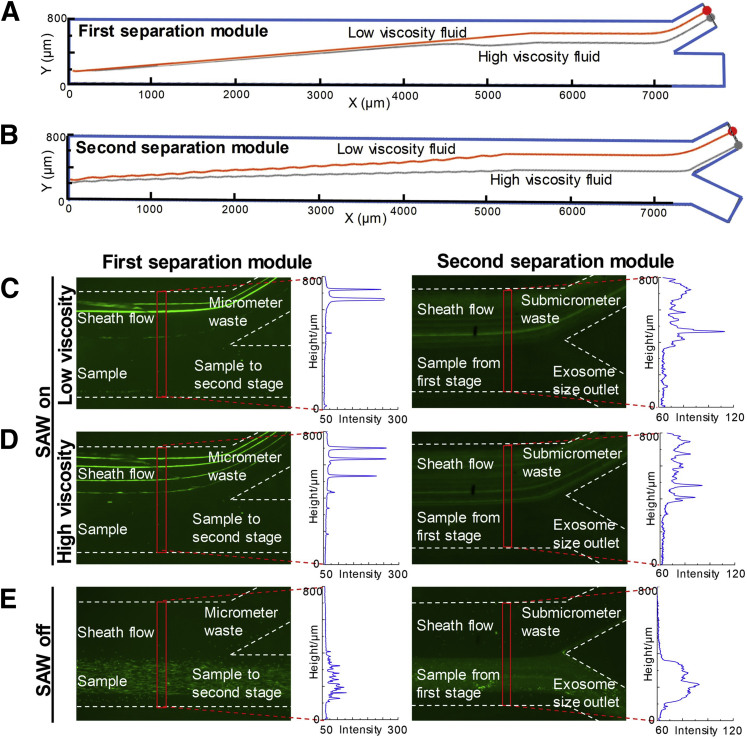
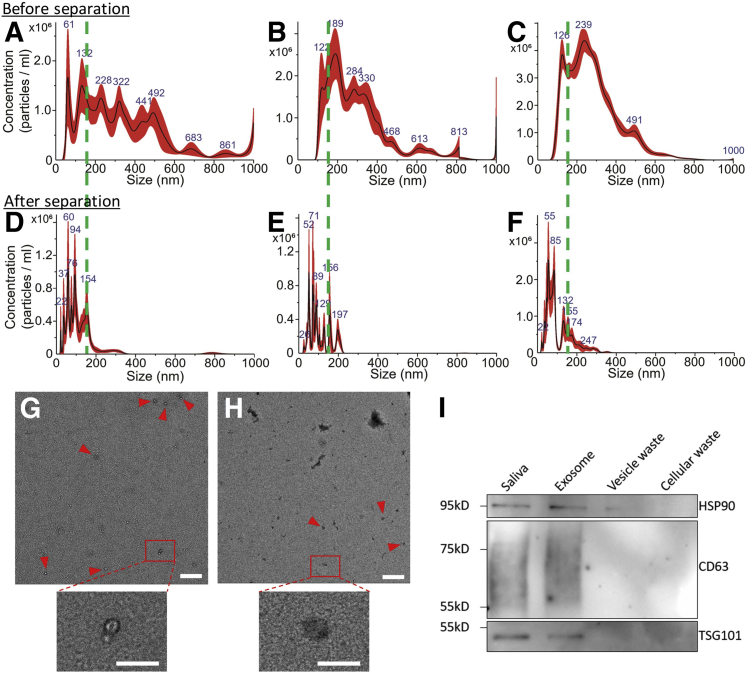
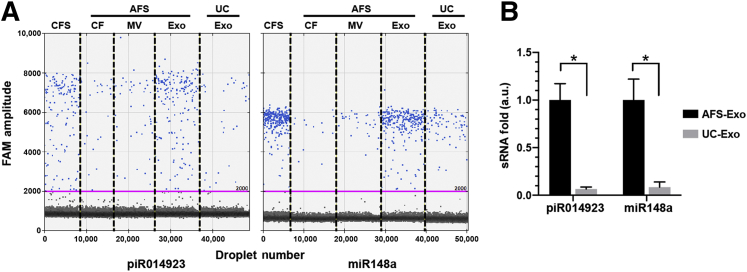
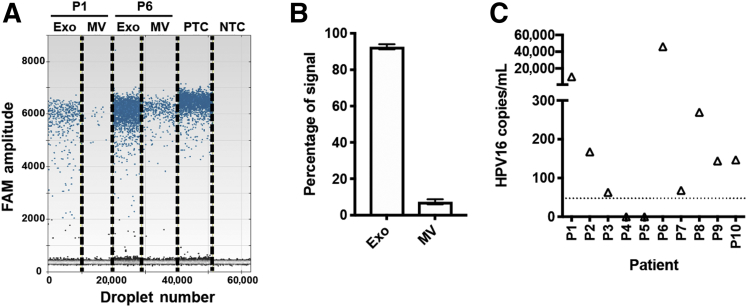
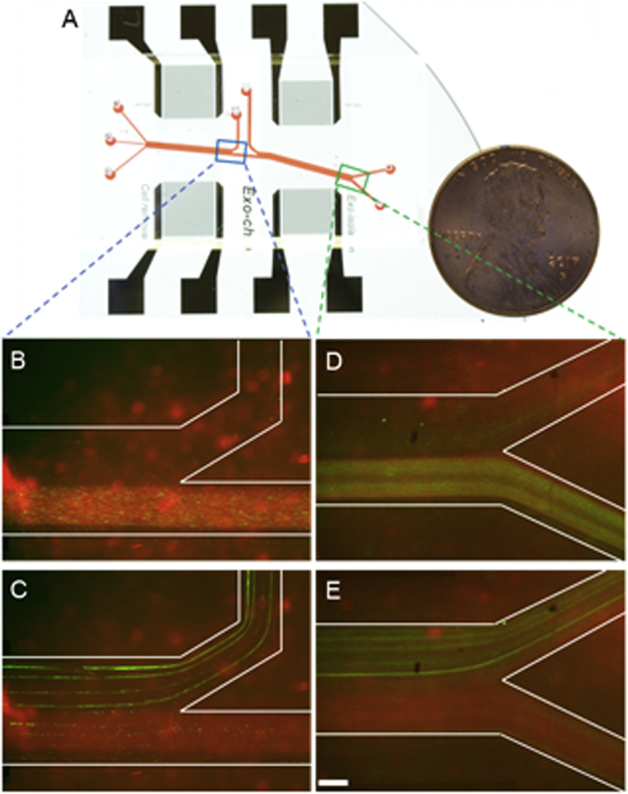
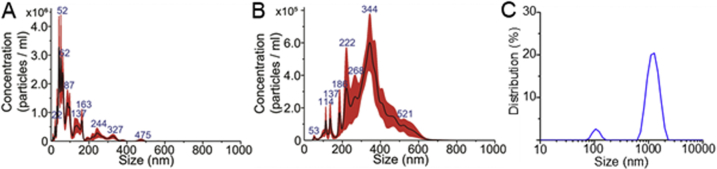
Previous efforts to evaluate the detection of human papilloma viral (HPV) DNA in whole saliva as a diagnostic measure for HPV-associated oropharyngeal cancer (HPV-OPC) have not shown sufficient clinical performance. We hypothesize that salivary exosomes are packaged with HPV-associated biomarkers, and efficient enrichment of salivary exosomes through isolation can enhance diagnostic and prognostic performance for HPV-OPC. In this study, an acoustofluidic (the fusion of acoustics and microfluidics) platform was developed to perform size-based isolation of salivary exosomes. These data showed that this platform is capable of consistently isolating exosomes from saliva samples, regardless of viscosity variation and collection method. Compared with the current gold standard, differential centrifugation, droplet digital RT-PCR analysis showed that the average yield of salivary exosomal small RNA from the acoustofluidic platform is 15 times higher. With this high-yield exosome isolation platform, we show that HPV16 DNA could be detected in isolated exosomes from the saliva of HPV-associated OPC patients at 80% concordance with tissues/biopsies positive for HPV16. Overall, these data demonstrated that the acoustofluidic platform can achieve high-purity and high-yield salivary exosome isolation for downstream salivary exosome-based liquid biopsy applications. Additionally, HPV16 DNA sequences in HPV-OPC patients are packaged in salivary exosomes and their isolation will enhance the detection of HPV16 DNA.


Figures

Figure 1
Figure 1
Schematics and mechanism of the device. A: Schematic of the acoustofluidic device for salivary exosome separation. The device has two modules using 20-MHz and 40-MHz surface acoustic waves (SAWs) for micrometer and submicrometer particle separation. B: An optical image of the integrated acoustofluidic device (penny shown for size comparison). C: Size-based separation occurs in each module. Due to the acoustic radiation force (Fr) induced by a SAW field and a drag force induced by fluid (Fd) large particles are separated into a sheath flow, whereas smaller particles remain in the primary sample flow. PBS, phosphate-buffered saline.
Figure 2
Figure 2
Influence of fluid viscosity on particle separation. A: Simulation of 2-μm particle trajectories in the first separation module with 0.89- and 2.65-mPas viscosity fluids. B: Simulation of 500-nm particle trajectories in the second separation module with 40-MHz surface acoustic waves (SAW) in 0.89- and 2.65-mPas viscosity fluids. C and D: Experimental results for acoustofluidic separation of 2-μm and 500-nm particles in low-viscosity (C) and high-viscosity (D) fluids. Compared with low viscosity, high viscosity causes particles to move closer to the sample outlets. Therefore, under the right experimental conditions, high viscosity interferes with separation but will not cause failure separation of 2-μm or 500-nm particles to the micrometer waste outlet or submicrometer waste outlet when SAW is on. E: When both the separation modules were deactivated, 2-μm or 500-nm particles could not be unseparated out from the sample flow. CE: Optical images and the results from nanoparticle tracking analysis, which is used to measure particle size distributions.
Figure 3
Figure 3
Characterization of acoustofluidic chip exosome isolation. AF: Particle size distributions of original samples of cell-free (A), Oasis-collected (B), and whole (C) and acoustofluidic-isolated cell-free (D), Oasis-collected (E), and whole (F) saliva. The acoustofluidic-isolated samples show low concentrations of particles bigger than 200 nm compared with the original samples. Dashed green lines show the 150 nm position on the x axis of the size distribution results. G and H: A transmission electron microscopy image demonstrates an isolated, whole saliva sample that contains fewer contaminants (G) than the original sample (H). Particles with exosomal morphology are tagged by red arrowheads. Boxed areas in top panels are shown at higher magnification in the lower panels. I: Western blot analysis for an exosomal protein biomarker. Only isolated exosome products demonstrate exosomal biomarkers with counts similar to the original sample. Scale bars: 500 nm (G and H, upper panels); 200 nm (G and H, lower panels).
Figure 4
Figure 4
Comparison of yields of exosomes from acoustofluidic separation (AFS) technology and differential centrifugation. A: DNA samples extracted from cell-free saliva (CFS), different acoustofluidic isolated fractions, and exosomes from differential ultracentrifugation (UC) were tested with digital droplet RT-PCR assays for piR014923 and miR148a, which were reported to be predominately located in salivary exosomes. The pink lines show the threshold of positive droplets detection at 2000 amplitude. B: The yield (expressed as a relative fold difference) of individual small RNA in isolated salivary exosomes with acoustofluidic separation (AFS-Exo) technology and differential ultracentrifugation (UC-Exo) method. *P < 0.05 (t-test). a.u., arbitrary units; CF, cell debris fraction; Exo, exosome; MV, microvesicle.
Figure 5
Figure 5
Detection of HPV16 DNA in acoustofluidic-isolated salivary exosomes of HPV16-positive oropharyngeal cancer (OPC) patients. A: Distribution of HPV16 DNA in exosomes (Exo) and microvesicles (MV) isolated from saliva of HPV16+ OPC by acoustofluidic technology. Representative results from two HPV16 exosome–positive patients (P1 and P6). Droplet digital PCR (ddPCR) HPV16 DNA detection of different vesicle fractions isolated by acoustofluidic device. B: HPV16 signals in different vesicle fractions. C: Results of HPV16 ddPCR assay for saliva exosomes of HPV-OPC patients. Eight of 10 patients (80%) were positive for HPV16 DNA. Dashed line shows a threshold of detection at 47.8 copies/mL saliva. Exo, exosomes; MV, microvesicles; NTC, negative control; PTC, positive control with synthetic HPV E7 gene.
Supplemental Figure S1
Acoustofluidic-based particle isolation using polystyrene particles of different sizes. A: Photo of the acoustofluidic platform. Squares demonstrate areas of microscopy capture. Blue boxed area is shown at higher magnification in B and C; green boxed area is shown at higher magnification in D and E. B: Mixture of 2-μm (green) and 50-nm (red) particles after the first separation module without surface acoustic waves (SAW). Both large and small particles flowed to the second separation module. C: Mixture of 2-μm (green) and 50-nm (red) particles after the first separation module with a SAW field in the channel. Two-micron particles were pushed to the waste outlet, whereas 50-nm particles continuously went to the second separation module. D: Mixture of 500-nm (green) and 50-nm (red) particles after the second separation module without SAW. Both large and small particles flowed to the exosome outlet. E: Mixture of 500-nm (green) and 50-nm (red) particles after the first separation module with SAW field in the channel. The 500-nm particles are pushed to the waste outlet, whereas 50-nm particles continuously go to the exosome outlet. Scale bar = 200 μm.
Supplemental Figure S2
Size distribution of saliva products from different outlets after acoustofluidic separation. A: Size distribution [obtained via nanoparticle tracking analysis (NTA)] of isolated saliva components from the exosome outlet. Most particles were smaller than 200 nm. B: Size distribution (obtained via NTA) of isolated saliva components from the submicrometer waste outlet. Most particles were between 200 and 600 nm. C: Size distribution (obtained via dynamic light scattering) of isolated saliva components from the micrometer waste outlet. Most particles were about 1 μm.

References

    1. Wang M.B., Liu I.Y., Gornbein J.A., Nguyen C.T. HPV-positive oropharyngeal carcinoma: a systematic review of treatment and prognosis. Otolaryngol Head Neck Surg. 2015;153:758–769. - PubMed
    1. Sedghizadeh P.P., Billington W.D., Paxton D., Ebeed R., Mahabady S., Clark G.T., Enciso R. Is p16-positive oropharyngeal squamous cell carcinoma associated with favorable prognosis? A systematic review and meta-analysis. Oral Oncol. 2016;54:15–27. - PubMed
    1. Goy J., Hall S.F., Feldman-Stewart D., Groome P.A. Diagnostic delay and disease stage in head and neck cancer: a systematic review. Laryngoscope. 2009;119:889–898. - PubMed
    1. McGurk M., Scott S. The reality of identifying early oral cancer in the general dental practice. Br Dent J. 2010;208:347–351. - PubMed
    1. Zhan K.Y., Eskander A., Kang S.Y., Old M.O., Ozer E., Agrawal A.A., Carrau R.L., Rocco J.W., Teknos T.N. Appraisal of the AJCC 8th edition pathologic staging modifications for HPV− positive oropharyngeal cancer, a study of the National Cancer Data Base. Oral Oncol. 2017;73:152–159. - PubMed

Publication types

MeSH terms