. 2020 Jan 7;117(1):610-618.
doi: 10.1073/pnas.1914183116. Epub 2019 Dec 16.

Retroviruses drive the rapid evolution of mammalian APOBEC3 genes

Affiliations

Retroviruses drive the rapid evolution of mammalian APOBEC3 genes

Jumpei Ito et al. Proc Natl Acad Sci U S A. .

Abstract

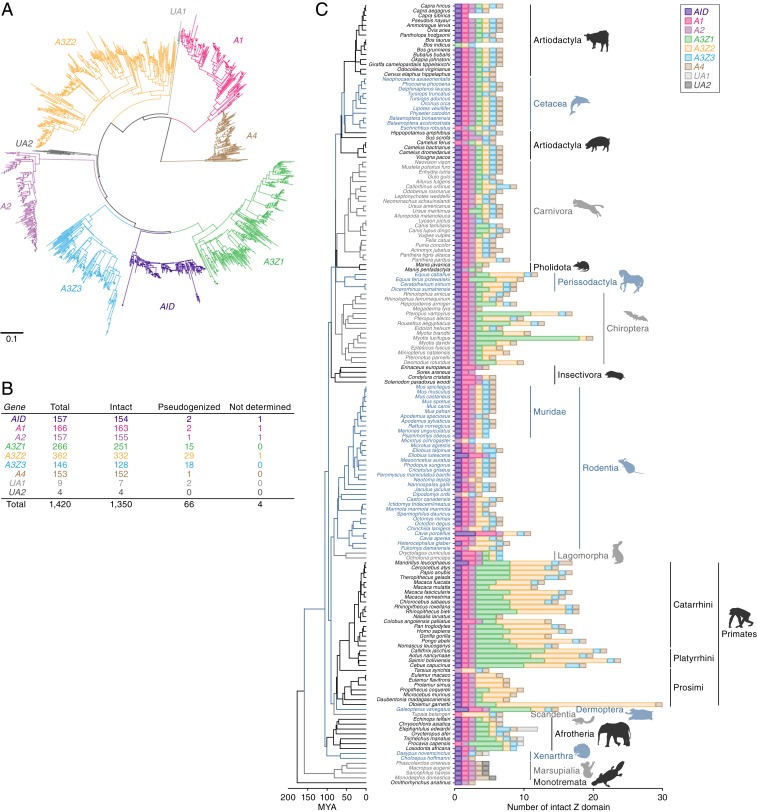
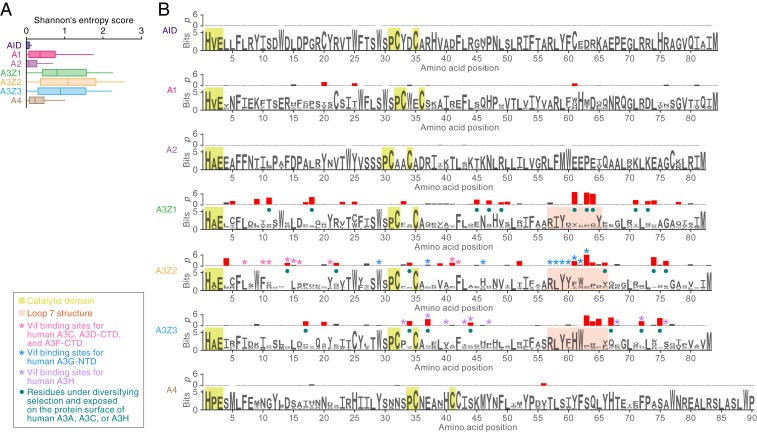
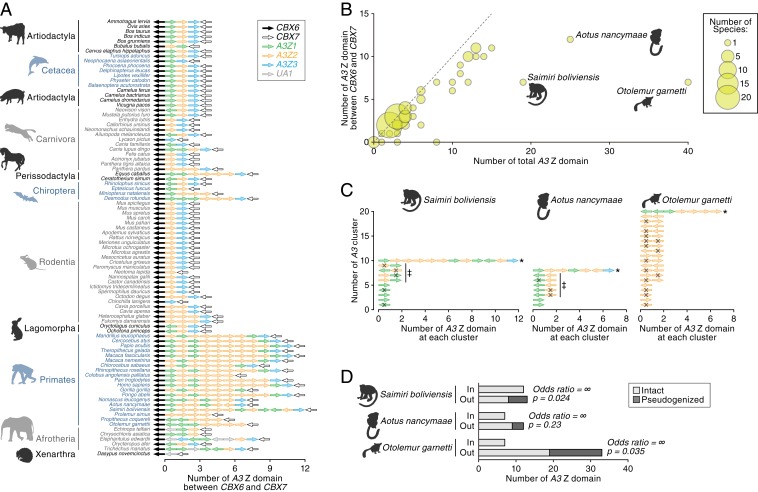
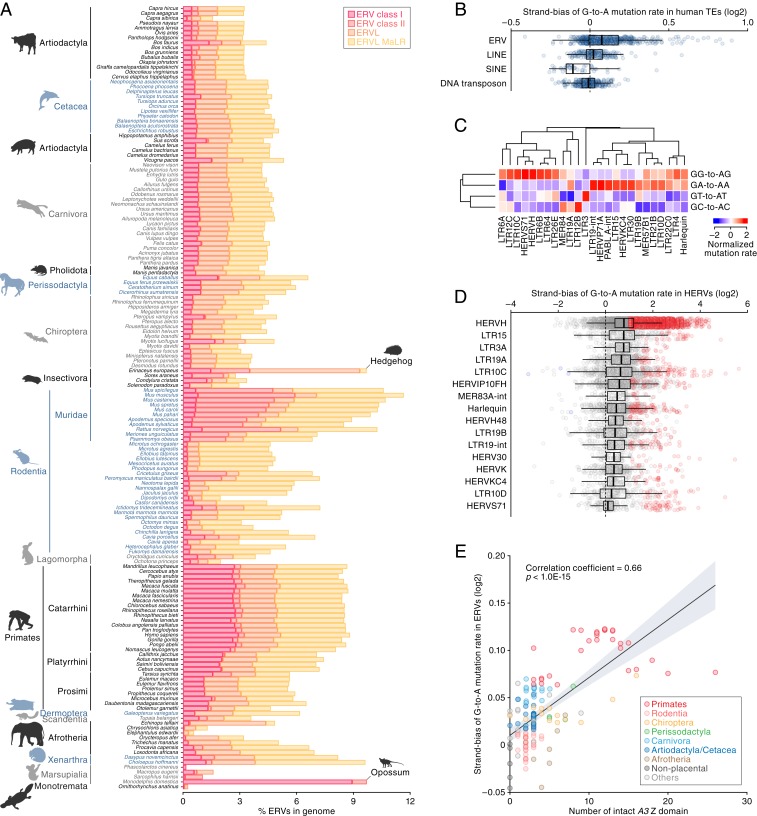
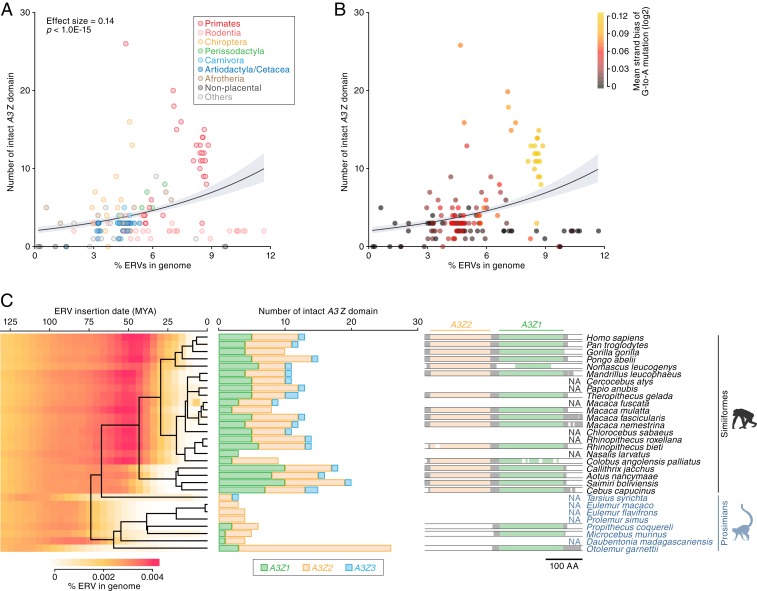
APOBEC3 (A3) genes are members of the AID/APOBEC gene family that are found exclusively in mammals. A3 genes encode antiviral proteins that restrict the replication of retroviruses by inducing G-to-A mutations in their genomes and have undergone extensive amplification and diversification during mammalian evolution. Endogenous retroviruses (ERVs) are sequences derived from ancient retroviruses that are widespread mammalian genomes. In this study we characterize the A3 repertoire and use the ERV fossil record to explore the long-term history of coevolutionary interaction between A3s and retroviruses. We examine the genomes of 160 mammalian species and identify 1,420 AID/APOBEC-related genes, including representatives of previously uncharacterized lineages. We show that A3 genes have been amplified in mammals and that amplification is positively correlated with the extent of germline colonization by ERVs. Moreover, we demonstrate that the signatures of A3-mediated mutation can be detected in ERVs found throughout mammalian genomes and show that in mammalian species with expanded A3 repertoires, ERVs are significantly enriched for G-to-A mutations. Finally, we show that A3 amplification occurred concurrently with prominent ERV invasions in primates. Our findings establish that conflict with retroviruses is a major driving force for the rapid evolution of mammalian A3 genes.

Keywords: APOBEC3; endogenous retrovirus; evolutionary arms race; gene amplification; mammal.


Conflict of interest statement

The authors declare no competing interest.

Figures

Fig. 1.
Fig. 1.
Distribution and diversity of AID/APOBEC Z domains in mammalian genomes. (A) A phylogenetic tree of AID/APOBEC Z domains identified via in silico screening of 160 mammalian genomes. The tree shown here was based on an alignment of nucleic acid sequences and was reconstructed using the NJ method (63). Scale bar indicates the genetic distance. (B) Number of AID/APOBEC Z domains. Those labeled “intact” contain no premature stop codons, while the remainder are labeled as “pseudogenized.” Z domain sequences that contained unresolved regions were labeled “not determined.” (C) Number of the intact AID/APOBEC Z domains identified in each mammal species. See SI Appendix, Fig. S3, for further details. The species tree shown here was derived from the TimeTree database (73).
Fig. 2.
Fig. 2.
Evolutionary features of AID/APOBEC Z domains. The analyses are based on the MSAs of respective classes of AID/APOBEC Z domains. The MSAs of intact Z domains of AID (n = 163), A1 (n = 155), A2 (n = 251), A3Z1 (n = 332), A3Z2 (n = 132), A3Z3 (n = 152), and A4 (n = 154) (listed in Dataset S3) were used. (A) Difference in the sequence conservations among 7 classes of AID/APOBEC Z domains. Positional sequence conservation scores (Shannon’s entropy scores) were calculated in respective amino acid sites of the MSA (shown as logo plots in B). (B) Top rows show the P values (−log10) in dN/dS ratio test [with branch-site model (25)] at each codon site. The sites under diversifying selection with statistically significance (P < 0.05) are indicated by red bars. Bottom rows show logo plots of the conserved sequences of the AID/APOBEC Z domains. Yellow square indicates the amino acid residues comprising the catalytic domain of AID/APOBEC proteins. Pink square indicates the amino acid residues corresponding to the structure loop 7. The other characteristics on each amino acid residue [e.g., Vif binding sites for human A3C (27), human A3D-CTD (27), human A3F-CTD (27, 74, 75), human A3G-NTD (41, 42), and human A3H (28, 76)] are summarized in the box to the lower left of the panel. CTD, C-terminal domain; NTD, N-terminal domain.
Fig. 3.
Fig. 3.
Genomic location of A3 genes. (A) Genomic order of the AID/APOBEC Z domains within the canonical A3 gene locus, which is sandwiched by CBX6 and CBX7 genes. Mammalian genomes in which CBX6 and CBX7 genes were detected in the same scaffold were only analyzed. The arrows indicate the direction of respective loci. (B) Bubble plot of the number of A3 Z domains in mammals. The number of the A3 Z domains in the whole genome (x axis) and that within the canonical A3 gene locus (y axis) in each mammal are plotted. Dot size is proportional to the number of species. (C) Genomic locations of A3 Z domains in S. boliviensis, A. nancymaae, and O. garnetti. A3 Z domains within 100 kb of each other were clustered. An asterisk denotes the A3 cluster corresponding to the canonical A3 gene locus. The arrows indicate the direction of respective loci. Pseudogenized sequences are indicated with an X. The sequences indicated by double daggers are intronless sequences and correspond to those described in SI Appendix, Fig. S5A. (D) The association between the genomic location of A3 genes and pseudogenization. The labels “in” and “out” denote the numbers of A3 Z domains located inside or outside the canonical A3 gene locus, respectively. Results for S. boliviensis, A. nancymaae, and O. garnetti are shown. Odds ratio and P value, calculated with Fisher’s exact test, are shown.
Fig. 4.
Fig. 4.
Signatures of A3 activity in ERV sequences and its association with A3 amplification. (A) Proportions of ERV sequences in the genomes of mammalian species. For proportions of LINE, SINE, and DNA transposon sequences, see SI Appendix, Fig. S6. (B) Strand bias scores of G-to-A mutation rates in human TEs (log2-transformed). The strand bias score is calculated as the G-to-A mutation rate ratio between the positive and negative strands. Dots indicate the strand bias scores of respective TE groups. (C) Dinucleotide sequence composition of G-to-A mutation sites in human ERV subfamilies. Of the top 50 ERV subfamilies with respect to the strand bias score, the top 25 ERV subfamilies with respect to the variation (i.e., coefficient of variation) among the 4 G-to-A mutation sites (GA, GT, GG, and GC) are shown. (D) ERV copies presenting the G-to-A hypermutation signature. ERV copies with >1 log2-transformed strand bias score and <0.1 false discovery rate are indicated as red. (E) Association of the number of A3 Z domains with the accumulation level of G-to-A mutations in ERVs in mammals. The x axis indicates the number of intact A3 Z domains, and the y axis indicates the mean value of the log2-transformed strand bias scores among ERVs in the genome. Correlation coefficient and P value are calculated by Pearson’s correlation.
Fig. 5.
Fig. 5.
Association between A3 gene family expansion and ERV invasion. (A and B) Association of the number of A3 Z domains with the amount of ERV insertions in the genome. Dots are colored according to the species taxa (A) or the accumulation level of G-to-A mutations in ERVs (B). The association was evaluated under the Poisson regression with log link function. (C) Temporal association of ERV invasion with A3 gene amplification in primates. (Left) Amount of ERV insertions in each age category in distinct primate species. ERV insertion date was estimated based on the genetic distance of each ERV integrant from the consensus sequence under the molecular clock assumption [2.2 × 10⁻⁹ mutations per site per year (68)]. (Middle) Number of intact A3 Z domains. (Right) Schematic of the MSA of A3G (A3Z2-Z3Z1 type) gene. Sequences of A3G genes in primates recorded in the Ensembl gene database (http://www.ensembl.org) were used. NA, not applicable (no available data).

References

    1. Conticello S. G., The AID/APOBEC family of nucleic acid mutators. Genome Biol. 9, 229 (2008). - PMC - PubMed
    1. Conticello S. G., Langlois M. A., Yang Z., Neuberger M. S., DNA deamination in immunity: AID in the context of its APOBEC relatives. Adv. Immunol. 94, 37–73 (2007). - PubMed
    1. Teng B., Burant C. F., Davidson N. O., Molecular cloning of an apolipoprotein B messenger RNA editing protein. Science 260, 1816–1819 (1993). - PubMed
    1. Harris R. S., Dudley J. P., APOBECs and virus restriction. Virology 479–480, 131–145 (2015). - PMC - PubMed
    1. Cheng A. Z., et al. , Epstein-Barr virus BORF2 inhibits cellular APOBEC3B to preserve viral genome integrity. Nat. Microbiol. 4, 78–88 (2019). - PMC - PubMed

Publication types

MeSH terms

LinkOut - more resources