. 2019 Dec 26;116(52):26835-26845.
doi: 10.1073/pnas.1914915116. Epub 2019 Dec 16.

Epithelial to mesenchymal plasticity and differential response to therapies in pancreatic ductal adenocarcinoma

Affiliations

Epithelial to mesenchymal plasticity and differential response to therapies in pancreatic ductal adenocarcinoma

Rebecca L Porter et al. Proc Natl Acad Sci U S A. .

Erratum in

Abstract

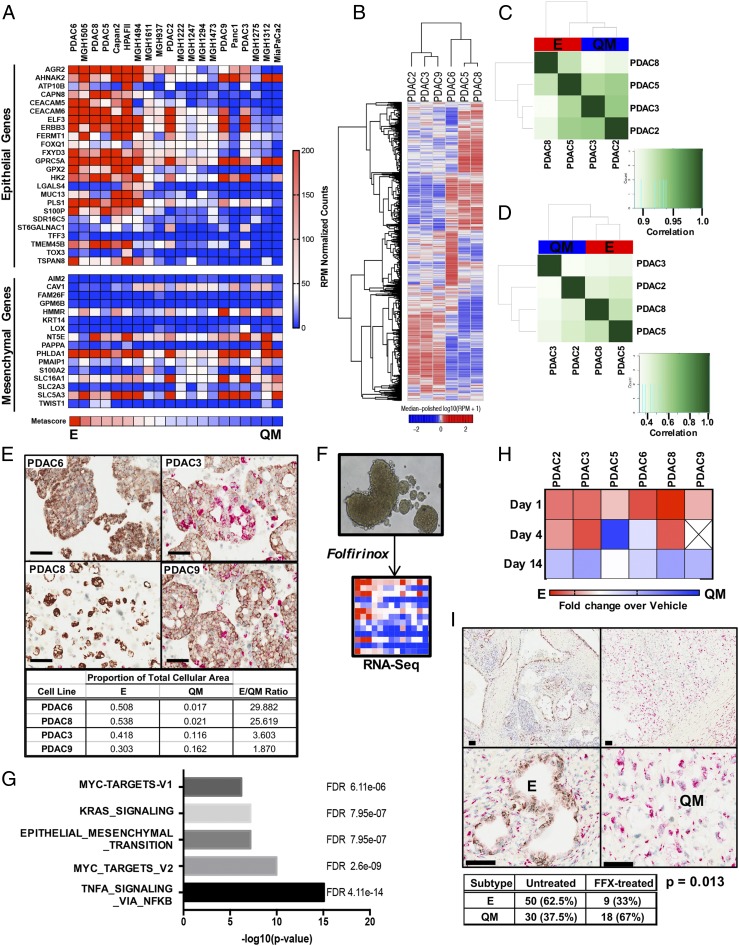
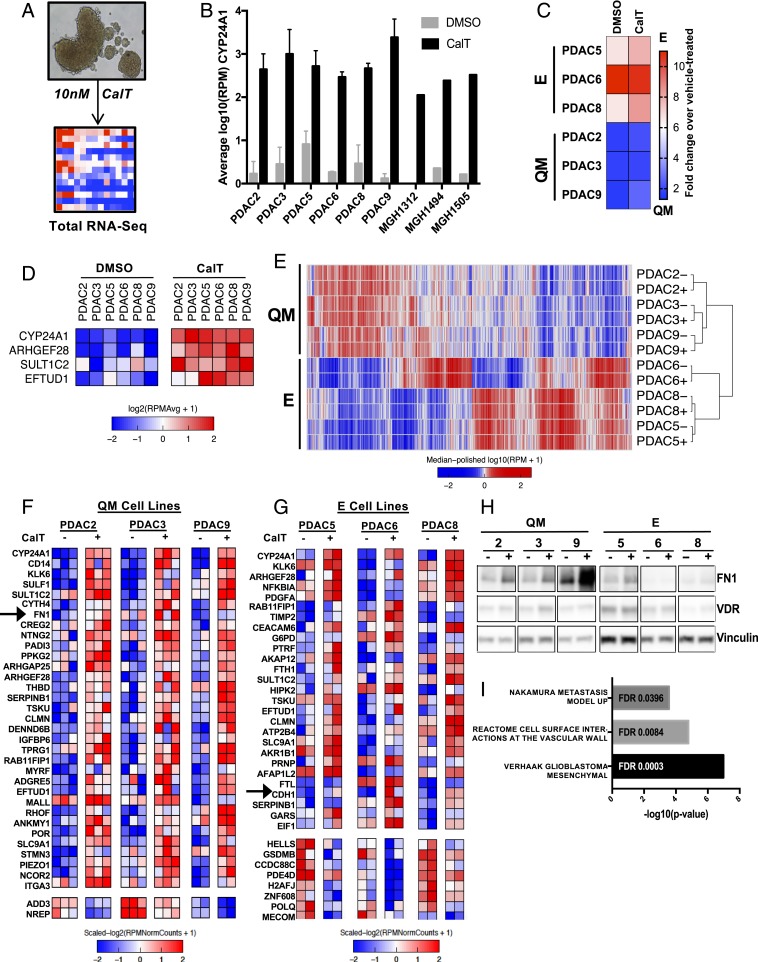
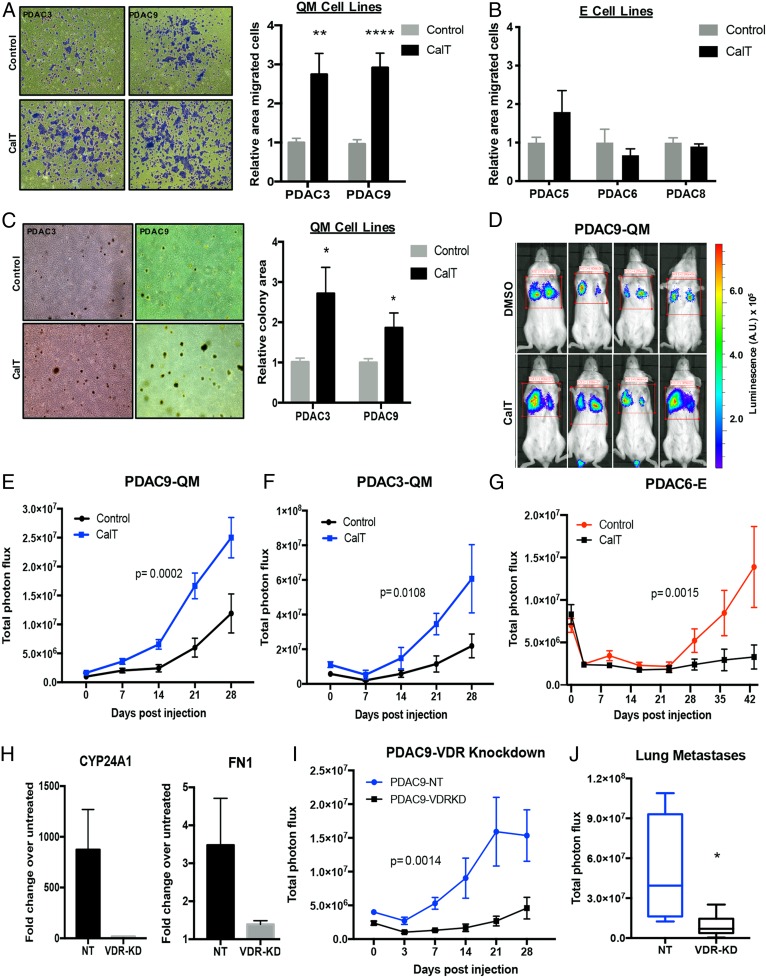
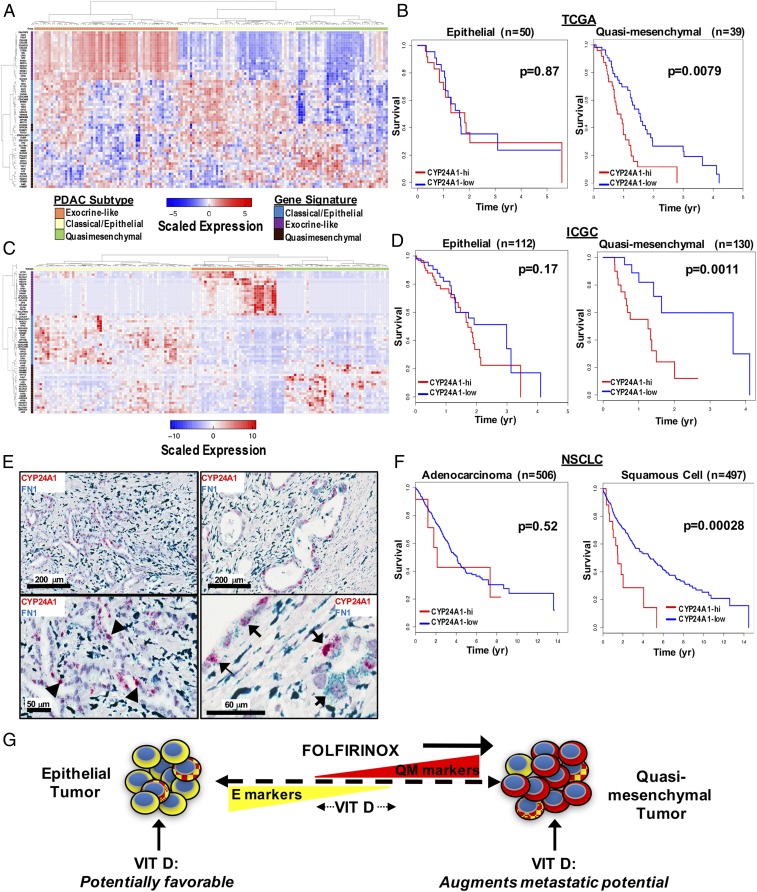
Transcriptional profiling has defined pancreatic ductal adenocarcinoma (PDAC) into distinct subtypes with the majority being classical epithelial (E) or quasi-mesenchymal (QM). Despite clear differences in clinical behavior, growing evidence indicates these subtypes exist on a continuum with features of both subtypes present and suggestive of interconverting cell states. Here, we investigated the impact of different therapies being evaluated in PDAC on the phenotypic spectrum of the E/QM state. We demonstrate using RNA-sequencing and RNA-in situ hybridization (RNA-ISH) that FOLFIRINOX combination chemotherapy induces a common shift of both E and QM PDAC toward a more QM state in cell lines and patient tumors. In contrast, Vitamin D, another drug under clinical investigation in PDAC, induces distinct transcriptional responses in each PDAC subtype, with augmentation of the baseline E and QM state. Importantly, this translates to functional changes that increase metastatic propensity in QM PDAC, but decrease dissemination in E PDAC in vivo models. These data exemplify the importance of both the initial E/QM subtype and the plasticity of E/QM states in PDAC in influencing response to therapy, which highlights their relevance in guiding clinical trials.

Keywords: Vitamin D; molecular subtypes; pancreatic ductal adenocarcinoma.


Conflict of interest statement

Competing interest statement: D.T.T. has received consulting fees from EMD Millipore-Sigma, Ventana-Roche, Foundation Medicine, Inc., and Merrimack Pharmaceuticals. D.T.T. is a founder and has equity in PanTher Therapeutics, ROME Therapeutics, and TellBio Inc., which are not related to this work. D.A.H. is founder and has equity in TellBio Inc., which is not related to this work. D.T.T.’s interests were reviewed and are managed by Massachusetts General Hospital and Partners HealthCare in accordance with their conflict of interest policies. D.T.T. and V.D. receive sponsored research support from ACD-Biotechne that was performed for some parts of this work. V.D. receives sponsored research support from Agios. M.S.L. and E.A.C. are coauthors on a 2016 paper.

Figures

Fig. 1.
Fig. 1.
PDAC exists on a continuum of epithelial to quasi-mesenchymal gene expression, and cytotoxic chemotherapy shifts toward a mesenchymal phenotype. (A) Expression heatmap to determine an E to QM metascore for each PDAC cell line using a validated gene signature (2). (B) Unsupervised clustering of RNA-seq data from 6 patient-derived PDAC cell lines. [Scale bar, log10(RPM+1).] (C and D) Correlation heatmap of ATAC-seq samples using chromatin accessibility peaks across the genome (C) and at promoter regions (D). (E) Representative images of PDAC cell lines stained with hematoxylin and by RNA-ISH for epithelial (brown) and mesenchymal (red) markers. Quantification of relative E vs. QM expression using the Halo image analysis platform shown below. (F) Schematic of experimental system in which tumor spheroids are grown in 3D culture conditions and treated with a single dose of FOLFIRINOX (FFX). RNA is extracted on day 14 for RNA-seq. (G) Top 5 enriched gene sets procured by computing overlaps between genes induced by FFX treatment across all 6 PDAC cell lines and Hallmark gene sets. (H) Heatmap depicting the relative change in E/QM metascore over time following FFX exposure in each PDAC cell line. Expressed as metascore fold change over untreated. (I) Representative images of PDAC tumors resected following neoadjuvant FFX chemotherapy and stained by RNA-ISH for E (brown) and QM (red) markers. (Scale bars, 100 μm.) Table depicts quantification of E and QM cases in the untreated cohort and the neoadjuvant FFX-treated cohort. P value calculated using Fisher’s exact 2-tailed test.
Fig. 2.
Fig. 2.
E/QM status of PDAC dictates transcriptional response to VDR activation. (A) Schematic of experimental system in which tumor spheroids are grown in 3D culture conditions and dosed with 10 nM CalT or DMSO control on day 0 and day 2. Spheroids are harvested on day 5, and RNA is extracted for total RNA-seq. (B) CYP24A1 expression in a selection of PDAC cell-line spheroids following 5 d of CalT treatment compared with vehicle control as determined by RNA-seq, expressed as log10 reads per million (RPM). Error bars indicate SD. (C) Relative change in E/QM status of each PDAC cell line following 5 d of exposure to CalT expressed as fold change in metascore over vehicle-treated. (D) Expression heatmap of genes differentially expressed upon CalT treatment in all 6 PDAC cell lines. Data represents 2 to 3 independent experiments for each cell line. (E) Unsupervised clustering of RNA-seq data from 6 patient-derived PDAC cell lines at baseline (−) and after treatment with CalT (+). [Scale bar, log10(RPM+1).] (F and G) Expression heatmaps of differentially expressed genes following treatment of QM (F) and E (G) PDAC spheroids with CalT as determined by RNA-seq. Columns represent individual biological replicates. (H) Western blot demonstrating protein levels of FN1 and VDR in PDAC spheroids following treatment of PDAC spheroids with CalT for 5 d. (I) Enriched gene sets of interest from GSEA computing overlaps between CalT-induced genes in QM cell lines and hallmark, curated, and oncogenic signatures gene sets.
Fig. 3.
Fig. 3.
Vitamin D-induced VDR activation in QM PDAC cells increases anchorage-independent cell growth, in vitro migration, and metastasis formation in vivo. (A) Representative images (magnification, 4×) showing migration of pretreated QM PDAC tumor cells across 8-μm filters after 16 h following fixation and staining with crystal violet. Quantification of area covered by stained cells in 3 independent experiments (n = 3 to 5 per experiment) is shown for each cell line. **P < 0.01; ****P < 0.001. (B) Quantification of migration of E PDAC spheres using the same experimental design. (C) Representative images (magnification, 4×) of colonies grown in soft agar from single-cell suspension of QM PDAC cell-line tumorspheres pretreated with CalT for 5 d. Quantification of total colony area in 5 independent experiments (n = 3 per experiment) is shown. *P < 0.05. (D) Representative bioluminescent images of day 21 lung metastases in mice generated by injecting PDAC9 cells dissociated from spheroids pretreated with CalT or vehicle control into the tail vein of untreated mice. Scale representing photon flux in luminescence (A.U.). (E) Quantification of metastatic tumor burden in mice following tail-vein injection of PDAC9-dissociated tumorspheres pretreated with CalT or vehicle control. (F) Quantification of metastatic tumor burden in mice following tail-vein injection of QM PDAC3 dissociated tumorspheres pretreated with CalT or vehicle control. (G) Quantification of metastatic tumor burden in mice following tail-vein injection of E PDAC6 dissociated tumorspheres pretreated with CalT or vehicle control. (H) Induction of CYP24A1 and FN1 expression in response to CalT treatment in control (NT) and VDR-knockdown (VDR-KD) cell lines. Error bars represent SD. (I) Quantification of metastatic tumor burden in mice following tail-vein injection of VDR knockdown (PDAC9-VDRKD) or control PDAC9 (PDAC9-NT) dissociated tumorspheres pretreated with CalT. (J) Quantitation of metastases in explanted lungs from mice receiving VDR knockdown (PDAC9-VDRKD) or control PDAC9 (PDAC9-NT) dissociated tumorspheres pretreated with CalT on day of sacrifice. *P < 0.05. For E, G, and I, metastatic signal was determined by total photon flux in bioluminescent imaging performed weekly (P values determined by 2-way ANOVA).
Fig. 4.
Fig. 4.
High CYP24A1 expression in specific subtypes of human cancers is associated with shorter overall survival. (A) Expression heatmap depicting classification of human PDAC tumor samples from the TCGA database into 3 clinical subtypes based on validated gene signatures (2). (B) Kaplan–Meier survival curves for high (red) vs. low (blue) CYP24A1 expression in tumors within the E and QM subtypes. (C) Expression heatmap depicting classification of human PDAC tumor samples from the ICGC database into 3 clinical subtypes based on validated gene signatures (2). (D) Kaplan–Meier survival curves for high (red) vs. low (blue) CYP24A1 expression in tumors within the E and QM subtypes from the ICGC dataset. (E) Representative images of human PDAC tumors with dual-color RNA-ISH stained for CYP24A1 (red) and FN1 (blue) showing expression of CYP24A1 in tumor cells (black arrowheads, Bottom Left). Higher power image showing coexpression of CYP24A1 and FN1 in a subset of tumor cells (black arrows, Bottom Right). (F) Kaplan–Meier curves for high (red) vs. low (blue) CYP24A1 expression in adenocarcinoma (Left) and squamous cell (Right) NSCLC tumors. (G) Model depicting the heterogeneous and plastic molecular phenotype of PDAC tumors in terms of E vs. QM subtypes and the effects of FOLFIRINOX (FFX) chemotherapy and Vit D therapy on the position of a tumor on the continuum.

References

    1. Bailey P., et al. ; Australian Pancreatic Cancer Genome Initiative , Genomic analyses identify molecular subtypes of pancreatic cancer. Nature 531, 47–52 (2016). - PubMed
    1. Collisson E. A., et al. , Subtypes of pancreatic ductal adenocarcinoma and their differing responses to therapy. Nat. Med. 17, 500–503 (2011). - PMC - PubMed
    1. Moffitt R. A., et al. , Virtual microdissection identifies distinct tumor- and stroma-specific subtypes of pancreatic ductal adenocarcinoma. Nat. Genet. 47, 1168–1178 (2015). - PMC - PubMed
    1. Tiriac H., et al. , Organoid profiling identifies common responders to chemotherapy in pancreatic cancer. Cancer Discov. 8, 1112–1129 (2018). - PMC - PubMed
    1. Martinelli P., et al. , GATA6 regulates EMT and tumour dissemination, and is a marker of response to adjuvant chemotherapy in pancreatic cancer. Gut 66, 1665–1676 (2017). - PMC - PubMed