

Population Pharmacokinetics of Isoniazid, Pyrazinamide, and Ethambutol in Pregnant South African Women with Tuberculosis and HIV
- PMID: 31844002
- PMCID: PMC7038290
- DOI: 10.1128/AAC.01978-19
Population Pharmacokinetics of Isoniazid, Pyrazinamide, and Ethambutol in Pregnant South African Women with Tuberculosis and HIV
Abstract
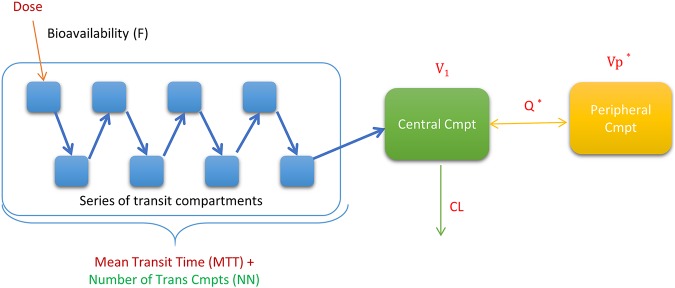
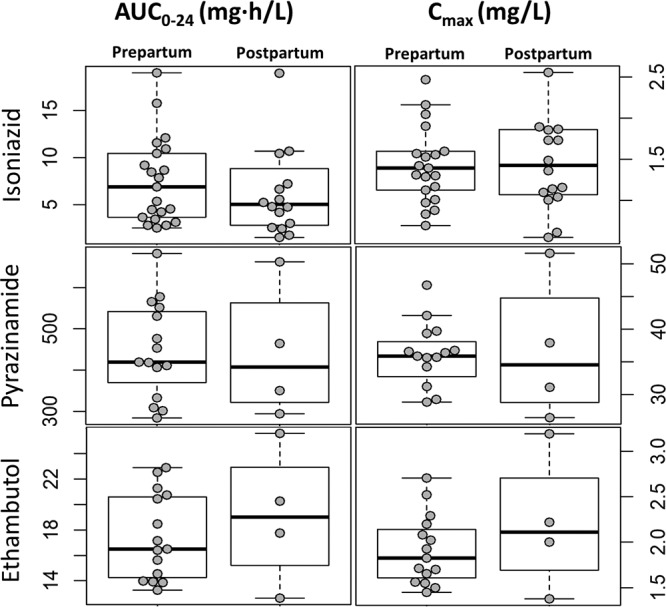
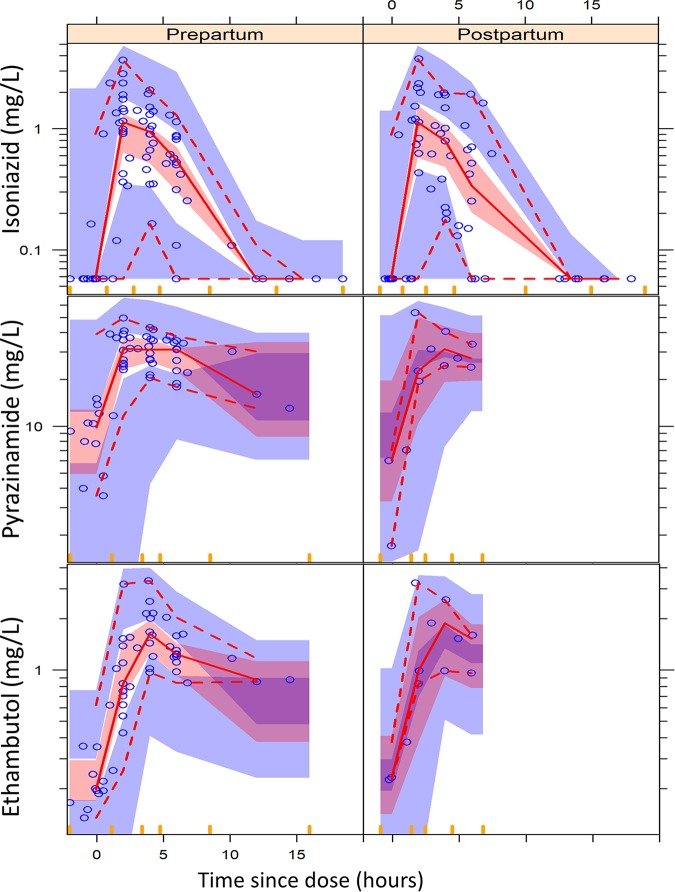
Tuberculosis is an important cause of maternal morbidity, but little is known about the effects of pregnancy on antituberculosis drug concentrations. We developed population pharmacokinetic models to describe drug dispositions of isoniazid, pyrazinamide, and ethambutol in pregnant women with tuberculosis and HIV. HIV-positive pregnant women with tuberculosis receiving standard first-line tuberculosis treatment and participating in Tshepiso, a prospective cohort study in Soweto, South Africa, underwent sparse pharmacokinetic sampling at >36 weeks of gestation and 7 weeks postpartum. The effects of pregnancy on the pharmacokinetics of isoniazid, pyrazinamide, and ethambutol were investigated via population pharmacokinetic modeling. Isoniazid, pyrazinamide, and ethambutol concentrations were available for 29, 18, and 18 women, respectively. Their median weight was 66 kg while pregnant and 64 kg postpartum. No significant differences were observed in drug clearance, volume of distribution, or bioavailability during and after pregnancy. The model-estimated isoniazid, pyrazinamide, and ethambutol area under the concentration-time curve from 0 to 24 h (AUC0-24) medians were, respectively, 6.88, 419, and 16.5 mg · h/liter during pregnancy versus 5.01, 407, and 19.0 mg · h/liter postpartum. The model-estimated maximum concentration (Cmax) medians for isoniazid, pyrazinamide, and ethambutol were, respectively, 1.39, 35.9, and 1.82 mg/liter during pregnancy versus 1.43, 34.5, and 2.11 mg/liter postpartum. A posteriori power calculations determined that our analysis was powered 91.8%, 59.2%, and 90.1% at a P of <0.01 to detect a 40% decrease in the AUCs of isoniazid, pyrazinamide, and ethambutol, respectively. Pregnancy does not appear to cause relevant changes in the exposure to isoniazid, pyrazinamide, and ethambutol. Additional studies of antituberculosis drugs in pregnancy are needed.
Keywords: NAT2; NONMEM; modeling; pharmacometrics; pregnancy; simulation.
Copyright © 2020 American Society for Microbiology.
Figures
References
-
- Hoffmann CJ, Variava E, Rakgokong M, Masonoke K, van der Watt M, Chaisson RE, Martinson NA. 2013. High prevalence of pulmonary tuberculosis but low sensitivity of symptom screening among HIV-infected pregnant women in South Africa. PLoS One 8:e62211. doi:10.1371/journal.pone.0062211. - DOI - PMC - PubMed
-
- Pillay T, Sturm AW, Khan M, Adhikari M, Moodley J, Connolly C, Moodley D, Padayatchi N, Ramjee A, Coovadia HM, Sullivan JL. 2004. Vertical transmission of Mycobacterium tuberculosis in KwaZulu Natal: impact of HIV-1 co-infection. Int J Tuber Lung Dis 8:59–69. - PubMed
Publication types
MeSH terms
Substances
Grants and funding
LinkOut - more resources
Full Text Sources
Medical
