

doi: 10.1038/s41467-019-13418-5.
Classification of mouse B cell types using surfaceome proteotype maps
Affiliations
- PMID: 31844046
- PMCID: PMC6915781
- DOI: 10.1038/s41467-019-13418-5
Item in Clipboard
Classification of mouse B cell types using surfaceome proteotype maps
Nat Commun.
.
Abstract
System-wide quantification of the cell surface proteotype and identification of extracellular glycosylation sites is challenging when samples are limited. Here, we miniaturize and automate the previously described Cell Surface Capture (CSC) technology, increasing sensitivity, reproducibility and throughput. We use this technology, which we call autoCSC, to create population-specific surfaceome maps of developing mouse B cells and use targeted flow cytometry to uncover developmental cell subpopulations.
Conflict of interest statement
R.B. and L.R. are employees of Biognosys AG. Spectronaut is a trademark of Biognosys AG. All other authors declare no competing interests.
Figures

a Schematic illustration of the autoCSC workflow. b Box-plots showing identified N-glycopeptides and c quantification CVs (of precursors matching glycopeptides) of manual and automated (autoCSC) processing workflows. d Heatmap representation and e principal component analysis of quantified surfaceomes in 11 common cell lines. The center line of box-plots represents the median, box limits the upper and lower quartiles, whiskers the 1.5x interquartile range and dots any outlier data points.
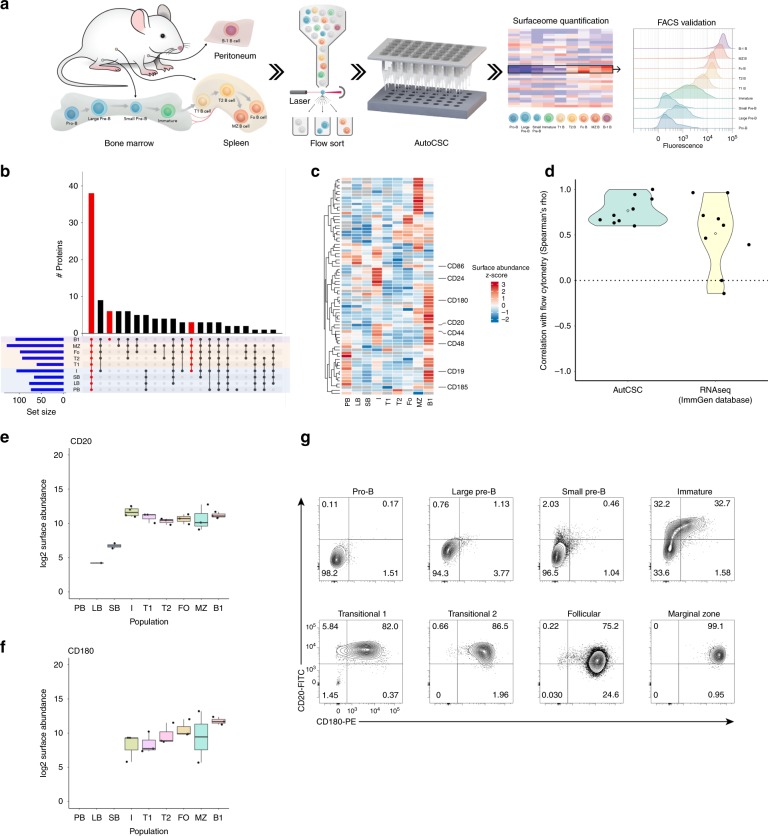
a Schematic illustration of the workflow used to phenotype B cell populations and identify subpopulations. b Quantified surface protein distribution of developing B cell populations visualised by upset plot. The bar chart on top visualises the number of proteins contained within each intersection as defined in the lower part. c Heatmap of z-score abundance values. Surface proteins used for subsequent flow cytometry analysis are indicated to the right. d Correlation analysis (spearman’s rho) comparing autoCSC and RNA-seq with flow cytometry. e, f Box-plots showing autoCSC obtained surface abundance values for (e) CD20 and (f) CD180 in B cell populations. The center line of box-plots represents the median, box limits the upper and lower quartiles, whiskers the 1.5x interquartile range and dots any outlier data points. g Flow cytometry distributions of CD20 and CD180 surface abundances during B cell development.

a The immature B population was further divided into three subpopulations defined by CD20 and CD180 fluorescence intensity: double negative (DN), positive for CD20 (SP), and positive for both (DP). b In-vitro differentiation of the defined immature B subpopulations during three days of culturing. c Fraction of IgD+ cells in immature B subpopulations. d Mean fluorescence intensity for BAFF receptor for the three immature B subpopulations. e Modulation of in vitro survival of subpopulations with BAFF treatment. f Principal component analysis of proteotype data reflects the identified immature B subpopulations. Error bars indicate standard deviation. Statistical analysis was done with two-tailed unpaired Student’s t test. One star indicates P < 0.01; four stars indicate P < 0.0001.
References
Publication types
MeSH terms
Substances
Grants and funding
LinkOut - more resources
Full Text Sources
Miscellaneous
