. 2019 Dec 16;10(1):5715.
doi: 10.1038/s41467-019-13582-8.

ProTargetMiner as a proteome signature library of anticancer molecules for functional discovery

Affiliations

ProTargetMiner as a proteome signature library of anticancer molecules for functional discovery

Amir Ata Saei et al. Nat Commun. .

Abstract

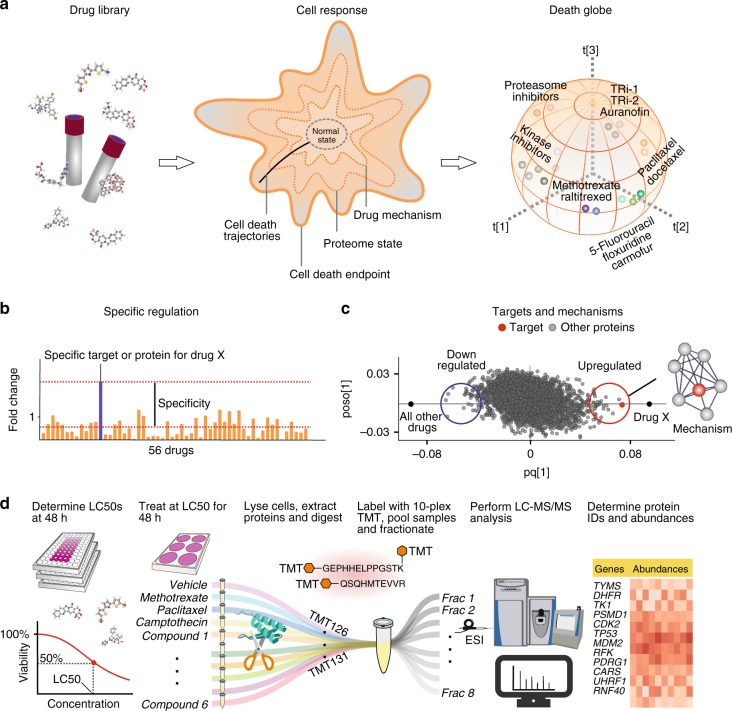
Deconvolution of targets and action mechanisms of anticancer compounds is fundamental in drug development. Here, we report on ProTargetMiner as a publicly available expandable proteome signature library of anticancer molecules in cancer cell lines. Based on 287 A549 adenocarcinoma proteomes affected by 56 compounds, the main dataset contains 7,328 proteins and 1,307,859 refined protein-drug pairs. These proteomic signatures cluster by compound targets and action mechanisms. The targets and mechanistic proteins are deconvoluted by partial least square modeling, provided through the website http://protargetminer.genexplain.com. For 9 molecules representing the most diverse mechanisms and the common cancer cell lines MCF-7, RKO and A549, deep proteome datasets are obtained. Combining data from the three cell lines highlights common drug targets and cell-specific differences. The database can be easily extended and merged with new compound signatures. ProTargetMiner serves as a chemical proteomics resource for the cancer research community, and can become a valuable tool in drug discovery.


Conflict of interest statement

B.Z. is currently an employee of AstraZeneca. Alexey Chernobrovkin is currently an employee of Pelago Bioscience AB. The other authors declare no potential conflicts of interest.

Figures

Fig. 1
Fig. 1
ProTargetMiner strategy and workflow. a an extensive proteome signature database of anticancer molecules will identify compounds with similar MOA in multidimensional space. b since the response of the target and mechanistic proteins to a compound is specific, c an OPLS-DA model contrasting the given compound with all other molecules in the database will identify the drug targets (red circles) and mechanistic proteins as specifically regulated proteins (among other proteins shown with gray circles). d workflow: determination of LC50 values for the library of compounds and selected cells; cell treatment with 56 compounds as well as vehicle-treated control and standard treatments (methotrexate, paclitaxel and camptothecin) in at least three biological replicates; lysis, digestion and labeling with TMT-10plex reagents; multiplexing the 10-plexed samples; fractionation of the pooled sample to increase the proteome coverage; analysis of individual fractions by LC-MS/MS; protein identification and relative quantification; data post-processing. The compound structures in panel a were taken from PubChem.
Fig. 2
Fig. 2
Hierarchical clustering of the proteome signatures by compounds and proteins. a compound clustering is largely consistent with their presumed MOAs (compound classes are denoted by colors). b top three most enriched gene ontology terms, representing either molecular function (MF), biological process (BP), or cellular component (CC). Cluster 9 that did not map to any specific GO term is omitted. ci radar plots showing the clusters targeted by representative compounds. The distance from the center is proportional to the mean logarithm of fold change, and inner circle represents zero regulation. Panel a was made from Supplementary Data 1. Source data are provided as a Source Data file.
Fig. 3
Fig. 3
OPLS-DA paradigm. a a generalized OPLS-DA model contrasting a given compound proteome signature against all others. b the OPLS-DA loading or score scatter plot demonstrating proteins most contributing to class separation.
Fig. 4
Fig. 4
ProTargetMiner reveals drug targets, action mechanisms, and affected cellular complexes. a OPLS-DA model for methotrexate. b variable influence on projection (VIP) values extracted from methotrexate OPLS-DA model. cf OPLS-DA models for four other representative compounds (drug targets and/or mechanistic proteins are shown in red and dark blue circles). The mechanistically relevant pathway enrichment for the 30 most specifically up- or down-regulated proteins: GO processes for paclitaxel - mitotic cell cycle (p < 9E-11) and microtubule-based process (p < 8E-8); vincristine - mitotic cell cycle (p < 1E-5) and microtubule cytoskeleton organization (p < 2E-4). Microtubule was the top enriched component for both paclitaxel and vincristine (p < 0.001). Proteasome complex (p < 4E-7) and NADH dehydrogenase complex (in red, p < 7E-21) were the top components enriched for bortezomib and sorafenib, respectively. Mitochondrial translation processes (in blue, p < 0.001) were also enriched in GO terms for sorafenib (selection of 30 top proteins in either side of x axis is empirical and leads to less redundancy in pathways). MRP = mitochondrial ribosomal proteins, ND = NADH dehydrogenase. g the regulation of tubulins in response to paclitaxel vs. control in comparison with all other compounds. h the regulation of tubulins in response to vincristine vs. control in comparison with all other compounds (Center line, median; box limits contain 50%; upper and lower quartiles, 75 and 25%; maximum, greatest value excluding outliers; minimum, least value excluding outliers; outliers, more than 1.5 times of upper and lower quartiles). i the regulation of PSMC4 in response to bortezomib vs. control in comparison with all other compounds. j the regulation of NDUFS6 in response to sorafenib vs. control in comparison with all other compounds. Data are represented as mean ± s.d. (n ≥ 3 biologically independent experiments). Panels a and cf were made from Supplementary Data 1). Source data are provided as a Source Data file.
Fig. 5
Fig. 5
Determination of the ProTargetMiner minimal size. Four compounds were contrasted against 50 random combinations of 1–54 compounds by PLS-DA modeling and the mean drug target ranking was calculated for each number. NDUFV2 and CARS2 proteins were randomly chosen as non-target proteins. Supplementary Data 1 was used for production of this figure.
Fig. 6
Fig. 6
Deeper ProTargetMiner dataset with 8 contrasting compounds is successful in target/MOA deconvolution. a OPLS-DA enabled deconvolution of multiple kinases as targets for dasatinib in three cell lines (drug targets shown in red circles). b deconvolution of DPP7 and DPP3 in MCF-7 and DPP3 in RKO cells. In A549 cells, these targets were not among the top 100 proteins. c identification of multiple targets for dasatinib in the merged dataset from three cell lines. d merging all cell lines shows that DPP3 is a common bortezomib target. Moreover, protein ubiquitination was the top GO term for 30 up-regulated proteins for bortezomib (11/30 proteins, p < 2E-06) in the merged dataset. e the specific down-regulation of DPP3 in response to bortezomib in MCF-7 cells. Data are represented as mean ± s.d. (n = 3 biologically independent experiments). Supplementary Data 4–7 were used for making panels ae. Source data are provided as a Source Data file.
Fig. 7
Fig. 7
The ProTargetMiner R Shiny package for deconvolution of drug target and MOA. a the ProTargetMiner R Shiny package interface. The input is the proteomics data for a desired compound and the output is the .CSV file containing the ranking of proteins for the compound against the desired panel in a PLS-DA model. Clicking on the interactive PLS-DA plot gives the attributes of the selected proteins, e.g. name, number of peptides, sequence coverage and significance compared to control, and will show the regulation of that protein in the compound panel. b step-by-step procedure of the use of ProTargetMiner R Shiny package. c the input .CSV template with the required columns.

References

    1. Moffat JG, Vincent F, Lee JA, Eder J, Prunotto M. Opportunities and challenges in phenotypic drug discovery: an industry perspective. Nat. Rev. Drug Discov. 2017;16:531. doi: 10.1038/nrd.2017.111. - DOI - PubMed
    1. Hughes TR, et al. Functional discovery via a compendium of expression profiles. Cell. 2000;102:109–126. doi: 10.1016/S0092-8674(00)00015-5. - DOI - PubMed
    1. Lamb J, et al. The Connectivity Map: using gene-expression signatures to connect small molecules, genes, and disease. Science. 2006;313:1929–1935. doi: 10.1126/science.1132939. - DOI - PubMed
    1. Subramanian A, et al. A next generation connectivity map: L1000 platform and the first 1,000,000 profiles. Cell. 2017;171:1437–1452. e1417. doi: 10.1016/j.cell.2017.10.049. - DOI - PMC - PubMed
    1. Rees MG, et al. Correlating chemical sensitivity and basal gene expression reveals mechanism of action. Nat. Chem. Biol. 2016;12:109. doi: 10.1038/nchembio.1986. - DOI - PMC - PubMed

Publication types