. 2019 Dec 16;10(1):5716.
doi: 10.1038/s41467-019-13665-6.

PSPC1-interchanged interactions with PTK6 and β-catenin synergize oncogenic subcellular translocations and tumor progression

Affiliations

PSPC1-interchanged interactions with PTK6 and β-catenin synergize oncogenic subcellular translocations and tumor progression

Yaw-Dong Lang et al. Nat Commun. .

Abstract

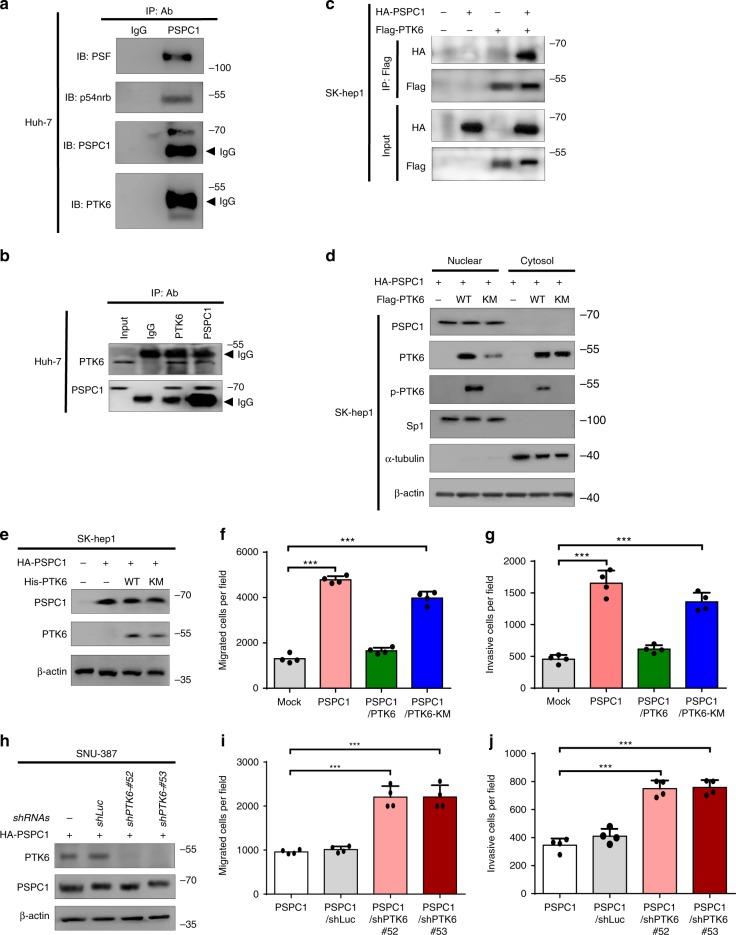
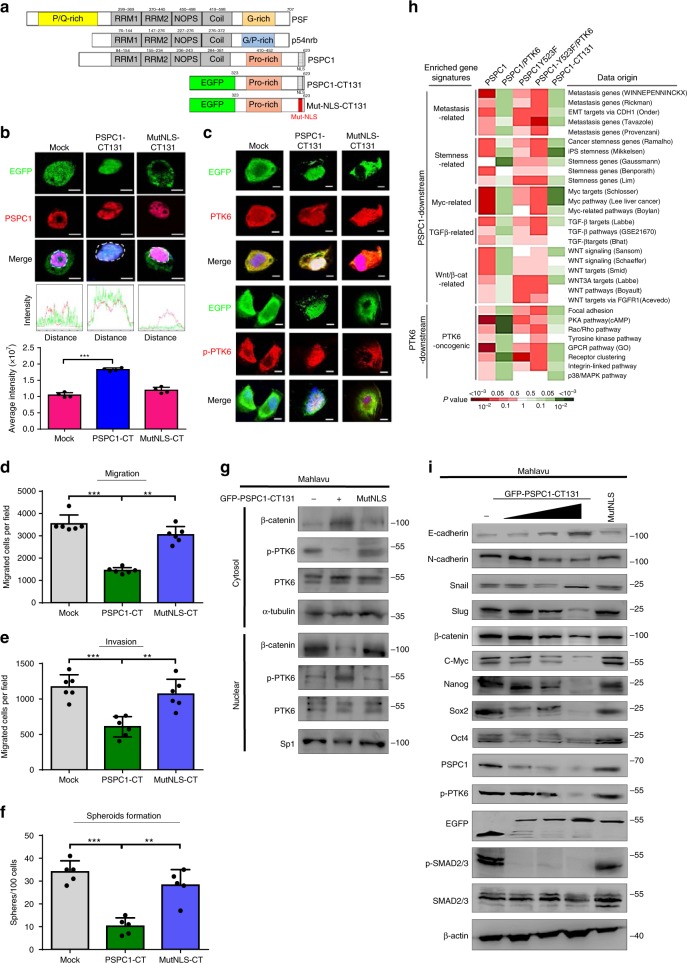
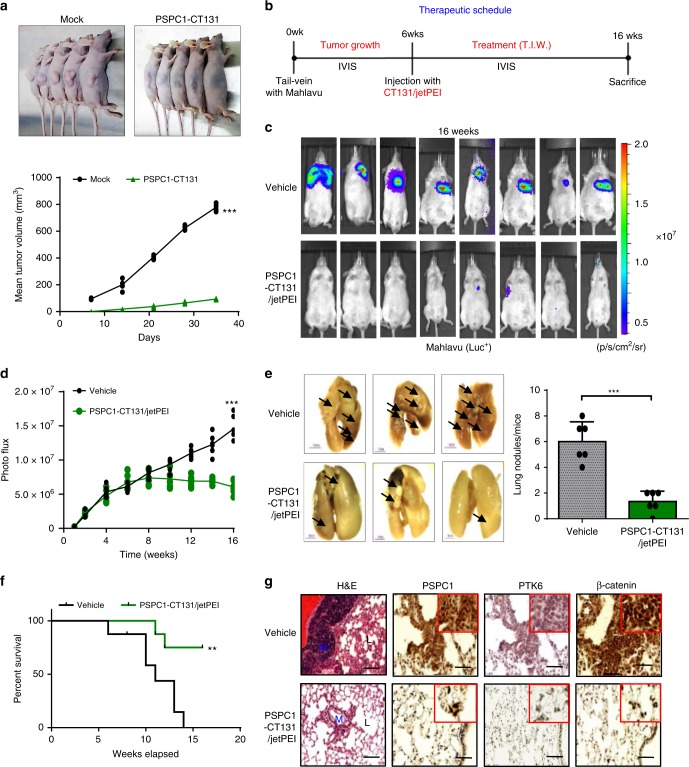
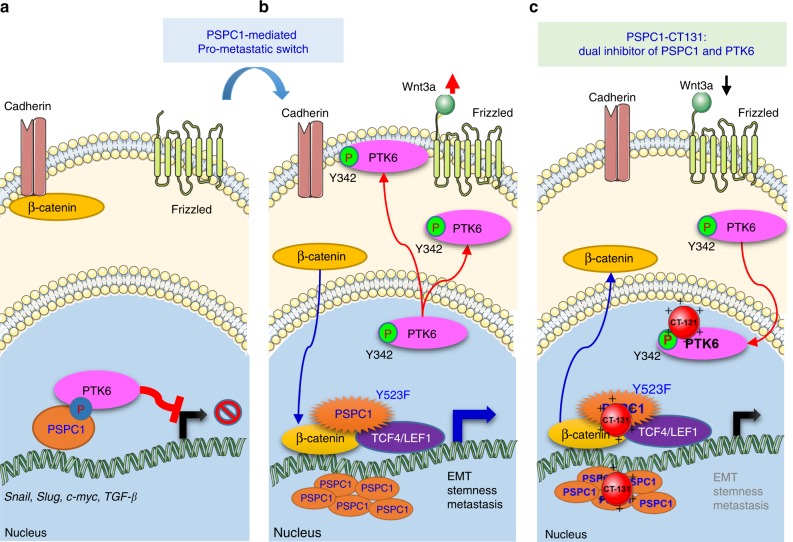
Hepatocellular carcinoma (HCC) is one of the most lethal cancers worldwide due to metastasis. Paraspeckle component 1 (PSPC1) upregulation has been identified as an HCC pro-metastatic activator associated with poor patient prognosis, but with a lack of targeting strategy. Here, we report that PSPC1, a nuclear substrate of PTK6, sequesters PTK6 in the nucleus and loses its metastasis driving capability. Conversely, PSPC1 upregulation or PSPC1-Y523F mutation promotes epithelial-mesenchymal transition, stemness, and metastasis via cytoplasmic translocation of active PTK6 and nuclear translocation of β-catenin, which interacts with PSPC1 to augment Wnt3a autocrine signaling. The aberrant nucleocytoplasmic shuttling of active PTK6/β-catenin is reversed by expressing the PSPC1 C-terminal interacting domain (PSPC1-CT131), thereby suppressing PSPC1/PTK6/β-catenin-activated metastasis to prolong the survival of HCC orthotopic mice. Thus, PSPC1 is the contextual determinant of the oncogenic switch of PTK6/β-catenin subcellular localizations, and PSPC1-CT131 functions as a dual inhibitor of PSPC1 and PTK6 with potential for improving cancer therapy.


Conflict of interest statement

The authors declare no competing interests.

Figures

Fig. 1
Fig. 1. PSPC1 interacts with nuclear tumor suppressive PTK6 to inhibit tumor progression.
a The PSPC1 immunoprecipitated (IP) complex of Huh-7 cells lysates with anti-PSPC1 antibody analyzed by Western blotting (IB) with the indicated antibodies (IP/Western). b Endogenous PSPC1 and PTK6 interaction analyzed by IP/Western blotting analysis in Huh-7 cells. Preimmune IgG is the control, and the arrowhead is the IgG heavy chain. c Interaction of PSPC1 with PTK6 by ectopic expression of HA-tagged PSPC1 and/or Flag-tagged PTK6 protein in SK-hep1 cells by IP/Western analysis. d Subcellular distribution of wild-type (WT) and kinase-dead (KM) mutant of flag-tagged PTK6 in SK-hep1 cells expressing HA-tagged PSPC1 determined by Western blotting analysis. Sp1 and α-tubulin were used as internal controls for nuclear and cytoplasmic fractions, respectively. eg PTK6 suppresses PSPC1-enhanced cell motility in a phosphorylation-dependent manner. The expression levels of HA-tagged PSPC1, His-tagged PTK6 wild-type (WT) or kinase dead (KM) mutant in SK-hep1 cells analyzed by Western blotting analysis (e). Expression of PTK6, but not KM mutant of PTK6, suppressed PSPC1-mediated cell migration (f) and invasion (g) in SK-hep1. Data are represented as mean ± SEM (n = 4). hj PTK6 suppresses PSPC1-enhanced cell motility reversed by PTK6 knockdown. PTK6 knockdown efficiency of shRNAs (shRNA#52 and shRNA#53) and Western blotting analysis in SNU-387 cells expressing HA-tagged PSPC1 (h). PTK6 knockdown increased cell migration (i) and invasion (j) in SNU-387 cells. shLuc is a control shRNA targeting luciferase. Data are represented as mean ± SEM (n = 4). All data statistics based on: *p < 0.05, **p < 0.01, ***p < 0.001 by one-way ANOVA with Brown–Forsythe test. Source data are provided as a Source Data file.
Fig. 2
Fig. 2. PSPC1 or PSPC1-Y523F releases PTK6 to synergize the oncogenic effects.
a The PSPC1-Y523F but not PSPC1-Y383F mutation abolished the PSPC1/PTK6 interaction demonstrated by IP/Western blotting analysis. (Top) A cartoon illustrates domain structures and tyrosine residues Y383 (Red) and Y523 (Blue) in the C-terminal PSPC1 protein. b, c PTK6 suppressed the PSPC1-enhanced cell migration (b), invasion (c), in SK-hep1 cells. Mutation of PSPC1-Y523F but not Y383F abolished the PSPC1-enhanced cell migration and invasion. Data are represented as mean ± SEM (n = 4). d, e SNU-387 expressed a higher level of PTK6 could to some extent reduce PSPC1 and the PSPC1-Y383F-enhanced cell migration (d), invasion (e), but not that of PSPC1-Y523F (loss of PTK6 interaction ability). Data are represented as mean ± SEM (n = 4). f Immunofluorescence for the detection of subcellular localizations of PSPC1, p-PTK6, and PTK6 in SK-Hep1. Colors for p-PTK6 as well as PTK6, PSPC1, and DAPI are red, green, and blue, respectively. The scale bar represents 10 µm. g Western blotting analysis of EMT and cancer stemness markers in SK-hep1 cells expressing PSPC1, PSPC1-Y523F, and PTK6. h Western blotting analysis of EMT and cancer stemness markers in SNU-387 cells expressing PSPC1, PSPC1-Y523F. i Spheroids formation in different PSPC1/PTK6 SK-hep1 transfectants including phase images (Top) and graphic quantifications after two passages of spheroids (bottom). Data are represented as mean ± SEM (n = 6). j SNU387 cells expressing higher level of PTK6 could reduce PSPC1-mediated spheroids formation, but cells expressing PSPC1-Y523F could not. Data are represented as mean ± SEM (n = 6). PTK6 suppressed PSPC1-enhanced cell spheroids formation in SK-hep1 cells. The PSPC1-Y523F mutation but not Y383F potentiated spheroids formation with series dilutions for 20 days cultures. Co-expression of PSPC1-Y523F and PTK6 in SK-hep1 cells synergized oncogenic spheroid formation. All data statistics based on *p < 0.05, **p < 0.01 ***p < 0.001 calculated by one-way ANOVA with Brown–Forsythe test. Source data are provided as a Source Data file.
Fig. 3
Fig. 3. PSPC1 modulates Wnt signaling and Wnt3a autocrine function.
a HGF (10 ng/ml) treatment of Huh-7 cells as an EMT induction model upregulates PSPC1 and facilitates reciprocal subcellular translocations of p-PTK6 and β-catenin. The expression of Sp1, α-tubulin and Na+/K+-ATPase, markers of nuclear, cytosolic and membrane localization, respectively. b Under HGF stimulation, nuclear PSPC1 interacted with β-catenin and not PTK6 owing to increased cytosolic and membrane active PTK6 expression shown by IP/Western blotting analysis. Arrows indicate proteins after IB. Arrowheads are the IgG heavy chain. c Expression of PSPC1-Y523F mutant in SK-hep1 cells decreased nuclear p-PTK6 sequestration to facilitate cytoplasmic and membrane p-PTK6 translocation and facilitate nuclear translocation of β-catenin demonstrated by Western blotting analysis. d, e Expression of PSPC1-Y523F mutant reduced the p-PTK6 nuclear sequestration and enhanced PSPC1-Y523F interaction with nuclear β-catenin demonstrated by IP/Western blotting analysis in SK-hep1 cells. f Relative transcriptional activity of TOP-Flash and FOP-Flash with TCF4/LEF1 luciferase reporter assays in 293T cells cotransfected with mock control, PSPC1, Wnt3a, β-catenin del-N (deletion of N-terminus), PSPC1 shRNA (shPSPC1)/β-catenin del-N, and PSPC1/TCF4-DN (dominant negative). Data represent the mean ± SEM (n = 3). g Relative transcriptional activation of TCF4/LEF1 luciferase promoter reporter assays with TOP-Flash or FOP-Flash expressing SK-hep1 cells transfected with vector alone (Mock), PSPC1, PSPC1/PTK6, PSPC1-Y523F and PSPC1-Y523F/PTK6 constructs. Data represent the mean ± SEM (n = 3). h Secreted cytokines Wnt1 and Wnt3a measured by ELISA assays in the concentrated conditioned medium of SK-hep1 cells transfected with different PSPC1/PTK6 expression constructs. Data represent the mean ± SEM (n = 3). All data statistics were based on *p < 0.05, **p < 0.01, and ***p < 0.001 calculated by one-way ANOVA with Brown–Forsythe test. Source data are provided as a Source Data file.
Fig. 4
Fig. 4. The PSPC1/PTK6/β-catenin axis is critical for tumor growth and metastasis in HCC.
af Effects on tumorigenesis (abdominal view for measuring liver tumors) (a, b) and metastasis (dorsal view for measuring lung metastatic tumors) (c, d) of the PSPC1/PTK6 interaction and PSPC1-Y523F mutant in orthotopic mouse HCC model generated by SK-hep1 transfectants bearing luciferase expression constructs. The effects were measured by representative bioluminescence images (a, c), intensity of photon flux representative of tumor size at 20 weeks (b, d), and numbers of nodules in tumors at 20 weeks (e, f). Data represent the mean ± SEM (n = 6/group). The PSPC1-Y523F mutant further enhanced tumorigenesis and metastasis in comparison with PSPC1 transfectants. All data statistics were based on *p < 0.05, **p < 0.01, and ***p < 0.001 calculated by one-way ANOVA with Bartlett’s test. g, h Representative images of livers and lungs showing tumorigenesis and metastasis (top panels) and hematoxylin and eosin-stained images of tumors from liver (g) or lung (h) isolated from representative mice, respectively. Red circles indicate locations of primary tumor nodules; red arrows indicate lung metastasis nodules; T, tumor; L, lung; M, metastasis. The scale bar represents 100 µm. Source data are provided as a Source Data file.
Fig. 5
Fig. 5. Phospho-Y523 PSPC1 is associated with better prognosis of HCC.
a Representative IHC staining results of PSPC1, PSPC1-pY523, PTK6, and Wnt3a expression in stage I (left panels) and stage IV (right panels) human HCC tissues. A large red tangle shows the enlargement areas is placed on the top right corner of each IHC image. The scale bar represents 50 µm. be Expression percentage of PSPC1 (red color for higher expression), phosphorylated Y523 PSPC1 in the nucleus (green color for higher expression), nuclear PTK6 (pink color for higher expression) and Wnt3a (purple color for higher expression) staining in early (I and II) and late stage (III and IV) tumors in human HCC tissues. Data are shown as the mean percentage of samples, n = 215. f The relationship between PSPC1 expression and the expression of PSPC1 phospho-Y523 and nuclear PTK6 in human HCC tissues. g, h Kaplan–Meier plot analysis of the overall survival of 215 HCC patients based on low or high expression levels of PSPC1-pY523 (g) and nuclear PTK6 (h). The p value was determined by the Gehan–Breslow–Wilcoxon test. Source data are provided as a Source Data file.
Fig. 6
Fig. 6. The PSPC1-CT131 is a dual inhibitor of oncogenic PSPC1 and PTK6.
a A cartoon of the primary domain structures of aligned DBHS family proteins with PSPC1-CT131 and Mut-NLS-CT131 (nuclear localization sequence (NLS) mutation of PSPC1-CT-131). b Top: PSPC1-CT131, but not Mut-NLS-CT131, colocalized with PSPC1 in the nucleus in Mahlavu cells shown by IF images. Middle: the line graphics of colocalization of PSPC1 (red) and EGFP-PSPC1-CT131 (green). Bottom: summary of merged color intensities of EGFP, EGFP-PSPC1-CT131, and EGFP-Mut-NLS-CT131 (green) with PSPC1 (red) and DAPI (blue for DNA) expressed in Mahlavu cells. The merged color intensities were calculated based on areas marked with dashed circles and confocal immunofluorescence analysis of data representing the mean ± SEM (n = 4). The scale bar represents 10 µm. c PSPC1-CT131 but not Mut-NLS-CT131 sequestered the active form of p-PTK6 in the nucleus of Mahlavu cells demonstrated by IF analysis. Colors are active PTK6 (p-PTK6) and PTK6 in red, EGFP for PSPC1-CT131 and Mut-NLS-CT131 in green, and nuclei stained with DAPI in blue. The scale bar represents 10 µm. df Cell migration (d), invasion (e), and spheroid formation (f). Data represent the mean ± SEM (n = 6). All data statistics were based on *p < 0.05, **p < 0.01, and ***p < 0.001 calculated by one-way ANOVA with Brown–Forsythe test. g Expression of PSPC1-CT131 but not Mut-NLS-CT131 altered the subcellular localization of PTK6, p-PTK6, and β-catenin determined by Western blotting analysis in Mahlavu cells. h Comparison of statistical significance based on the expression intensity of PSPC1 and PTK6 downstream genes in gene set enrichment signatures after transcriptome analysis (GSE114856) of indicated proteins in SK-hep1 cells and PSPC1-CT131 in Mahlavu cells in heatmap displays. Red and green colors indicate upregulation and downregulation of matched gene sets, respectively. The deeper the color, the lower the P-value, as shown in the scale bar. i Western blotting analysis indicated that the expression of EGFP-PSPC1-CT131 induced the upregulation of E-cadherin but decreased the expression of N-cadherin, Snail, Slug, Nanog, Oct4, p-PTK6, β-catenin, C-myc, PSPC1, and p-Smad2/3 in a dose-dependent manner. Source data are provided as a Source Data file.
Fig. 7
Fig. 7. PSPC1-CT131 targeting of PSPC1 and PTK6 reduces metastasis in HCC.
a Representative images of nude mice (top) and the tumor growth curves (bottom) in nude mice injected with parental and PSPC1-CT131-overexpressing Mahlavu cells. Tumor volumes at 6 weeks post injection are presented as the mean ± SEM (n = 5/group). Data statistics were based on *p < 0.05, **p < 0.01, and ***p < 0.001 calculated by ordinary two-way ANOVA with post hoc Tukey’s test compared to the mock control. b Time flowchart of the therapeutic schedule of tail vein injections of PSPC1-CT131/jetPEI® into mice carrying tail vein injected Mahlavu cells. c Representative bioluminescence images of experiments in (b). df Injection of PSPC1-CT131 plasmid packaged in vivo with jetPEI® not only reduced lung metastasis (d, e) but also prolonged mouse survival (f) in the tail vein injected lung metastasis model (n = 8/groups). Data statistics were based on *p < 0.05, **p < 0.01, and ***p < 0.001 calculated by Log-rank test compared to vehicle control. g Validated expressions of the PSPC1/PTK6/β-catenin axis by IHC staining of lung tumors after the administration of PSPC1-CT131 in a mouse lung metastasis model. Red squares on the top right corner of each IHC image stand for enlargement of stained tissues. The scale bar represents 100 µm. Source data are provided as a Source Data file.
Fig. 8
Fig. 8. Hypothetical models of the PSPC1/PTK6 interaction modulating Wnt/β-catenin autocrine signaling and PSPC1-CT131 as a dual inhibitor of PSPC1 and PTK6 suppressing downstream oncogenic signaling.
a PTK6 suppressed PSPC1 oncogenic features by phosphorylation and interaction on Y523 of PSPC1 and was sequestered in the nucleus as a tumor suppressor. b PSPC1 upregulation or mutation of the PTK6 phosphorylation site PSPC1-Y523F augmented Wnt3a autocrine signaling to facilitate β-catenin nuclear and p-PTK6 cytoplasmic/membrane translocations to synergize the oncogenic signaling of both PSPC1 and PTK6, which facilitated EMT, stemness and metastasis. c Treatment of PSPC1-CT131 as a dual inhibitor of PSPC1 and PTK6 reduced the expression of both oncogenic PSPC1 and PTK6 to suppress HCC tumor progression. Overall, PSPC1-CT131, a dual inhibitor of PTK6 tyrosine kinase and PSPC1 pro-metastatic master activator, is a potent anticancer agent that prolongs the survival of mice in an HCC mouse model.

Similar articles

Cited by

References

    1. Massague J, Obenauf AC. Metastatic colonization by circulating tumour cells. Nature. 2016;529:298–306. doi: 10.1038/nature17038. - DOI - PMC - PubMed
    1. Fidler IJ. The pathogenesis of cancer metastasis: the ‘seed and soil’ hypothesis revisited. Nat. Rev. Cancer. 2003;3:453–458. doi: 10.1038/nrc1098. - DOI - PubMed
    1. Lambert AW, Pattabiraman DR, Weinberg RA. Emerging biological principles of metastasis. Cell. 2017;168:670–691. doi: 10.1016/j.cell.2016.11.037. - DOI - PMC - PubMed
    1. Yeh H-W, et al. PSPC1 mediates TGF-β1 autocrine signalling and Smad2/3 target switching to promote EMT, stemness and metastasis. Nat. Cell Biol. 2018;20:479–491. doi: 10.1038/s41556-018-0062-y. - DOI - PubMed
    1. Yeh HW, Lee SS, Chang CY, Lang YD, Jou YS. A new switch for TGFbeta in cancer. Cancer Res. 2019;79:3797–3805. doi: 10.1158/0008-5472.CAN-18-2019. - DOI - PubMed

Publication types

MeSH terms