. 2019 Dec 16;10(1):5738.
doi: 10.1038/s41467-019-13632-1.

Task complexity interacts with state-space uncertainty in the arbitration between model-based and model-free learning

Affiliations

Task complexity interacts with state-space uncertainty in the arbitration between model-based and model-free learning

Dongjae Kim et al. Nat Commun. .

Abstract

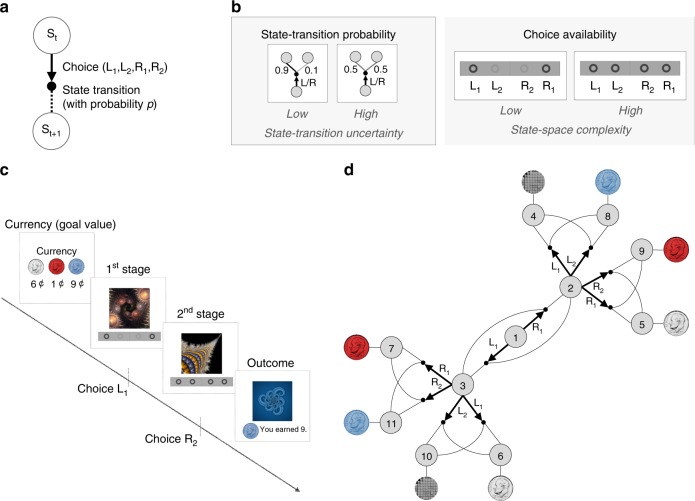
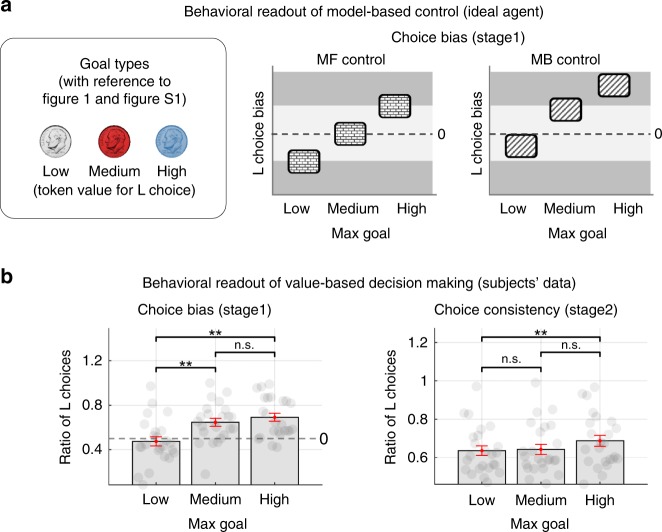
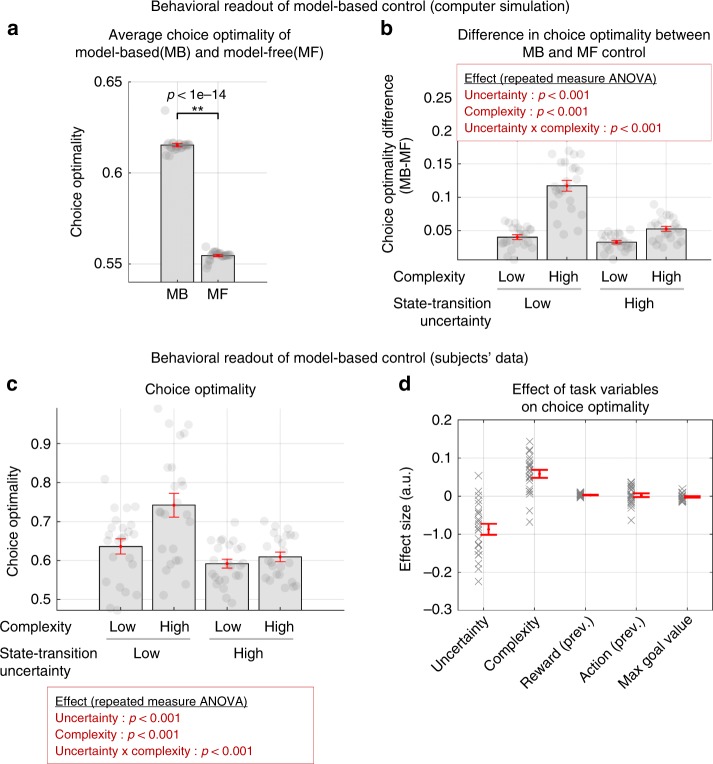
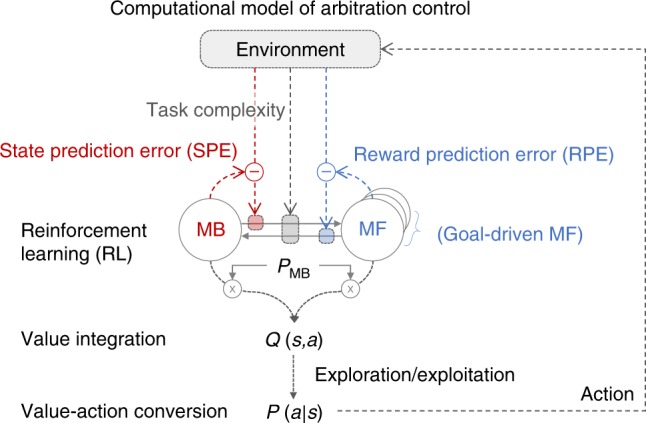
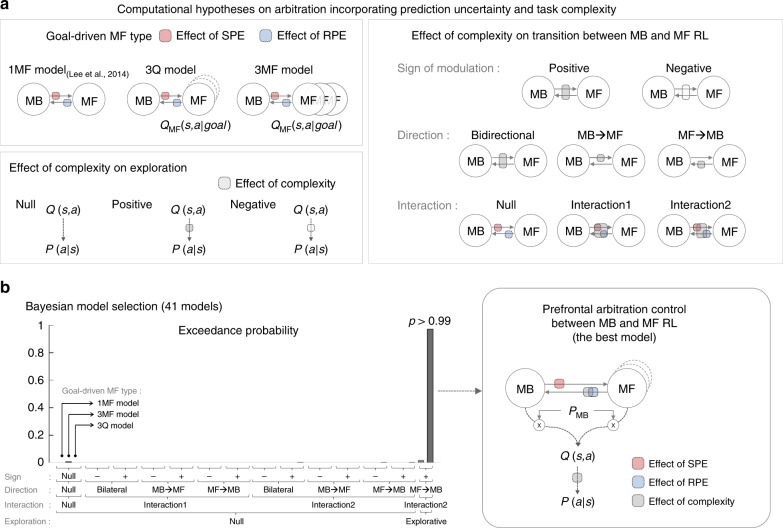
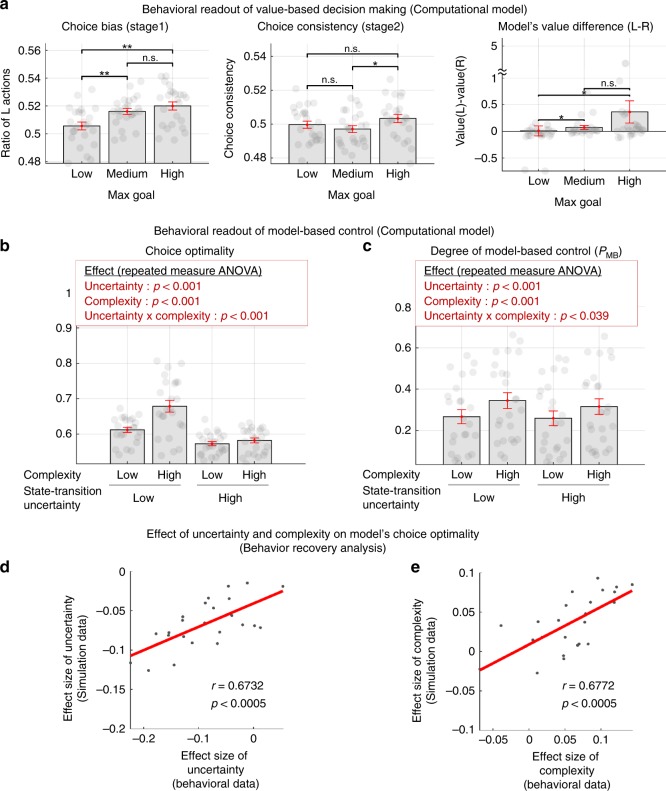
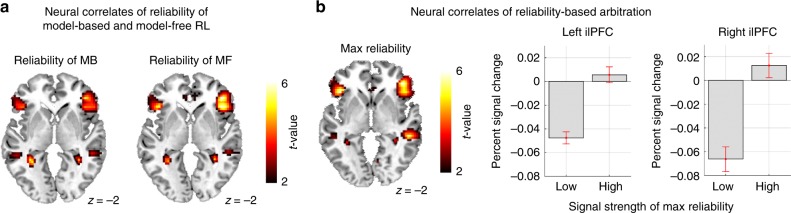
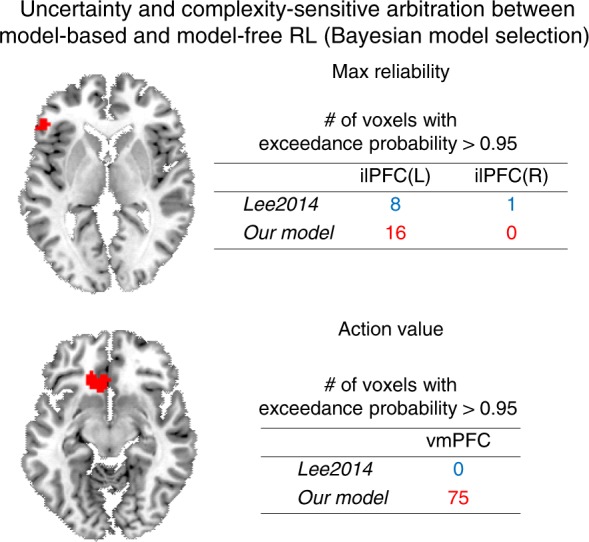
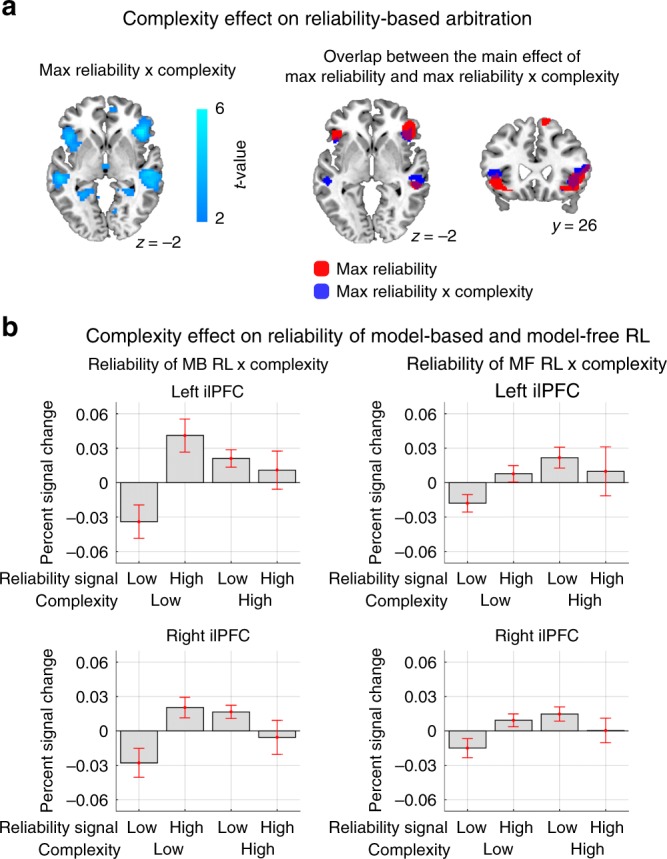
It has previously been shown that the relative reliability of model-based and model-free reinforcement-learning (RL) systems plays a role in the allocation of behavioral control between them. However, the role of task complexity in the arbitration between these two strategies remains largely unknown. Here, using a combination of novel task design, computational modelling, and model-based fMRI analysis, we examined the role of task complexity alongside state-space uncertainty in the arbitration process. Participants tended to increase model-based RL control in response to increasing task complexity. However, they resorted to model-free RL when both uncertainty and task complexity were high, suggesting that these two variables interact during the arbitration process. Computational fMRI revealed that task complexity interacts with neural representations of the reliability of the two systems in the inferior prefrontal cortex.


Conflict of interest statement

The authors declare no competing interests.

Figures

Fig. 1
Fig. 1. Task design.
a Two-stage Markov decision task. Participants choose between two to four options, followed by a transition according to a certain state-transition probability p, resulting in participants moving from one state to the other. The probability of successful transitions to a desired state is proportional to the estimation accuracy of the state-transition probability, and it is constrained by the entropy of the true probability distribution of the state-transition. For example, the probability of a successful transition to a desired state cannot exceed 0.5 if p=(0.5, 0.5) (the highest entropy case). b Illustration of experimental conditions. (Left box) A low and high state-transition uncertainty condition corresponds to the state-transition probability p = (0.9, 0.1) and (0.5, 0.5), respectively. (Right box) The low and high state-space complexity condition corresponds to the case where two and four choices are available, respectively. In the first state, only two choices are always available, in the following state, two or four options are available depending on the complexity condition. c Participants make two sequential choices in order to obtain different colored tokens (silver, blue, and red) whose values change over trials. On each trial, participants are informed of the “currency”, i.e. the current values of each token. In each of the subsequent two states (represented by fractal images), they make a choice by pressing one of available buttons (L1, L2, R1, R2). Choice availability information is shown at the bottom of the screen; bold and light gray circles indicate available and unavailable choices, respectively. d Illustration of the task. Each gray circle indicates a state. Bold arrows and lines indicate participants’ choices and subsequent state-transition according to the state-transition probability, respectively. Each outcome state (state 4–11) is associated with a reward (colored tokens or no token represented by a gray mosaic image). The reward probability is 0.8.
Fig. 2
Fig. 2. Behavioral results—choice bias and choice consistency.
a Predicted choice bias patterns of model-free (MF) and model-based (MB) control, calculated for the three goal conditions defined as the trials according to which coin has the maximum monetary outcome value (low, medium, and high token value for the L choice). Owing to the asymmetric association between outcome states and coin types (For full details, see Supplementary Methods—Choice bias), participants would exhibit distinct choice bias patterns for each goal condition that distinguishes model-based from model-free control; the MF control agent would exhibit a balanced choice bias pattern, whereas the MB control agent would show a slight left bias pattern. For full details of this measure, refer to Supplementary Methods—Behavioral measure. b Participants’ choice bias and choice consistency, conventional behavioral markers indicating reward-based learning. Error bars are SEM across subjects. The prediction about the choice bias matches subjects’ actual choice bias (the left of the below figure). In particular, the data show a clear left bias pattern, rejecting the null hypothesis that subjects used a pure model-free control strategy. This bias is also reflected in choice consistency (the right plot). These results also indicate that participants’ choice behavior is guided by reward-based learning more generally.
Fig. 3
Fig. 3. Behavioral results— choice optimality.
a Choice optimality (a proxy for assessing the degree of agents’ engagement in model-based control) of a model-based and model-free RL agent. Each MB and MF model simulation (that generates each one of the data points) was produced using free parameters derived from separate fits of each of these models to each individual participant’s behavioral data in the study. Choice optimality depicts the degree of match between agents’ actual choices and an ideal agent’s choice corrected for the number of available options. For full details of this measure, refer to Methods. b Difference in choice optimality between an MB and MF agent for the four experimental conditions (low/high state-transition uncertainty × low/high-task complexity). Shown in red boxes are the effect of the two experimental variables on each measure (two-way repeated measures ANOVA). c Participants’ choice optimality for the four experimental conditions. Shown in red boxes are the effect of the two experimental variables on each measure (two-way repeated measures ANOVA; also see Supplementary Table 3 for full details). d Results of a general linear model analysis (dependent variable: choice optimality, independent variables: uncertainty, complexity, reward values, choices in the previous trial, and goal values). Uncertainty and complexity, the two key experimental variables in our task, significantly influence choice optimality (paired t-test; p < 0.001). Error bars are SEM across subjects.
Fig. 4
Fig. 4. Computational model of arbitration control incorporating uncertainty and complexity.
The circle-and-arrow illustration depicts a two-state dynamic transition model, in which the current state depends on the previous state (an endogenous variable) and input from the environment (exogenous variables). The environmental input includes the state-transition which elicits state-prediction errors (SPEs), rewards that elicit reward-prediction error (RPEs), and the task complexity. The arrow refers to the transition rate from MB to MF RL or vice versa, which is a function of SPE, RPE, and task complexity. The circle refers to the state, defined as the probability of choosing MB RL (PMB). Q(s,a) refers to the values of the currently available actions (a) in the current state (s). The value is then translated into action, indicated by the action choice probability P(a|s).
Fig. 5
Fig. 5
Model comparison analysis on behavioral data. a We ran a large-scale Bayesian model selection analysis to compare different versions of arbitration control. These model variants were broadly classified as reflecting the effect of complexity on the transition between MB and MF RL (13 = 1 + 2 × 2 × 3 types), the effect of complexity on exploration (3 variants), and the form of the MF controller (3 variants) each of which is classified by a type of goal-driven MF (3 types), an effect of complexity on transition between MB and MF RL, and an effect of complexity on exploration (3 types). Lee2014 refers to the original arbitration model. b Results of the Bayesian model selection analysis. Among a total of 117 versions, we show only 41 major cases for simplicity, including the original arbitration model and 40 other different versions that show non-trivial performance (but the same result holds if running the full model comparison across the 117 versions). The model that best accounts for behavior is the version {3Q model, interaction type2, excitatory modulation on MF→MB, explorative} (exceedance probability >0.99; model parameter values and distributions are shown in Supplementary Table 1 and Supplementary Fig. 3, respectively).
Fig. 6
Fig. 6. Computational model fitting results.
a Choice bias (left), choice consistency (middle), and the average value difference (right) of our computational model of arbitration control (Fig. 5b). For this, we ran a deterministic simulation in which the best-fitting version of the arbitration model, using parameters obtained from fitting to participants behavior, experiences exactly the same episode of events as each individual subject, and we generated the trial-by-trial outputs. The max goal conditions are defined in the same way as in the Fig. 2a. Error bars are SEM across subjects. Note that both the choice bias and choice consistency patterns of the model (the left and the middle plot) are fully consistent with the behavioral results (Fig. 2b). Second, the values difference (left–right choice) of the model is also consistent with this finding (the right plot), suggesting that these behavioral patterns are originated from value learning. In summary, our computational model encapsulates the essence of subjects’ choice behavior guided by reward-based learning. b Patterns of choice optimality generated by the best-fitting model, using parameters obtained from fitting to participants behavior. For this, the model was run on the task (1000 times), and we computed choice optimality measures in the same way as in Fig. 3. c Degree of engagement of model-based control predicted by the computational model, based on the model fits to individual participants. PMB corresponds to the weights allocated to the MB strategy. Shown in the red box are the effect of the two experimental variables on each measure (two-way repeated measures ANOVA; also see Supplementary Table 4 for full details). Error bars are SEM across subjects. d, e Behavioral effect recovery analysis. The individual effect sizes of uncertainty (d) and complexity (e) on choice optimality of subjects (true data) were compared with those of our computational model (simulated data).
Fig. 7
Fig. 7. Neural signatures of model-free and model-based RL and arbitration control.
a Bilateral ilPFC encodes reliability signals for both the MB and the MF systems. Note that the two signals are not highly correlated (absolute mean correlation <0.3); this task design was previously shown to successfully dissociate the two types of RL. Threshold is set at p < 0.005. b (Left) Inferior lateral prefrontal cortex bilaterally encodes reliability information on each trial of both MB and MF RL, as well as whichever strategy that provides more accurate predictions (“max reliability”). (Right) The mean percent signal change for a parametric modulator encoding a max reliability signal in the inferior lateral prefrontal cortex (lPFC). The signal has been split into two equal-sized bins according to the 50th and 100th percentile. The error bars are SEM across subjects.
Fig. 8
Fig. 8. Results of a Bayesian model selection analysis.
The red blobs and table show the voxels and the number of voxels, respectively, that favor each model with an exceedance probability >0.95, indicating that the corresponding model provides a significantly better account for the BOLD activity in that region. Lee2014 refers to an arbitration control that takes into account only uncertainty as used by Lee et al.. Current model refers to the arbitration control model that was selected in the model comparison based on the behavioral data which incorporates both prediction uncertainty and task complexity. For an unbiased test, the coordinates of the ilPFC and the vmPFC ROIs were taken from ref. .
Fig. 9
Fig. 9. Modulation of inferior prefrontal reliability by complexity.
a (Left) Bilateral ilPFC was found to exhibit a significant interaction between complexity and reliability (Max reliability × complexity). Statistical significance of the negative effects is illustrated by the cyan colormap. The threshold is set at p < 0.005. (Right) The brain region reflecting the interaction effect largely overlaps with the brain area implicated in arbitration control. The red and blue regions refers to the main effect of max reliability and the interaction between reliability and task complexity, respectively, thresholded at p < 0.001. b Plot of average signal change extracted from left and right ilPFC clusters showing the interaction, shown separately for reliability signals derived from the MF and MB controllers. Data are split into two equal-sized bins according to the 50th and 100th percentile of the reliability signal, and shown for the trials in the low and high complexity condition separately. The error bars are SEM across subjects.

References

    1. Dickinson A. Actions and habits: the development of behavioural autonomy. Philos. Trans. R. Soc. B Biol. Sci. 1985;308:67–78. doi: 10.1098/rstb.1985.0010. - DOI
    1. Balleine BW, Dickinson A. Goal-directed instrumental action: contingency and incentive learning and their cortical substrates. Neuropharmacology. 1998;37:407–419. doi: 10.1016/S0028-3908(98)00033-1. - DOI - PubMed
    1. Graybiel AM. Habits, rituals, and the evaluative brain. Annu. Rev. Neurosci. 2008;31:359–387. doi: 10.1146/annurev.neuro.29.051605.112851. - DOI - PubMed
    1. Kuvayev, L., Kuvayev, L. & Sutton, R. S. Model-based reinforcement learning with an approximate, learned model. In Proc. Ninth Yale Work. Adapt. Learn. Syst. (New Haven, CT) Vol. 8, 101–105 (1996).
    1. Doya K, Samejima K, Katagiri K, Kawato M. Multiple model-based reinforcement learning. Neural Comput. 2002;14:1347–1369. doi: 10.1162/089976602753712972. - DOI - PubMed

Publication types