. 2019 Dec 16;10(1):5732.
doi: 10.1038/s41467-019-13480-z.

Insights into malaria susceptibility using genome-wide data on 17,000 individuals from Africa, Asia and Oceania

Collaborators

Insights into malaria susceptibility using genome-wide data on 17,000 individuals from Africa, Asia and Oceania

Malaria Genomic Epidemiology Network. Nat Commun. .

Abstract

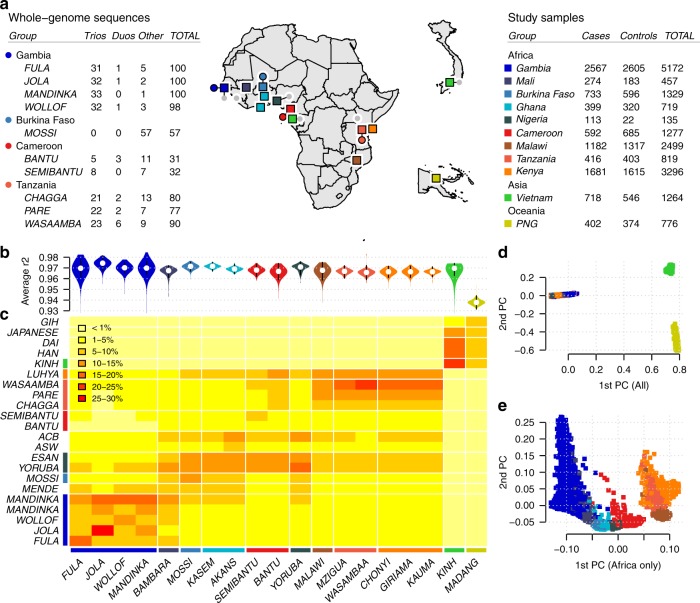
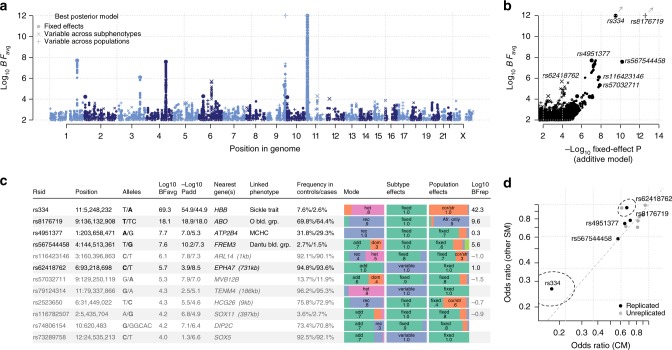
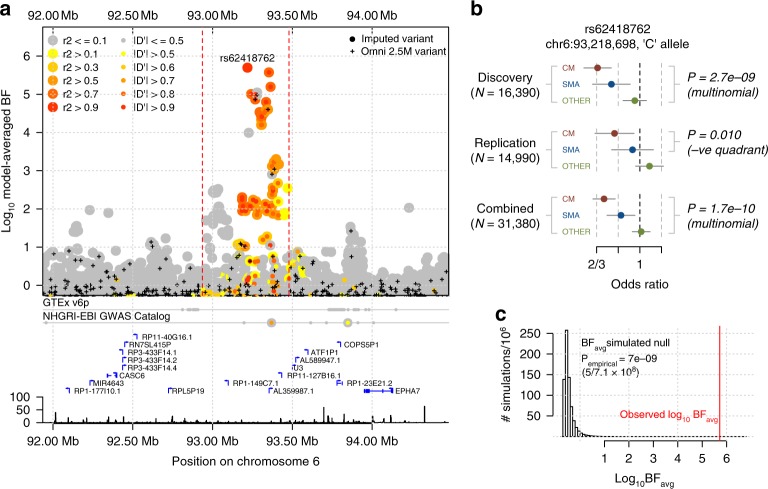
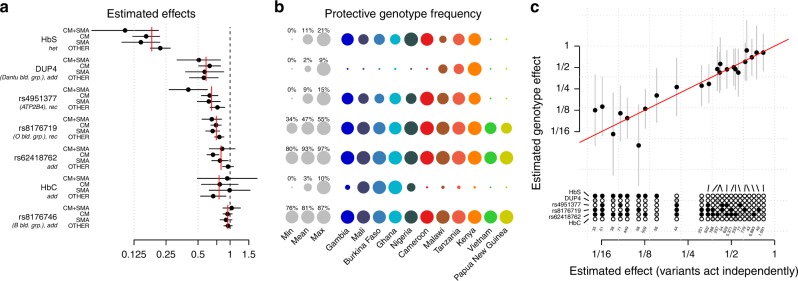
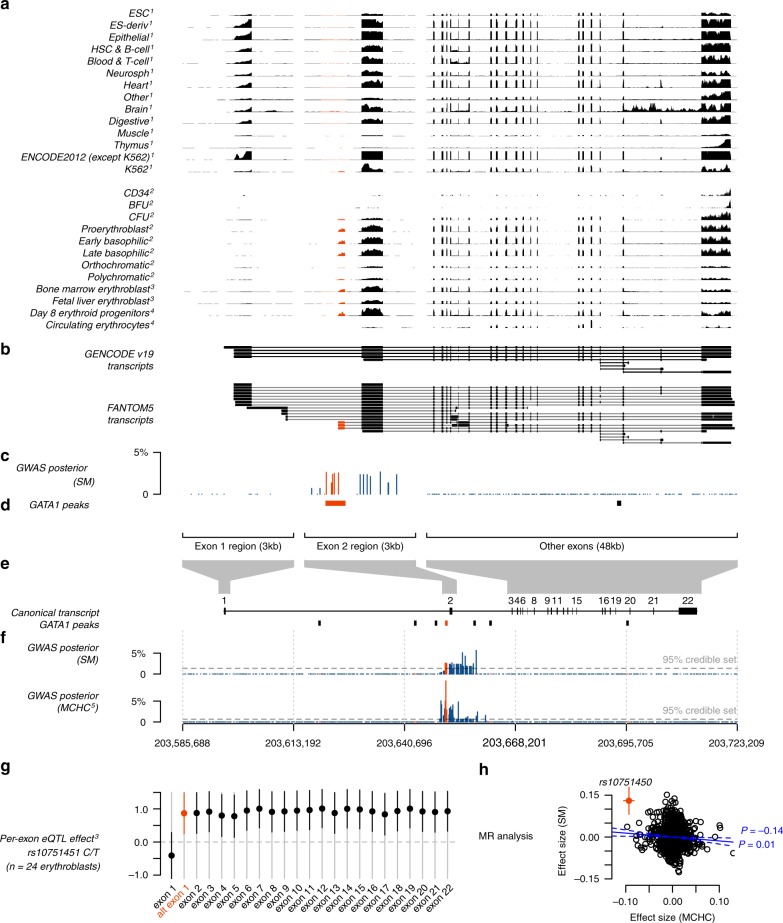
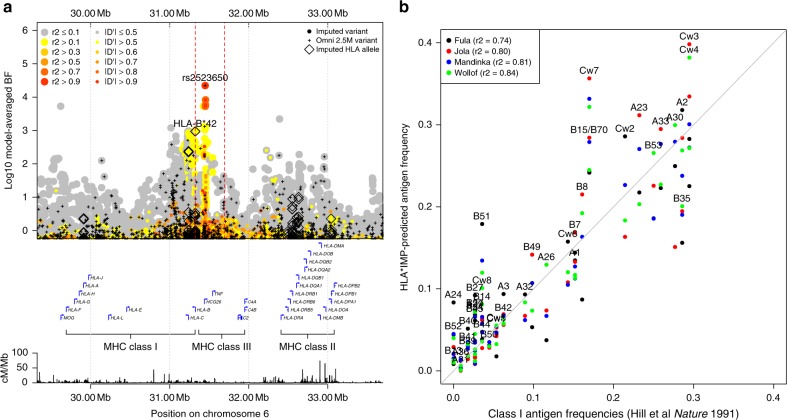
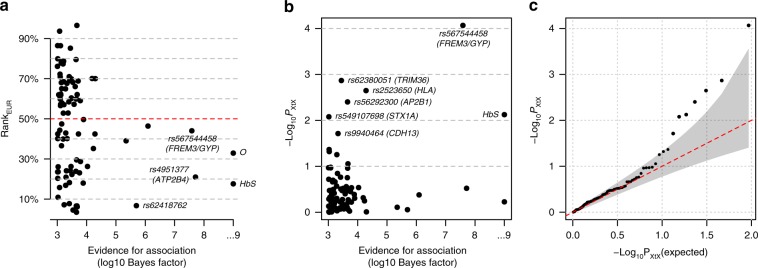
The human genetic factors that affect resistance to infectious disease are poorly understood. Here we report a genome-wide association study in 17,000 severe malaria cases and population controls from 11 countries, informed by sequencing of family trios and by direct typing of candidate loci in an additional 15,000 samples. We identify five replicable associations with genome-wide levels of evidence including a newly implicated variant on chromosome 6. Jointly, these variants account for around one-tenth of the heritability of severe malaria, which we estimate as ~23% using genome-wide genotypes. We interrogate available functional data and discover an erythroid-specific transcription start site underlying the known association in ATP2B4, but are unable to identify a likely causal mechanism at the chromosome 6 locus. Previously reported HLA associations do not replicate in these samples. This large dataset will provide a foundation for further research on thegenetic determinants of malaria resistance in diverse populations.


Conflict of interest statement

C.C.A.S. is a shareholder in, and current employee of, Genomics PLC.

Figures

Fig. 1
Fig. 1. Overview of datasets and imputation performance.
a Counts of whole-genome sequenced samples (reference panel samples, left table), samples typed on the Omni 2.5 M platform (study samples, right table) and geographic locations of sampling (map). Counts reflect numbers of samples following our quality control process. Sequenced samples were collected in family trios, except in Burkina Faso, as shown. Colours shown in tables and map denote country of origin of reference panel (circles) and study samples (squares), with small grey circles indicating 1000 Genomes Project populations. b Imputation performance, measured as the mean squared correlation between directly typed and re-imputed variants for each sample. c Distribution of the most similar haplotypes. For each GWAS sample, the average number of 1 Mb chunks such that the most similar haplotype lies in the given reference panel population (y axis) is shown. Values are averaged over samples within each GWAS population (x axis). d, e Principal components (PCs) computed across 17,120 study samples identified without close relationships, or the subset of 15,152 samples of African ancestry.
Fig. 2
Fig. 2. Evidence for association with severe malaria.
a Association evidence (log10 BFavg, y axis; clamped to a maximum of 12) at typed and imputed SNPs and indels genome-wide (x axis). BFavg reflects evidence under a range of models summarized using prior weights specified in Methods. Shapes denote whether the model with the highest posterior weight is for effects fixed across populations and subphenotypes (case–control effect, circles), or suggests variation in effect between populations (crosses) or between subphenotypes (plusses). b Comparison of model-averaged Bayes factor (log10 BFavg, y axis) and the evidence under an additive model of association with overall SM (−log10 Padd, x axis). For visualization purposes, we have removed variants in the region of rs334 (HbS, chromosome 11) and rs567544458 (glycophorin region, chromosome 4) except the lead variant. Shapes are as in a. The values for rs334 and rs8176719 lie outside the plot as indicated by arrows; to visualize these we have projected them onto the plot boundary. c Twelve regions of the genome with BFavg > 10,000. Columns reflect the ID, genomic position, reference, and alternative allele with estimated protective allele indicated in bold, log10 BFavg, −log10 P-value for an additive model of association with SM or with SM subtypes, nearest gene and distance to the nearest gene for intergenic variants, known linked phenotypes and combined protective allele frequency across African control and case samples. Bar plots summarize our inference about the mode of effect of the protective allele and the distribution of effects between SM subtypes and between populations. The last column reflects the evidence for association observed in replication samples (log10 BFreplication), assessed using the effect-size distribution learnt from discovery samples, based on direct typing of tag SNPs as detailed in Supplementary Data 1. Rows are in bold if they showed positive replication evidence (BFreplication > 1). d Comparison of estimated effect sizes for the protective allele on CM (y axis) and on unspecified SM cases (x axis) for the 12 variants in c. The 95% confidence region for rs334 and rs62418762 (dashed ellipses) are shown. Source data are provided as a Source Data file.
Fig. 3
Fig. 3. Evidence for association at rs62418762.
a Regional hitplot showing evidence for association (log10 BFavg, y axis) across a 2.5 Mb region surrounding rs62418762 (x axis). Points are coloured by LD with rs62418762, estimated using African reference panel haplotypes. Directly typed SNPs included in the phased dataset are denoted by black plusses. Below, the locations of significant tissue-specific eQTLs, previously identified association signals, regional genes, pseudogenes and noncoding RNAs, and the Hapmap-combined recombination rate map are annotated. b Detail of discovery and replication evidence for association at rs62418762 under an additive model. Points and lines represent the estimated odds ratio of the ‘C’ allele on severe malaria subtypes. Estimates are obtained using multinomial logistic regression in each population and combined across populations using fixed-effect meta-analysis. Top: effect sizes estimated from imputed genotypes in discovery samples. A Wald test P-value against the null that all three effect sizes are zero is shown. Middle: effect sizes estimated from direct typing of rs62418762 in replication samples. P-value reflects the alternative hypothesis that CM and SMA effects are nonzero and in the direction observed in discovery and is computed by simulation. Bottom: meta-analysis of discovery and replication results. c Empirical null distribution of the discovery BFavg, computed using simulations conditional on the observed frequencies of rs62418762. The red line indicates the observed BFavg and an empirical P-value from the simulated distribution is shown. Source data are provided as a Source Data file.
Fig. 4
Fig. 4. A joint model for natural genetic resistance to malaria.
a Effect sizes for severe malaria subtypes are estimated in a joint model, which includes the five replicating associated variants and two additional variants (rs33930165, which encodes haemoglobin C, and rs8176746, which reflects the A/B blood group) in associated regions. The model was fit across all 11 populations, assuming the effect on each phenotype is fixed across populations, and including a population indicator and five principal components in each population as covariates. Each variant is encoded according to the mode of inheritance of the protective allele inferred from discovery analysis. Red lines indicate the overall effect across severe malaria subtypes, computed as an inverse variance-weighted mean of the per-phenotype estimates. Only cases with positive measured falciparum parasitaemia were included in model fit. b The frequency of the protective allele (for effects inferred as additive) or protective genotype (for non-additive effects) of each variant in each population. Grey circles depict the minimum, mean and maximum observed frequencies across populations. Coloured circles reflect the per-population frequencies. Frequency estimates are computed using control samples only. c Comparison of effect-size estimates against severe malaria for combinations of genotypes (stacked circles) carried by at least 25 study individuals, across the top six variants in a. Black filled and open circles denote the protective and risk dosage at the corresponding variant, respectively; grey circles denote heterozygote genotype for variants with inferred additive effect. Effect-size estimates are computed using the model as in a assuming independent effects (x axis), or jointly allowing each genotype its own effect (y axis). Source data are provided as a Source Data file.
Fig. 5
Fig. 5. The ATP2B4 association is driven by an erythrocyte-specific transcription start site.
a Normalized RNA-seq coverage for (1) 56 cell types from Roadmap Epigenomics and ENCODE, (2) human CD34+ hematopoietic stem and progenitor cells, and experimentally differentiated erythroid cells from three biological replicates, (3) ex-vivo differentiated adult and fetal human erythroblasts from 24 individuals and (4) experimentally differentiated erythroid progenitor cells and circulating erythrocytes. Coverage is shown across expanded regions of ATP2B4 exon 1, exon 2 including the putative alternative first exon (located at 203,651,123–203,651,366) and the remaining exons. Throughout, red features are those lying within 500 bp upstream to 50 bp downstream of the alternative first exon. For Roadmap and ENCODE data, the plot reflects normalized coverage maximized across cell types in each tissue group. For other cells, coverage is summed over samples and normalized by the mean across ATP2B4 exons. b ATP2B4 transcripts from the GENCODE and FANTOM5 transcript models. c Posterior evidence for association with SM assuming a single causal variant. d Position of GATA1-binding peaks. e Location and size of the expanded regions shown against the full-length transcript, with GATA1-binding peaks shown. f Posterior evidence for association with SM as in c and with mean corpuscular haemoglobin concentration (MCHC), assuming a single causal variant for each trait separately. g Estimated effect of rs10751451 on each exon of ATP2B4, computed by linear regression against FPKM residuals after correcting for cell development stage, with 95% confidence intervals shown. For comparable visualization across exons, FPKM is further normalized by the mean across samples at each exon. h Mendelian randomization analysis of SM and MCHC at 2130 ‘sentinel’ SNPs previously identified as associated with haematopoetic traits with association results in our study. Points reflect the posterior effect-size estimates on SM (y axis) and MCHC (x axis), conditional on the fitted bivariate Gaussian model of effect sizes. Variants are assumed to act independently. Blue solid and dotted lines and text show the maximum likelihood estimate of the effect of MCHC on SM (ρ), its 95% confidence interval, and likelihood ratio test P-value against the null that ρ = 0.
Fig. 6
Fig. 6. Evidence for association across the HLA.
a Evidence for association at genotyped SNPs (black plusses), imputed SNPs and INDELs (circles), and imputed classical HLA alleles (black diamonds) across the HLA region. Points are coloured by LD with rs2523650 as estimated in the African reference panel populations. Selected regional genes and the Hapmap-combined recombination map are shown below. b Comparison of HLA Class I antigen frequencies in distinct sample sets from The Gambia. X axis: antigen frequencies obtained by serotyping of 112 healthy adults; y axis: inferred antigen frequencies based on imputation of 2-digit alleles in the four major ethnic groups (colours) in our Gambian dataset. B*15 alleles encode a number of antigens including B70 and we combine results for B15 and B70 here.
Fig. 7
Fig. 7. Empirical evidence for frequency differentiation of the most associated alleles.
a The European population rank (rankEUR, y axis) plotted against the evidence for association (log10 BFavg, x axis) for the protective allele at each of the 91 lead variants satisfying BFavg > 1000 and having assigned ancestral allele. For each variant with an estimated protective (respectively risk) derived allele A, rankEUR is defined as the proportion of alleles genome-wide having lower or equal (respectively greater than or equal) count than A in European populations, conditional on having the same frequency in African populations, estimated in reference panel populations. On average, rankEUR is expected to be equal to 50% (red dashed line). Points are labelled by the rsid and nearest or relevant gene(s), or by functional variant where known; O refers to rs8176719, which determines the O blood group. b Evidence for within-Africa differentiation (PXtX, y axis) plotted against the evidence for association (log10 BFavg, x axis) for each of the 92 lead variants satisfying BFavg > 1000, after removing all but rs2523650 from within the HLA region. PXtX is computed from an empirical null distribution of allele frequencies learnt across control samples in the seven largest African populations (Supplementary Figs. 8 and 9). c Quantile–quantile plot for PXtX across the top 92 regions in b. Source data are provided as a Source Data file.

References

    1. Casanova JL, Abel L. The genetic theory of infectious diseases: a brief history and selected illustrations. Annu. Rev. Genomics Hum. Genet. 2013;14:215–243. - PMC - PubMed
    1. Hall MD, Ebert D. The genetics of infectious disease susceptibility: has the evidence for epistasis been overestimated? BMC Biol. 2013;11:79. - PMC - PubMed
    1. Hill AV. Evolution, revolution and heresy in the genetics of infectious disease susceptibility. Philos. Trans. R Soc. Lond. B Biol. Sci. 2012;367:840–849. - PMC - PubMed
    1. Malaria Genomic Epidemiology, N. A global network for investigating the genomic epidemiology of malaria. Nature. 2008;456:732–737. - PMC - PubMed
    1. MalariaGEN. Reappraisal of known malaria resistance loci in a large multi-centre study. Nat. Genet.46, 1197–1204 (2014). - PMC - PubMed

Publication types

MeSH terms

Substances