Clinical Trial
. 2019 Dec 16;10(1):5714.
doi: 10.1038/s41467-019-13698-x.

The upper-airway microbiota and loss of asthma control among asthmatic children

Affiliations
Clinical Trial

The upper-airway microbiota and loss of asthma control among asthmatic children

Yanjiao Zhou et al. Nat Commun. .

Abstract

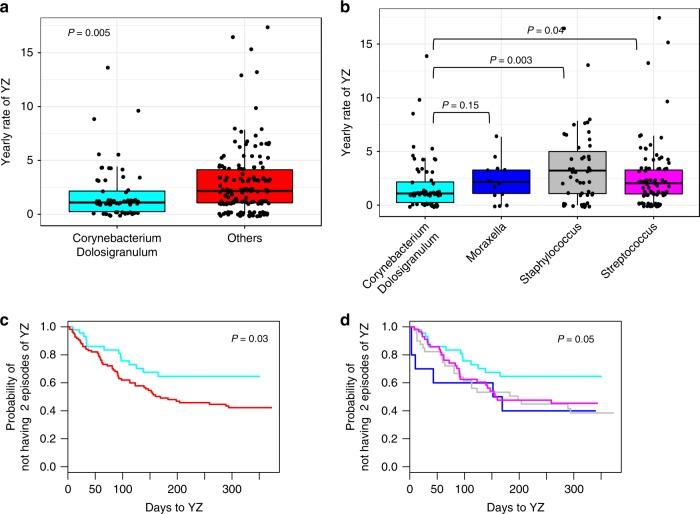
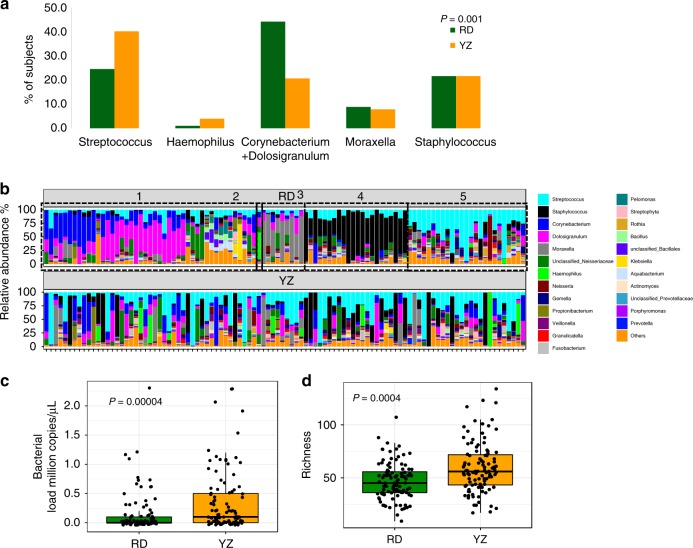
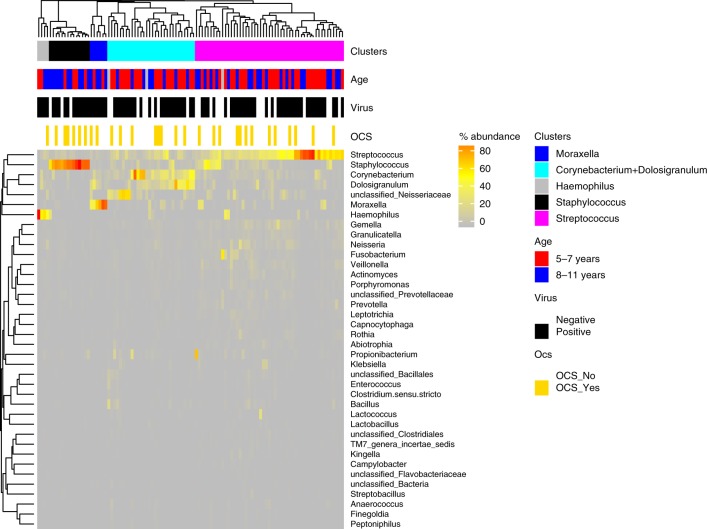
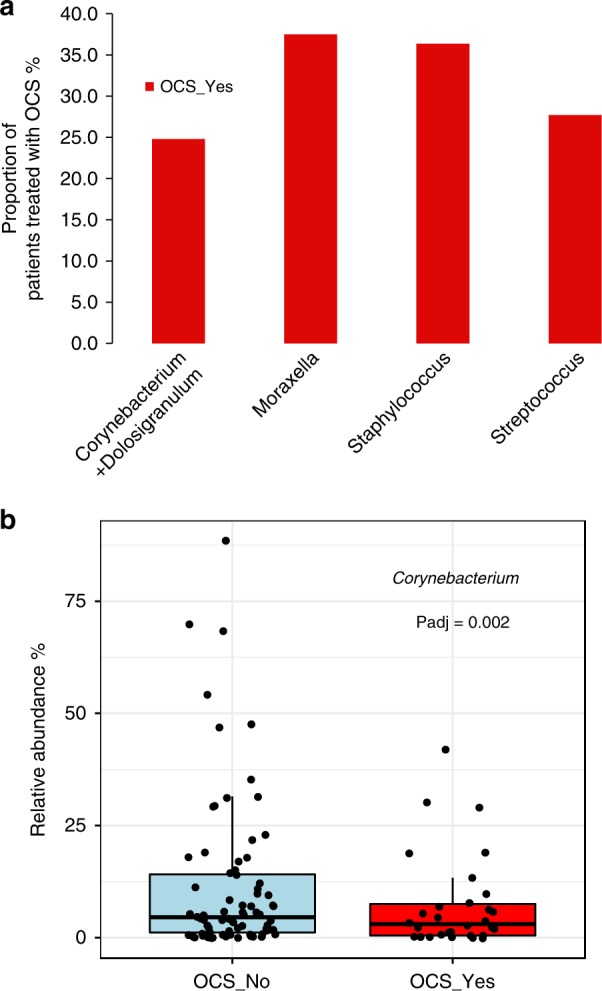
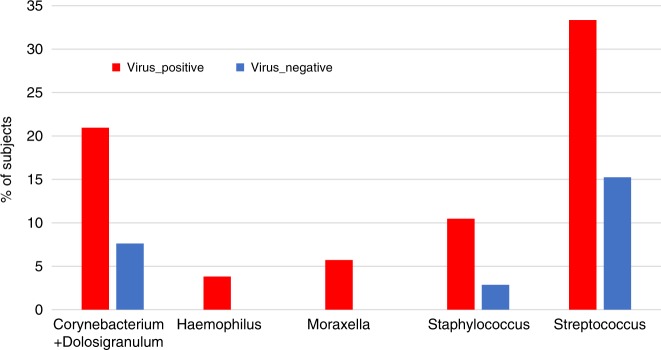
The airway microbiome has an important role in asthma pathophysiology. However, little is known on the relationships between the airway microbiome of asthmatic children, loss of asthma control, and severe exacerbations. Here we report that the microbiota's dynamic patterns and compositions are related to asthma exacerbations. We collected nasal blow samples (n = 319) longitudinally during a clinical trial at 2 time-points within one year: randomization when asthma is under control, and at time of early loss of asthma control (yellow zone (YZ)). We report that participants whose microbiota was dominated by the commensal Corynebacterium + Dolosigranulum cluster at RD experience the lowest rates of YZs (p = 0.005) and have longer time to develop at least 2 episodes of YZ (p = 0.03). The airway microbiota have changed from randomization to YZ. A switch from the Corynebacterium + Dolosigranulum cluster at randomization to the Moraxella- cluster at YZ poses the highest risk of severe asthma exacerbation (p = 0.04). Corynebacterium's relative abundance at YZ is inversely associated with severe exacerbation (p = 0.002).


Conflict of interest statement

D.J.: declares receiving research grants from NHLBI, NIAID, and GlaxoSmithKline. He has received personal fees for a DSMB from Pfizer, and for advisory boards from Novartis, GlaxoSmithKline, AstraZenena, Sanofi-Regeneron, Boehringer Ingelheim, and Vifor pharma. L.B.B.: declares receiving research grants from NIH, NHLBI, NIAID. He has received personal fees from GlaxoSmithKline, Genentech, Novartis, Merck, DBV technologies, Teva, Boehringer Ingelheim, Sanofi, Regeneron, AstraZenena, Vectura, Circassia. M.C.: pharmaceutical grant funding from AstraZenena, Chiesi, Novartis, GSK, Sanofi. Consultant for Genentech, Theravance, VIAA, Teva, Sanofi, Novartis. Speaker for AstraZenena, Genentech, GSK, Regeneron, Sanofi, Teva. Received royalties from Elsevier. Y.H.: research support from the NIH for microbiome research. R.F.L.: research support from the NIH for microbiome research. W.P.: Consultant for Novartis, Genentech, Regeneron, GSK, Teva, Sanofi. R.G.R.: research support from the NIH. The remaining authors declare no competing interests.

Figures

Fig. 1
Fig. 1. Top 25 major taxa identified at randomization.
Top 25 most abundant taxa in different age groups (a) and by the presence of respiratory virus in the sample (b) are shown by barplots. The Odd Ratio of developing YZ is displayed with 95% confidence interval (c). Source data are provided as a Source Data file.
Fig. 2
Fig. 2. Bacterial clusters identified in nasal samples at randomization (n = 214).
Corynebacterium + Dolosigranulum (cyan), Staphylococcus (black), Streptococcus (pink), and Moraxella (blue) were identified by hierarchical clustering and complete linkage approach. Bacterial genera with relative abundance >0. 1% was used for clustering analysis. Age group, presence of respiratory virus in the sample, and the annualized yearly rate of yellow zone episodes are annotated along each cluster. Source data are provided as a Source Data file.
Fig. 3
Fig. 3. Yearly rate of yellow zone (YZ) in respiratory clusters at randomization.
a Yearly rate of YZ in Corynebacterium+Dolosigranulum cluster compared to the combined Others 3 clusters. The line in the middle of a boxplot represents the median value of Yearly rate of YZ; the line at bottom and top of a box represent 25 and 75 percentile of the data value. Dots above the vertical line represent outliers of the data. b Yearly rate of YZ in the four respiratory clusters. In a, b, each dot represents a participant in the cluster. Statistical significance of YZ rate differences between clusters was tested using Wilcoxon rank-sum test. c Corynebacterium + Dolosigranulum cluster has significantly lower probability than the combined other three clusters (Other) to develop >=2 episode of YZ (p = 0.02 by Cox Proportional-Hazards model). d Corynebacterium + Dolosigranulum cluster has significantly lower probability than the Moraxella cluster and the Staphylococcus cluster to develop >=2 episodes of YZ (p = 0.05 by Cox Proportional-Hazards model). The colors of the clusters in c, d, are as in a, b. Source data are provided as a Source Data file.
Fig. 4
Fig. 4. Bacterial microbiome comparison between randomization (RD) and yellow zone (YZ).
a Five bacterial clusters were identified using the paired randomization (n = 102) and YZ data (n = 102). Each barplot represents the proportion of patients belonging to a given cluster. Green-samples collected at RD, and orange-samples collected at YZ. Sums of proportions for green/orange bars is equal to 100%. The statistical difference of patient distribution across the five clusters was identified using Chi-Square test. b Changes in the relative abundance of bacterial microbiome from RD to YZ in each of the study participants. The relative abundance of the top 25 bacteria from RD (top panel) and YZ (bottom panel) in the same subjects are plotted. The samples are ordered by clusters at RD from left to right (1) Corynebacterium + Dolosigranulum (2) Haemophilus (3) Moraxella (4) Staphylococcus (5) Streptococcus clusters. c Total bacterial load in RD and YZ samples. Total bacterial load is represented as 16S rRNA million copies per μL, estimated by qPCR. d Bacterial richness at RD and YZ. Statistical difference of bacterial load or richness was tested using Wilcoxon rank-sum test. Source data are provided as a Source Data file.
Fig. 5
Fig. 5. Changes in bacterial clusters from randomization to yellow zone YZ.
The numbers within each cluster at RD (left) and YZ (right) are the number of patients within each specific cluster switch. Source data are provided as a Source Data file.
Fig. 6
Fig. 6. Bacterial clusters identified from 105 nasal samples at yellow zone (YZ).
Five clusters, Corynebacterium + Dolosigranulum (cyan), Staphylococcus (black), Streptococcus (pink), Moraxella (blue), and Haemophilus (gray) were identified by hierarchical clustering and complete linkage approach. Bacterial genera with relative abundance >0.1% was used for clustering analysis. Source data are provided as a Source Data file.
Fig. 7
Fig. 7. The microbiome at YZ and the outcome of severe exacerbations (OCS treatment).
a The proportion of patients progressed to severe exacerbation (OCS therapy, n = 30) across different bacterial clusters at YZ (b). The relative abundance of Corynebacterium at the time of YZ is significantly lower in patients that progressed to severe exacerbation (P = 0.002, Deseq). Source data are provided as a Source Data file.
Fig. 8
Fig. 8. Proportion of subjects positive or negative for respiratory virus across the five clusters at YZ.
The number of virus positive ((red, n = 78) and virus negative (blue, n = 27) samples are distributed disproportionally across different clusters. Subjects belonging to Haemophilus and Moraxella clusters were all virus positive. Source data are provided as a Source Data file.

References

    1. O’Brian AL, et al. Recurrent severe exacerbations in early life and reduced lung function at school age. J. Allergy Clin. Immunol. 2012;129:1162–1164. doi: 10.1016/j.jaci.2011.11.046. - DOI - PMC - PubMed
    1. O’Byrne PM, et al. Severe exacerbations and decline in lung function in asthma. Am. J. Respir. Crit. Care Med. 2009;179:19–24. doi: 10.1164/rccm.200807-1126OC. - DOI - PubMed
    1. Teo SM, et al. The infant nasopharyngeal microbiome impacts severity of lower respiratory infection and risk of asthma development. Cell Host Microbe. 2015;17:704–715. doi: 10.1016/j.chom.2015.03.008. - DOI - PMC - PubMed
    1. Rosas-Salazar C, et al. Nasopharyngeal Lactobacillus is associated with a reduced risk of childhood wheezing illnesses following acute respiratory syncytial virus infection in infancy. J. Allergy Clin. Immunol. 2018;142:1447–1456.e9. doi: 10.1016/j.jaci.2017.10.049. - DOI - PMC - PubMed
    1. Bisgaard H, et al. Association of bacteria and viruses with wheezy episodes in young children: prospective birth cohort study. BMJ. 2010;341:c4978. doi: 10.1136/bmj.c4978. - DOI - PMC - PubMed

Publication types

MeSH terms

LinkOut - more resources