. 2019 Dec 16;10(1):5720.
doi: 10.1038/s41467-019-13700-6.

TRIB3 supports breast cancer stemness by suppressing FOXO1 degradation and enhancing SOX2 transcription

Affiliations

TRIB3 supports breast cancer stemness by suppressing FOXO1 degradation and enhancing SOX2 transcription

Jin-Mei Yu et al. Nat Commun. .

Abstract

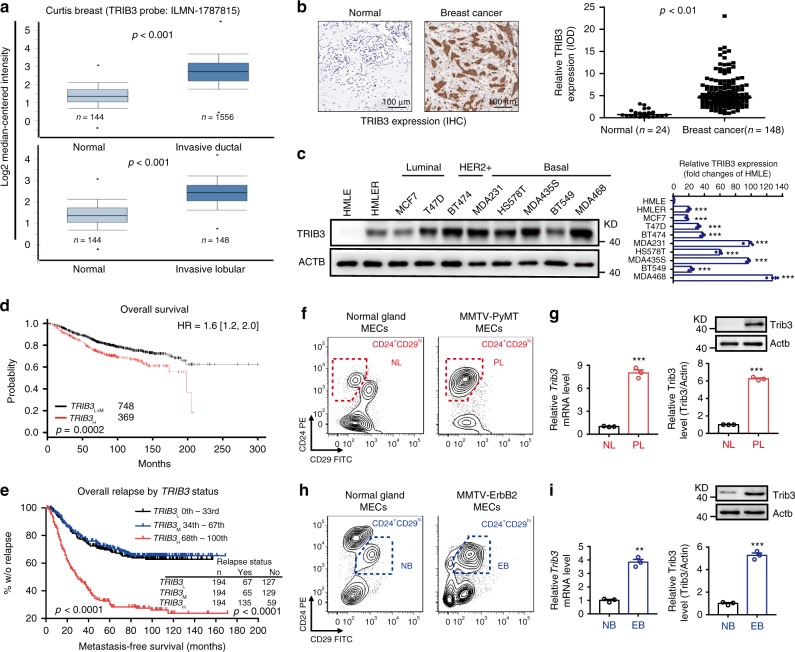
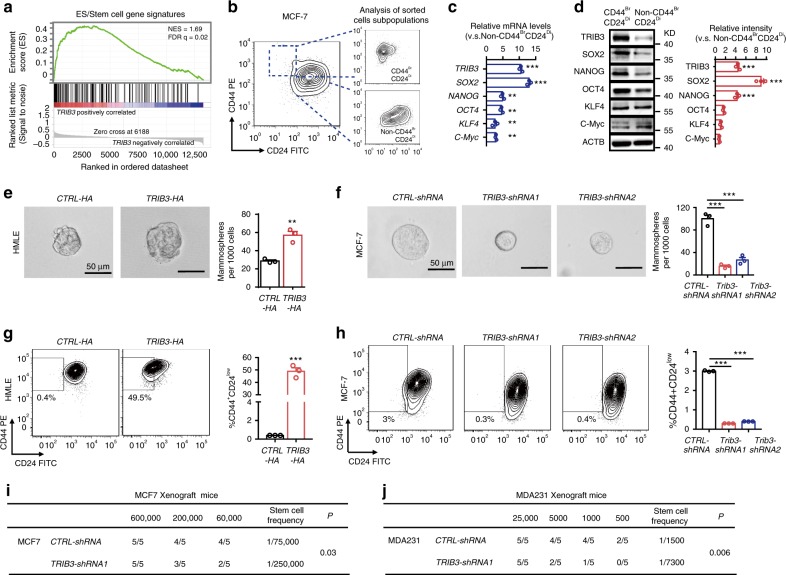
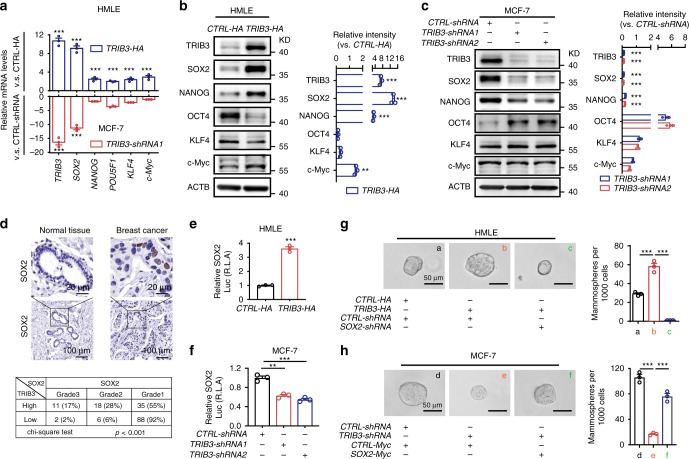
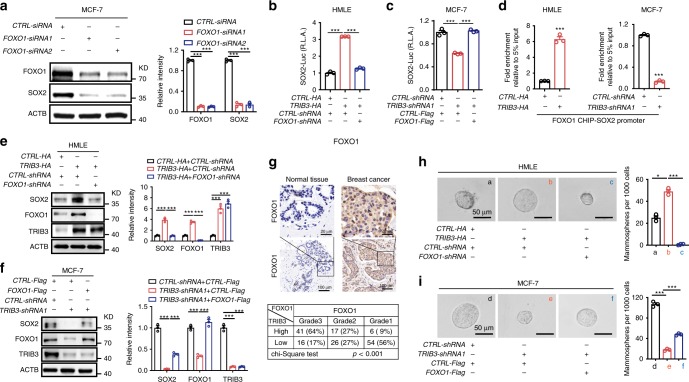
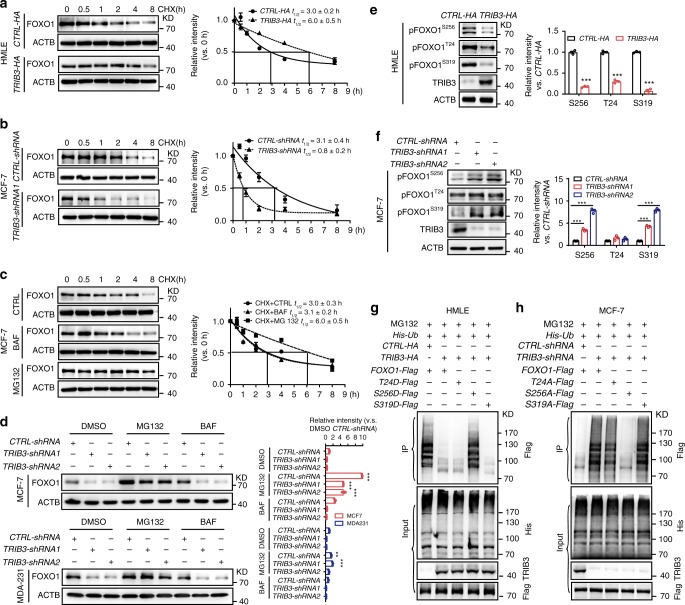
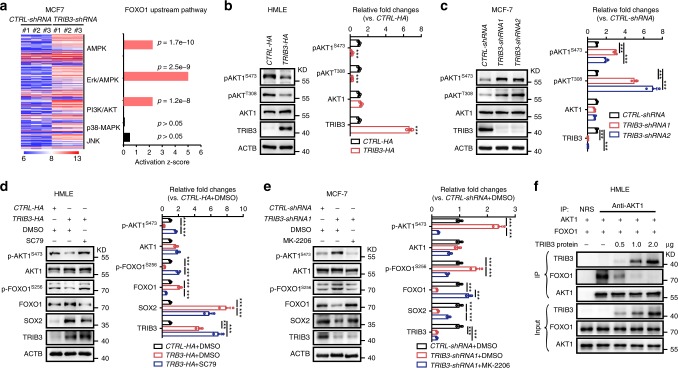
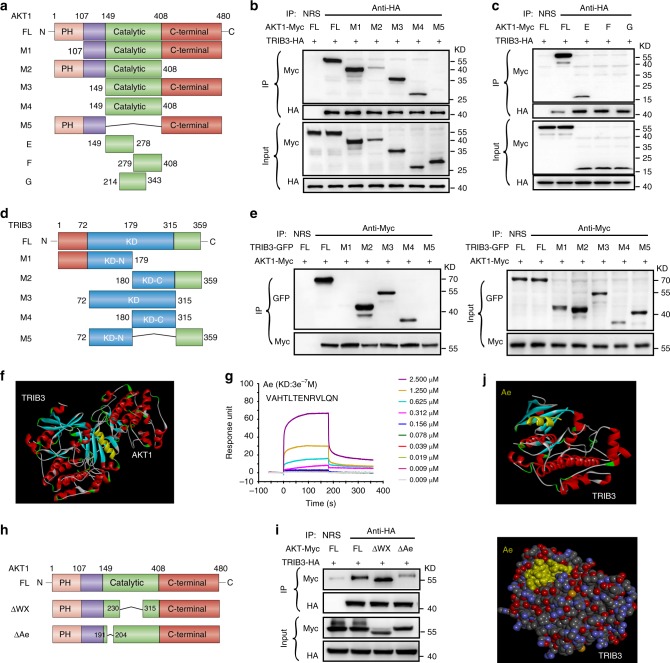
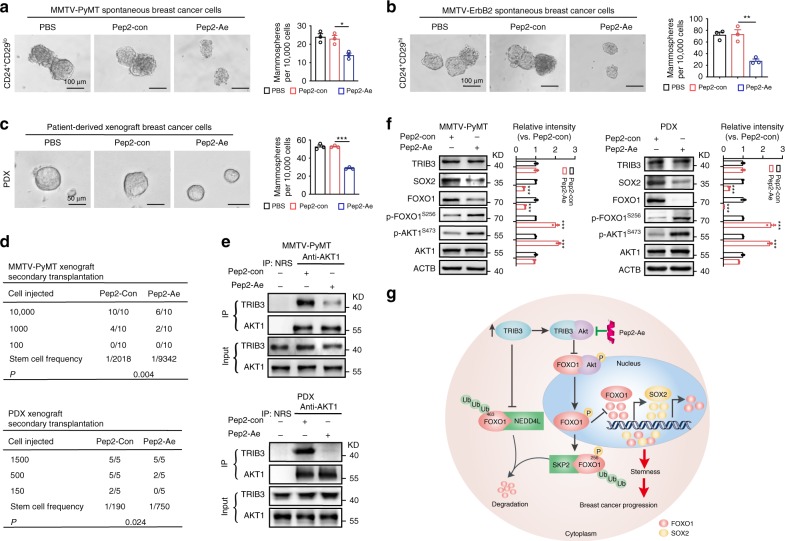
The existence of breast cancer stem cells (BCSCs) is a major reason underlying cancer metastasis and recurrence after chemotherapy and radiotherapy. Targeting BCSCs may ameliorate breast cancer relapse and therapy resistance. Here we report that expression of the pseudokinase Tribble 3 (TRIB3) positively associates with breast cancer stemness and progression. Elevated TRIB3 expression supports BCSCs by interacting with AKT to interfere with the FOXO1-AKT interaction and suppress FOXO1 phosphorylation, ubiquitination, and degradation by E3 ligases SKP2 and NEDD4L. The accumulated FOXO1 promotes transcriptional expression of SOX2, a transcriptional factor for cancer stemness, which in turn, activates FOXO1 transcription and forms a positive regulatory loop. Disturbing the TRIB3-AKT interaction suppresses BCSCs by accelerating FOXO1 degradation and reducing SOX2 expression in mouse models of breast cancer. Our study provides insights into breast cancer development and confers a potential therapeutic strategy against TRIB3-overexpressed breast cancer.


Conflict of interest statement

The authors declare no competing interests.

Figures

Fig. 1
Fig. 1. High TRIB3 expression is negatively associated with overall survival and metastasis-free survival in breast cancer.
a Graph derived from published data available in the Oncomine database. The box charts depict the relative expression of TRIB3 in invasive ductal (top) and invasive lobular (bottom) breast cancer patients. Centre line = 50th percentiles; bounds of box = 25th and 75th percentiles; bars = 10th and 90th percentiles; whiskers = min and max values. b Formalin-fixed, paraffin-embedded tissue microarray sections of normal and breast cancer tissues were stained with an anti-TRIB3 antibody. Tissue-bound TRIB3 is shown in brown (left). The dot plots show the relative expression of TRIB3 calculated by the intensity of the brown color in tissue array immunohistological images (right). c Immunoblots of protein lysates from HMLE, HMLER, and BCCs, as indicated at the top of the left panel. The relative TRIB3 expression quantification from three independent studies is shown (right). d, e Graph derived from TCGA (d) or published data (e) available in the PubMed GEO database (GSE2603, GSE5327, GSE2034, and GSE12276). For each analysis, 1117 patients (d) or 582 patients (e) were segregated into tertiles, with the group designated TRIB3H representing one-third of the patients who had tumors with the highest levels of TRIB3 mRNA and the group designated TRIB3L representing one-third of patients who had cancers with the lowest levels of TRIB3 mRNA. One-third of patients who had tumors with intermediate TRIB3 mRNA expression were designated as TRIB3M. Overall survival (d) and metastasis-free survival (e) were determined by Kaplan–Meier analyses, and significant differences were determined by the log-rank test. The number of patients in each category, the total metastatic events, and the corresponding P-values (χ2-test) are shown in the embedded tables. fi Flow cytometry of CD45CD31TER119(Lin) MECs from the mammary glands of 6-week-old MMTV-PyMT female mice (f) and 6-month-old MMTV-ErbB2 female mice (h). Relative Trib3 mRNA expression and TRIB3 protein expression are indicated in g and i. Data are presented as the mean ± SEM; P > 0.05 was considered not significant (NS); *P < 0.05, **P < 0.01, and ***P < 0.001 compared with the HMLE group in c and the normal gland group in g and i. Source data are provided as a Source Data file.
Fig. 2
Fig. 2. Silencing TRIB3 inhibits the spheroid formation and tumor engraftment.
a GSEA demonstrating the enrichment of gene sets related to ES stem cell gene signatures in the ranked gene list of the top 10th percentile (n = 121) vs. the bottom 10th percentile (n = 121) of breast cancer patients expressing TRIB3 from the TCGA database (n = 1215). NES, normalized enrichment score. FDR, false discovery rate. b Flow cytometric analyses of representative unsorted MCF7 cells (left), isolated CD44BrCD24Di MCF7 cells (upper right), and isolated non-CD44BrCD24Di MCF7 cells (lower right). Contour plots (10% probability) depict the fluorescence of BCCs stained with fluorochrome-conjugated mAbs specific for human CD44 (y axis) or human CD24 (x axis). c, d Gene expression (c) by real-time PCR or immunoblots (d) of protein lysates of CD44BrCD24Di and non-CD44BrCD24Di MCF7 cells. The height of each column in the histogram indicates the fold increase in each gene or protein, as indicated on the left, of sorted CD44BrCD24Di MCF7 cells relative to that of sorted non-CD44BrCD24Di MCF7 cells. e, f Tumor spheroid formation of HMLE cells (e) transfected with control vector or TRIB3-expressing vector (as indicated at the top) or MCF7 cells (f) transfected with either CTRL-shRNA or TRIB3-shRNA. All data are shown as the number of mammospheres per 1000 cells. g, h Flow cytometric assays detecting the percentage of CD44BrCD24Di in HMLE cells transfected with a control vector or a TRIB3-expressing vector (g), or MCF7 cells transfected with either CTRL-shRNA or TRIB3-shRNA (h). i, j Tumor incidence in animals implanted with MCF7 cells (i) or MDA-MB-231 cells (j) transfected with either CTRL-shRNA or TRIB3-shRNA. Data are shown as the mean ± SEM; P > 0.05 was considered not significant (NS); *P < 0.05, **P < 0.01, and ***P < 0.001, compared with the vector or CTRL-shRNA group. Source data are provided as a Source Data file.
Fig. 3
Fig. 3. TRIB3 enhances SOX2 expression in BCCs.
a Histogram showing the expression of TRIB3 (far left) and stem cell-related genes in HMLE cells transfected with TRIB3-expressing vector vs. control vector and MCF7 cells transfected with TRIB3-shRNA1 vs. CTRL-shRNA. b, c Immunoblots and statistical analysis (n = 3) of protein lysates, as indicated on the left, transfected with a control vector or a TRIB3-expressing vector for HMLE cells (b) or with CTRL-shRNA, or TRIB3-shRNA for MCF7 cells (c). d Formalin-fixed, paraffin-embedded tissue microarray sections of normal and breast cancer tissues were stained with an anti-SOX2 antibody. Tissue-bound SOX2 is shown in brown (top). A 3 × 2 contingency table shows the correlation between TRIB3 and SOX2 based on their relative expression, graded by the percentage and intensity of the brown color staining in the immunohistological images (bottom). e Overexpression of TRIB3 enhanced the SOX2 transcriptional activity in HMLE cells, as determined by a luciferase reporter assay. f Silencing TRIB3 inhibited the SOX2 transcription activity in MCF7 cells, as determined by a luciferase reporter assay. g, h Tumor spheroid formation ability of HMLE cells (g) transfected with a control vector or a TRIB3-expressing vector and either CTRL-shRNA or SOX2-shRNA (as indicated at the bottom) or of MCF7 cells (h) transfected with CTRL-shRNA or TRIB3-shRNA, and either a control vector or a SOX2-expressing vector. All data are shown as the number of mammospheres per 1000 cells. Data are presented as the mean ± SEM of three independent assays; P > 0.05 was considered not significant (NS); *P < 0.05, **P < 0.01, and ***P < 0.001 compared with the vector or CTRL-shRNA group. Source data are provided as a Source Data file.
Fig. 4
Fig. 4. FOXO1 controls the TRIB3-SOX2 Axle in BCCs.
a Sample immunoblots and quantitative analyses of the expression of SOX2 after silencing the SOX2 transcriptional factor FOXO1 in MCF7 cells. b, c SOX2 transcriptional activity in HMLE cells (b) transfected with a control vector or a TRIB3-expressing vector and either CTRL-shRNA or FOXO1-shRNA (as indicated at the bottom), or in MCF7 cells (c) transfected with CTRL-shRNA or TRIB3-shRNA, and either a control vector or a FOXO1-expressing vector. d FOXO1 ChIP-SOX2 promoter activity in HMLE cells transfected with a control vector or a TRIB3-expressing vector (as indicated at the bottom) or MCF7 cells transfected with either CTRL-shRNA or TRIB3-shRNA. e, f Immunoblots and statistical analysis of protein lysates of HMLE cells (e) transfected with a control vector or a TRIB3-expressing vector and either CTRL-shRNA or FOXO1-shRNA (as indicated on the top), or of MCF7 cells (f) transfected with CTRL-shRNA or TRIB3-shRNA and either a control vector or a FOXO1-expressing vector. g Formalin-fixed, paraffin-embedded tissue microarray sections of normal or breast cancer tissues were stained with an anti-FOXO1 antibody. Tissue-bound FOXO1 is shown in brown (top). A 3 × 2 contingency table shows the correlation between TRIB3 and FOXO1 based on their relative expression, graded by the percentage and intensity of the brown color staining in the immunohistological images (bottom). h, i Tumor spheroid formation of HMLE cells (h) transfected with a control vector or a TRIB3-expressing vector and either CTRL-shRNA or FOXO1-shRNA (as indicated at the bottom), or of MCF7 cells (i) transfected with CTRL-shRNA or TRIB3-shRNA and either a control vector or a FOXO1-expressing vector. All data are shown as the number of mammospheres per 1000 cells. Data are shown as the mean ± SEM; P > 0.05 was considered not significant (NS); *P < 0.05, **P < 0.01, and ***P < 0.001 compared with the vector or CTRL-shRNA group. Source data are provided as a Source Data file.
Fig. 5
Fig. 5. TRIB3 stabilizes the FOXO1 protein by suppressing its ubiquitination.
a, b HMLE cells transfected with a TRIB3-expressing vector vs. a control vector (a) or MCF7 cells transfected with TRIB3-shRNA vs. CTRL-shRNA (b) were incubated with 20 μM cycloheximide (CHX) for the indicated times. c, d The effect of TRIB3 depletion on FOXO1 degradation in vitro. MCF7 cells (c) were incubated with CHX (20 μM), CHX plus bafilomycin (BAF, 200 nM), or MG132 (10 μM) for the indicated times. Control or TRIB3-silenced MCF7 cells (d, top) and MDA-MB-231 cells (d, bottom) were incubated with DMSO, 200 nM BAF, or 10 μM MG132 for 8 h. The indicated proteins were detected by immunoblotting. e, f FOXO1 activity in HMLE cells (e) transfected with a control vector or a TRIB3-expressing vector, or in MCF7 cells (f) transfected with CTRL-shRNA or TRIB3-shRNA and either a control vector or a FOXO1-expressing vector. g, h The effect of TRIB3 on FOXO1 ubiquitination. HMLE (g) or MCF7 cells (h) were transfected with the indicated plasmid. His-ubiquitin-conjugated proteins were pulled down from cell lysates. Total protein lysates and Ni-NTA-agarose eluates were immunoblotted for FLAG, His, and TRIB3. Source data are provided as a Source Data file.
Fig. 6
Fig. 6. TRIB3 abrogates the AKT-FOXO1 interaction.
a Supervised clustering of MCF7 cells transfected with CTRL-shRNA or TRIB3-shRNA using the log2-transformed values for genes in the FOXO1 upstream pathway, including AMPK, ERK, PI3K, p38, and JNK clustered genes expressed in all samples. Each column represents a separate case. Z-scores from IPA depicting the subnetwork gene expression differences between CTRL-shRNA and TRIB3-shRNA cases. The Z-score heat map depicts the five FOXO1 upstream subnetworks. Each row represents the data for the subnetwork indicated in the right margin. b, c TRIB3 inhibited the activity of AKT1 in BCCs. The indicated stable expression cell extracts were prepared and the levels of the indicated proteins were detected by immunoblotting. d, e The effects of the AKT1 agonist or antagonist for TRIB3-FOXO1-SOX2 axis in BCCs. The indicated cells were treated with the AKT1 agonist SC79 or the antagonist MK2206 for 24 h. Cell extracts were prepared and the levels of the indicated proteins were detected by immunoblotting. f TRIB3 inhibited the AKT1-FOXO1 interaction by binding to AKT1. HMLE cell extracts were IP with an anti-AKT1 Ab and blotted with an anti-TRIB3 or anti-FOXO1 Ab in the presence of the indicated concentration of the TRIB3-GST protein. Data are shown as the mean ± SEM; P > 0.05 was considered not significant (NS); *P < 0.05, **P < 0.01, and ***P < 0.001 compared with the vector or CTRL-shRNA group. Source data are provided as a Source Data file.
Fig. 7
Fig. 7. Mapping of the TRIB3-AKT1 interaction.
a Mapping AKT1 regions binding to TRIB3. Schematic diagram of full-length AKT1 and deletion mutants. b, c HEK293T cells were co-transfected with the indicated AKT1-Myc and TRIB3-HA constructs. Cell extracts were IP with an anti-HA Ab. d Mapping TRIB3 regions binding to AKT1. Schematic diagram of full-length TRIB3 and deletion mutants. e HEK293T cells were co-transfected with the indicated AKT1 and TRIB3-GFP constructs. Cell extracts were IP with an anti-Myc Ab. f Prediction of the AKT1 and TRIB3 interaction using Discovery Studio. g Kinetic interactions of α-helical peptides and the TRIB3 protein were determined by SPR analyses. h Schematic diagram of full-length AKT1 and deletion mutants. i The △Ae AKT1 mutant barely binds the TRIB3 protein. HEK293T cells were co-transfected with the indicated mutants of AKT1-Myc and TRIB3-HA. Cell extracts were IP with an anti-HA Ab. j Prediction of the Pep2–Ae and TRIB3 interaction by Discovery Studio. Source data are provided as a Source Data file.
Fig. 8
Fig. 8. Pep2–Ae disturbs the TRIB3-AKT interaction and reduces breast cancer stemness.
ac Pep2–Ae suppressed mammosphere formation. Primary MMTV-PyMT, MMTV-ErbB2, and PDX BCCs were cultured in tumorsphere media and treated with the indicated peptides (1 μM) for 5–7 days. The size and number of mammospheres were analyzed (scale bar, 100 μm or 50 μm). d The effects of Pep2–Ae treatment on the tumor incidence of secondary transplanted MMTV-PyMT-derived breast cancer in FVB/N mice (top) and PDX-derived BCCs in NPG mice (bottom). e The effect of Pep2–Ae on the TRIB3/AKT1 interaction. Primary MMTV-PyMT and PDX BCCs were isolated from peptide-treated engrafted mice. Cell extracts were IP with an anti-AKT1 Ab and blotted with an anti-TRIB3 Ab. f The effect of Pep2–Ae on the levels of the indicated proteins. Primary MMTV-PyMT and PDX BCCs were isolated from peptide-treated engrafted mice. Cell extracts were prepared, and the levels of the indicated proteins were detected by immunoblotting. g Schematic diagram illustrates the elevated TRIB3 expression promoted BCSCs and breast cancer development. Data are shown as the mean ± SEM; P > 0.05 was considered not significant (NS); *P < 0.05, **P < 0.01, and ***P < 0.001 compared with Pep2–con. Source data are provided as a Source Data file.

References

    1. Korkaya H, Liu S, Wicha MS. Breast cancer stem cells, cytokine networks, and the tumor microenvironment. J. Clin. Invest. 2011;121:3804–3809. doi: 10.1172/JCI57099. - DOI - PMC - PubMed
    1. Brooks MD, Burness ML, Wicha MS. Therapeutic implications of cellular heterogeneity and plasticity in breast cancer. Cell Stem Cell. 2015;17:260–271. doi: 10.1016/j.stem.2015.08.014. - DOI - PMC - PubMed
    1. Bianchini G, Balko JM, Mayer IA, Sanders ME, Gianni L. Triple-negative breast cancer: challenges and opportunities of a heterogeneous disease. Nat. Rev. Clin. Oncol. 2016;13:674–690. doi: 10.1038/nrclinonc.2016.66. - DOI - PMC - PubMed
    1. Hanahan D, Weinberg RA. Hallmarks of cancer: the next generation. Cell. 2011;144:646–674. doi: 10.1016/j.cell.2011.02.013. - DOI - PubMed
    1. Luo M, et al. Breast cancer stem cells: current advances and clinical implications. Methods Mol. Biol. 2015;1293:1–49. doi: 10.1007/978-1-4939-2519-3_1. - DOI - PubMed

Publication types

MeSH terms