. 2020 Jan;4(1):69-83.
doi: 10.1038/s41551-019-0485-1. Epub 2019 Dec 16.

Large-scale generation of functional mRNA-encapsulating exosomes via cellular nanoporation

Affiliations

Large-scale generation of functional mRNA-encapsulating exosomes via cellular nanoporation

Zhaogang Yang et al. Nat Biomed Eng. 2020 Jan.

Erratum in

Abstract

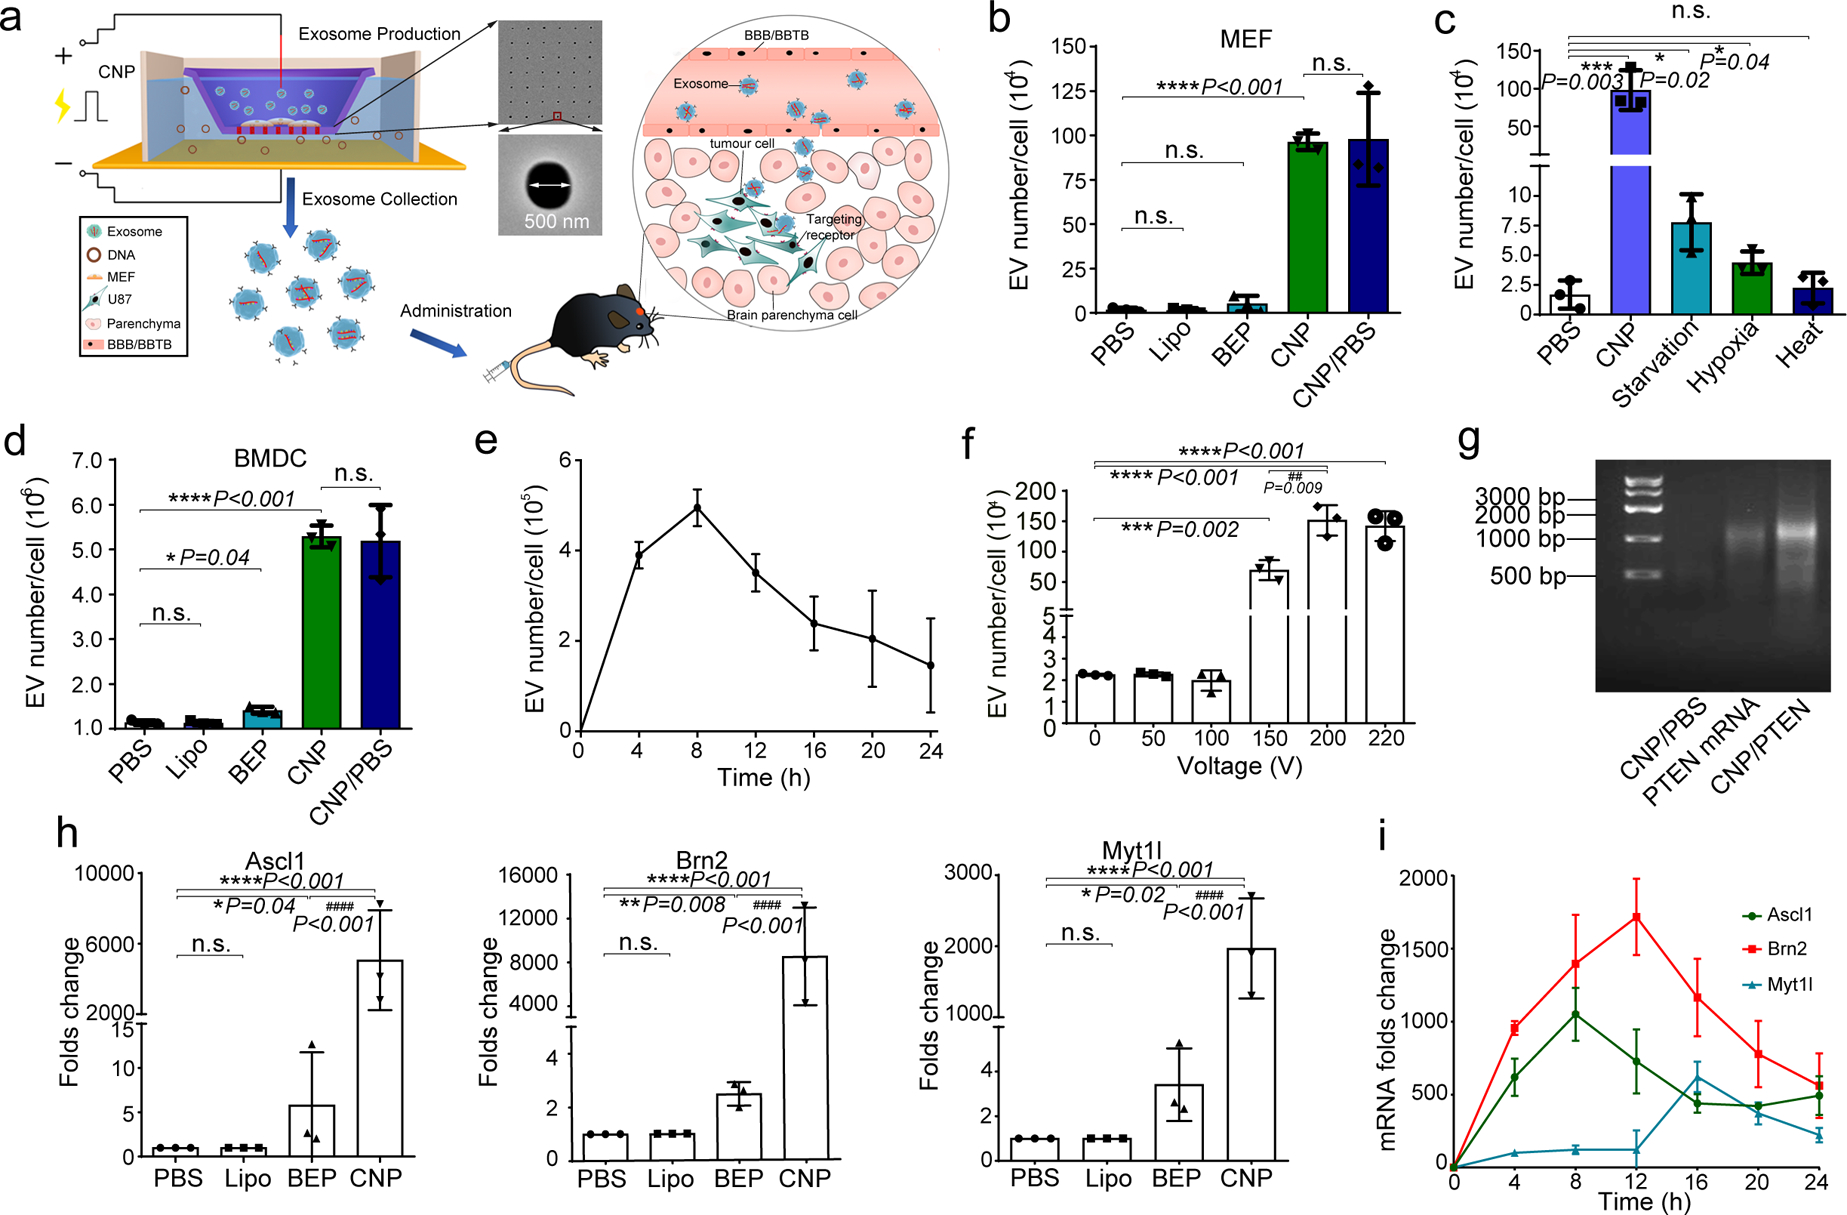
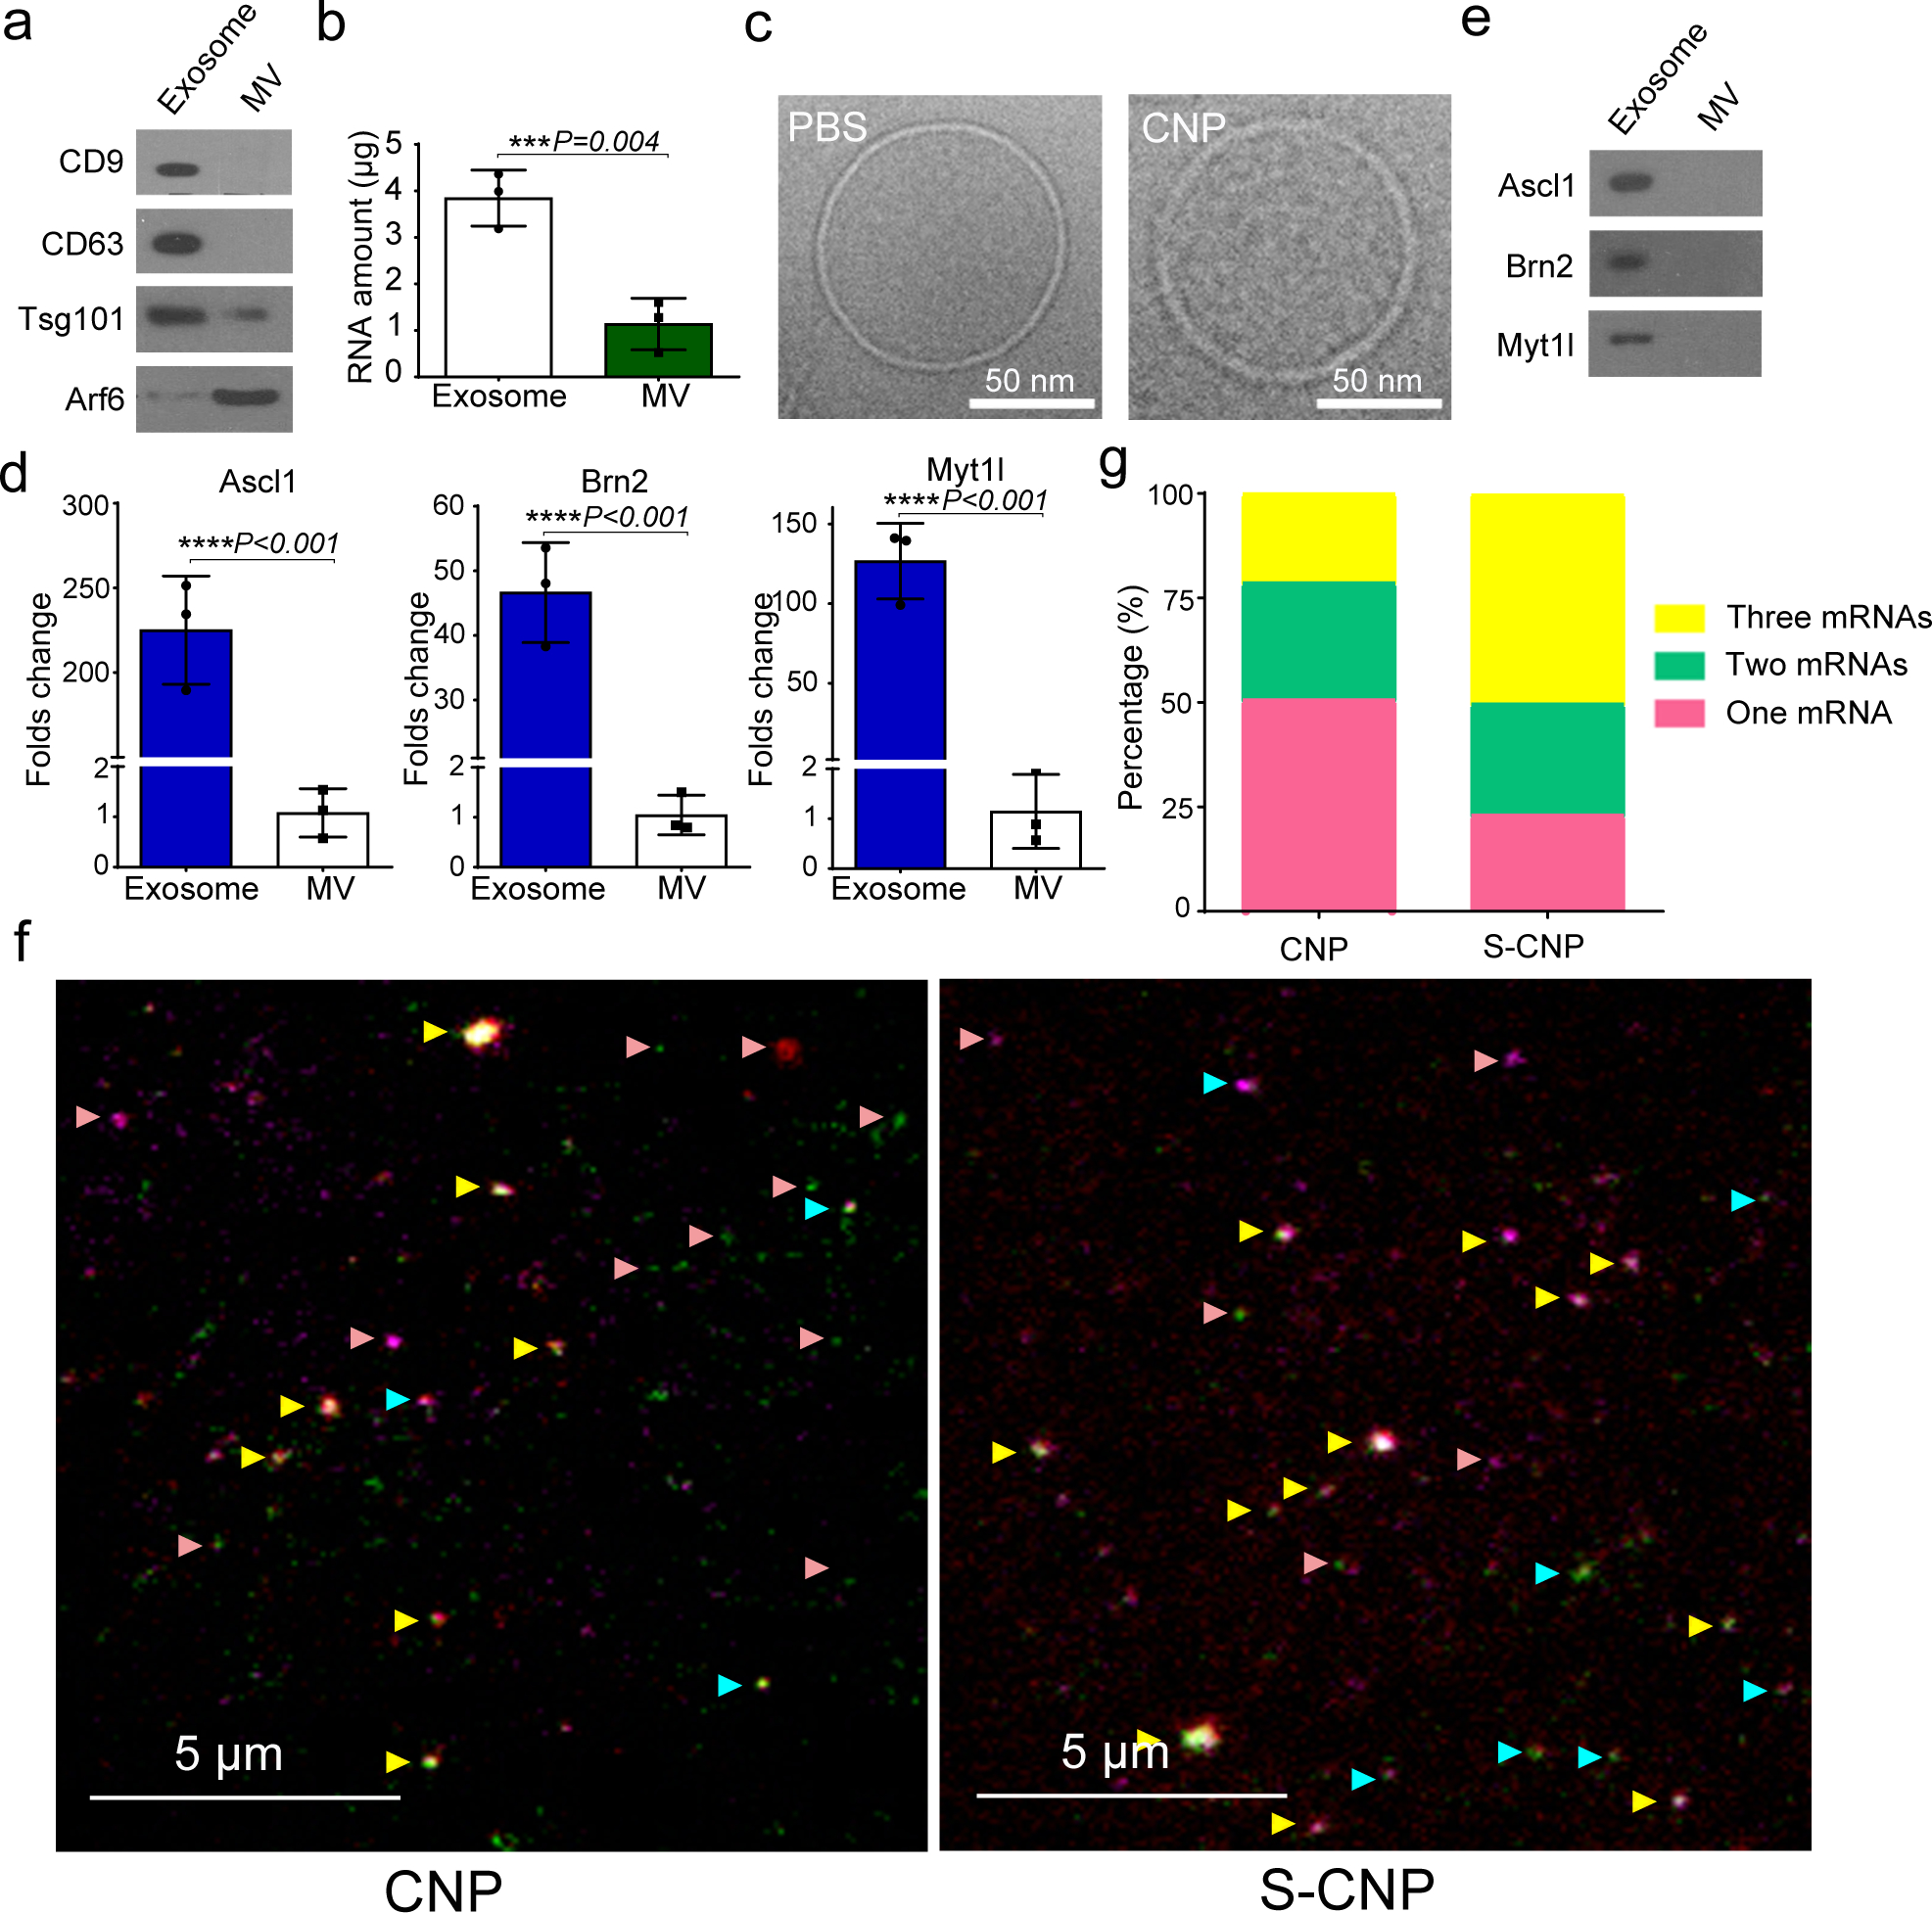
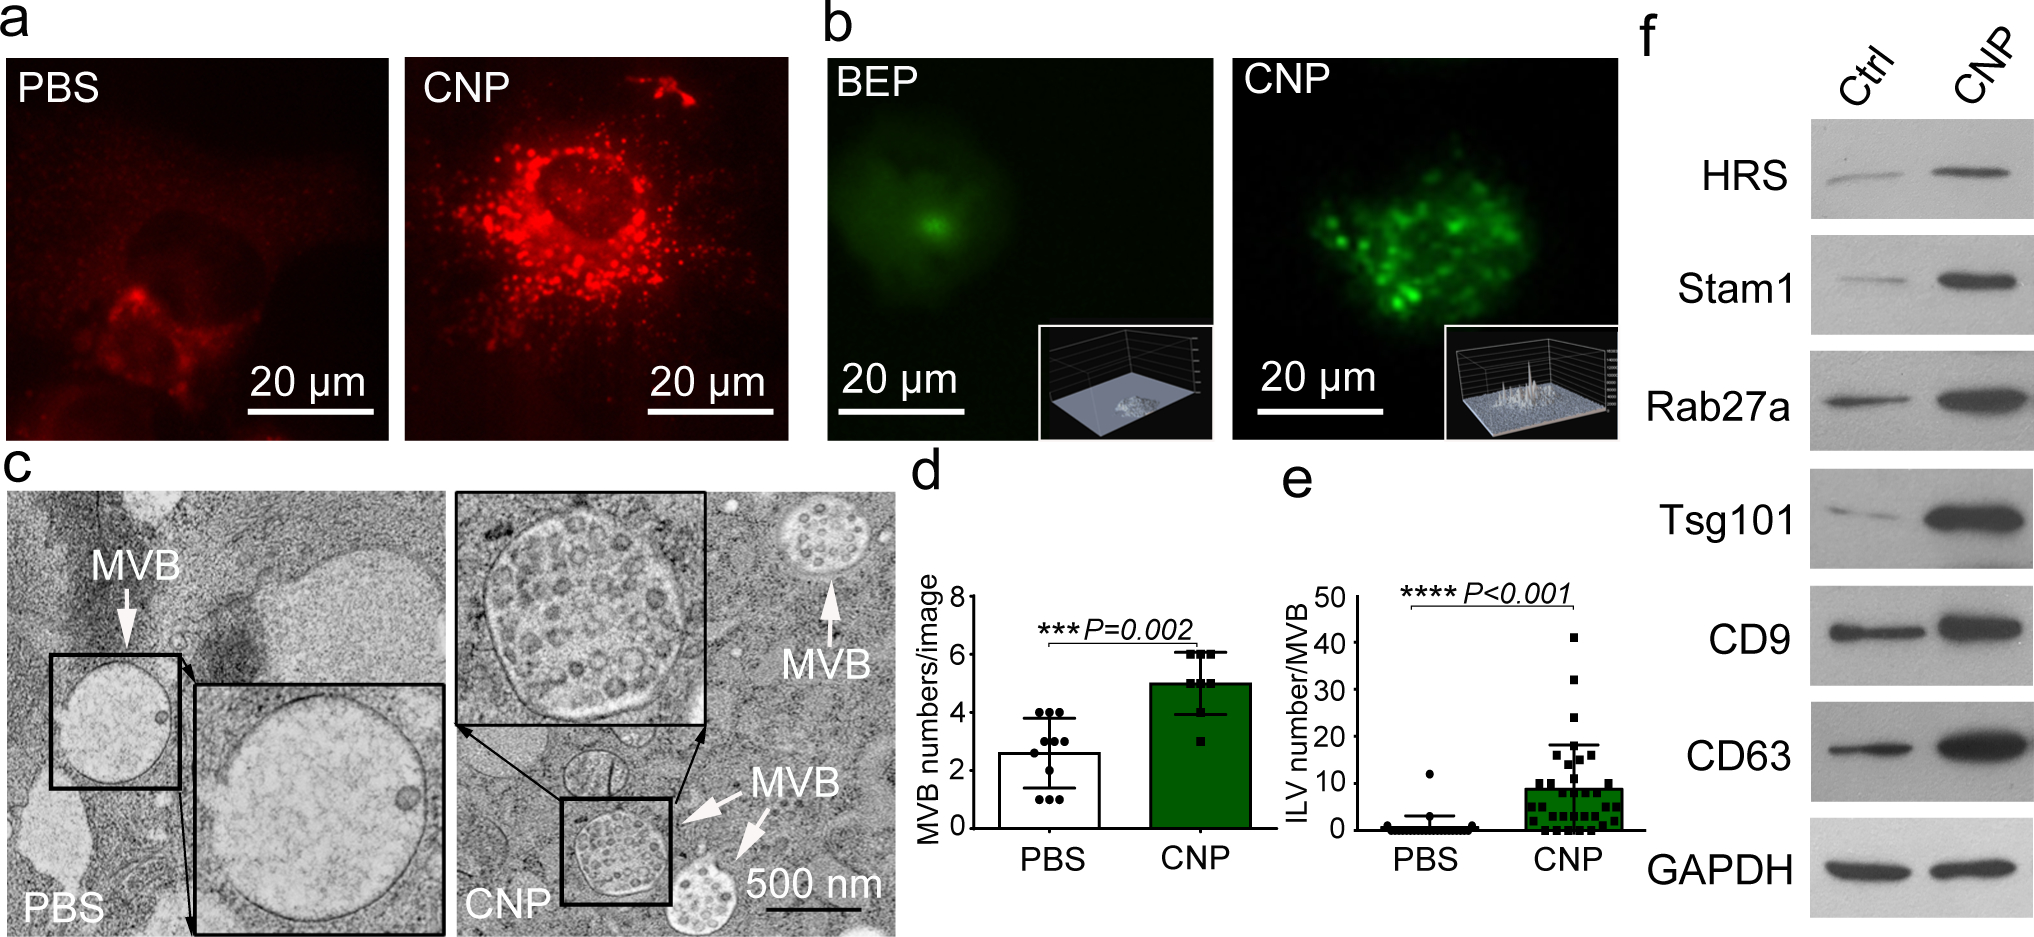
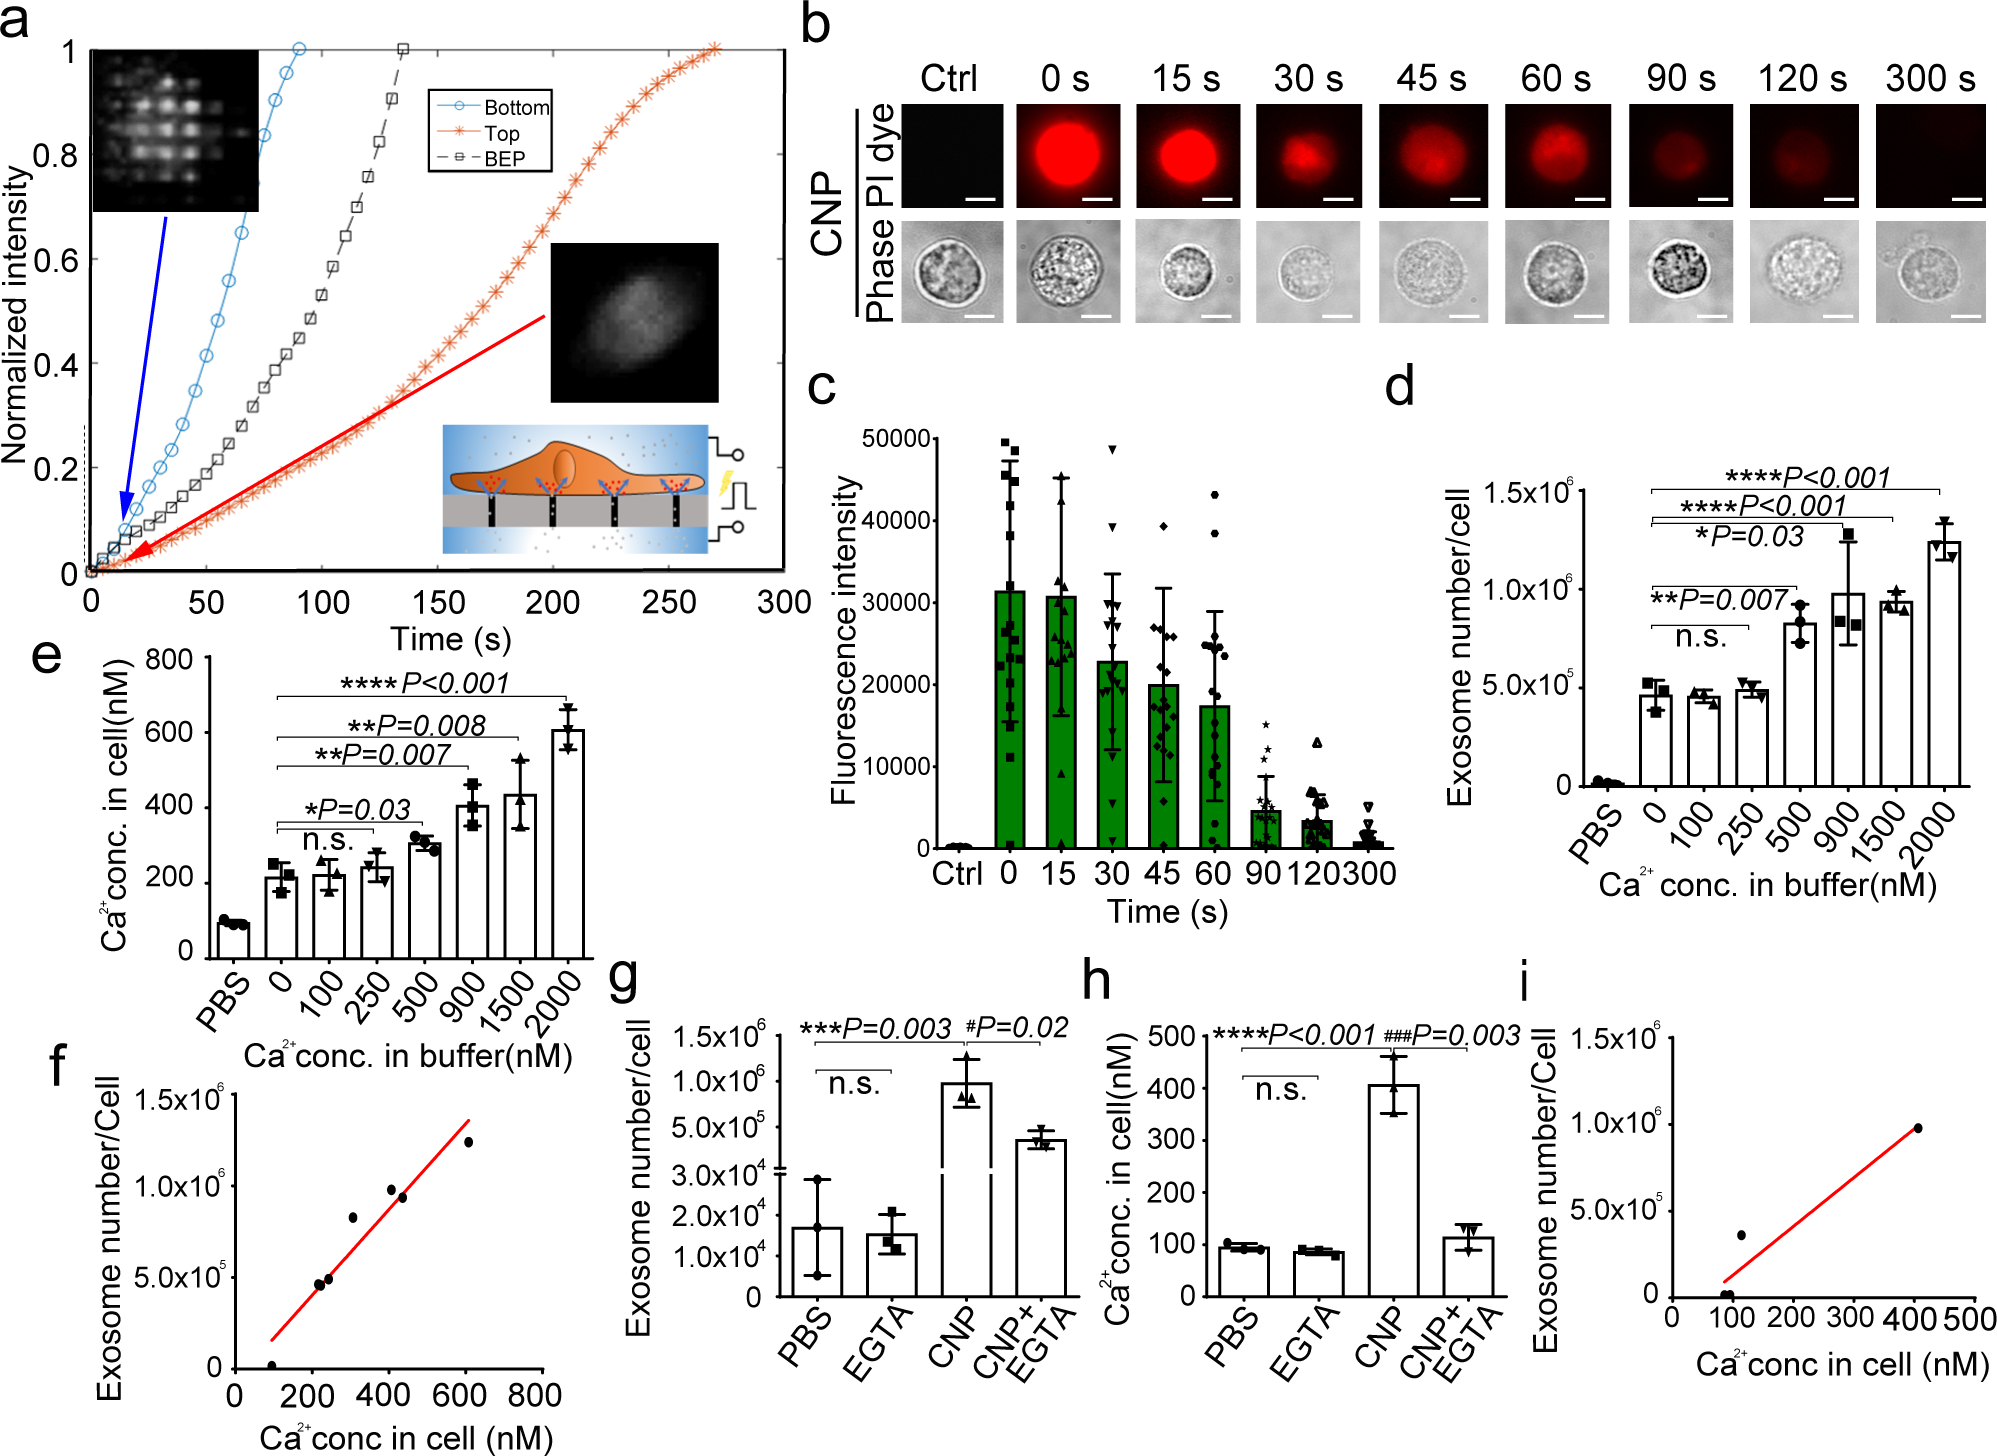
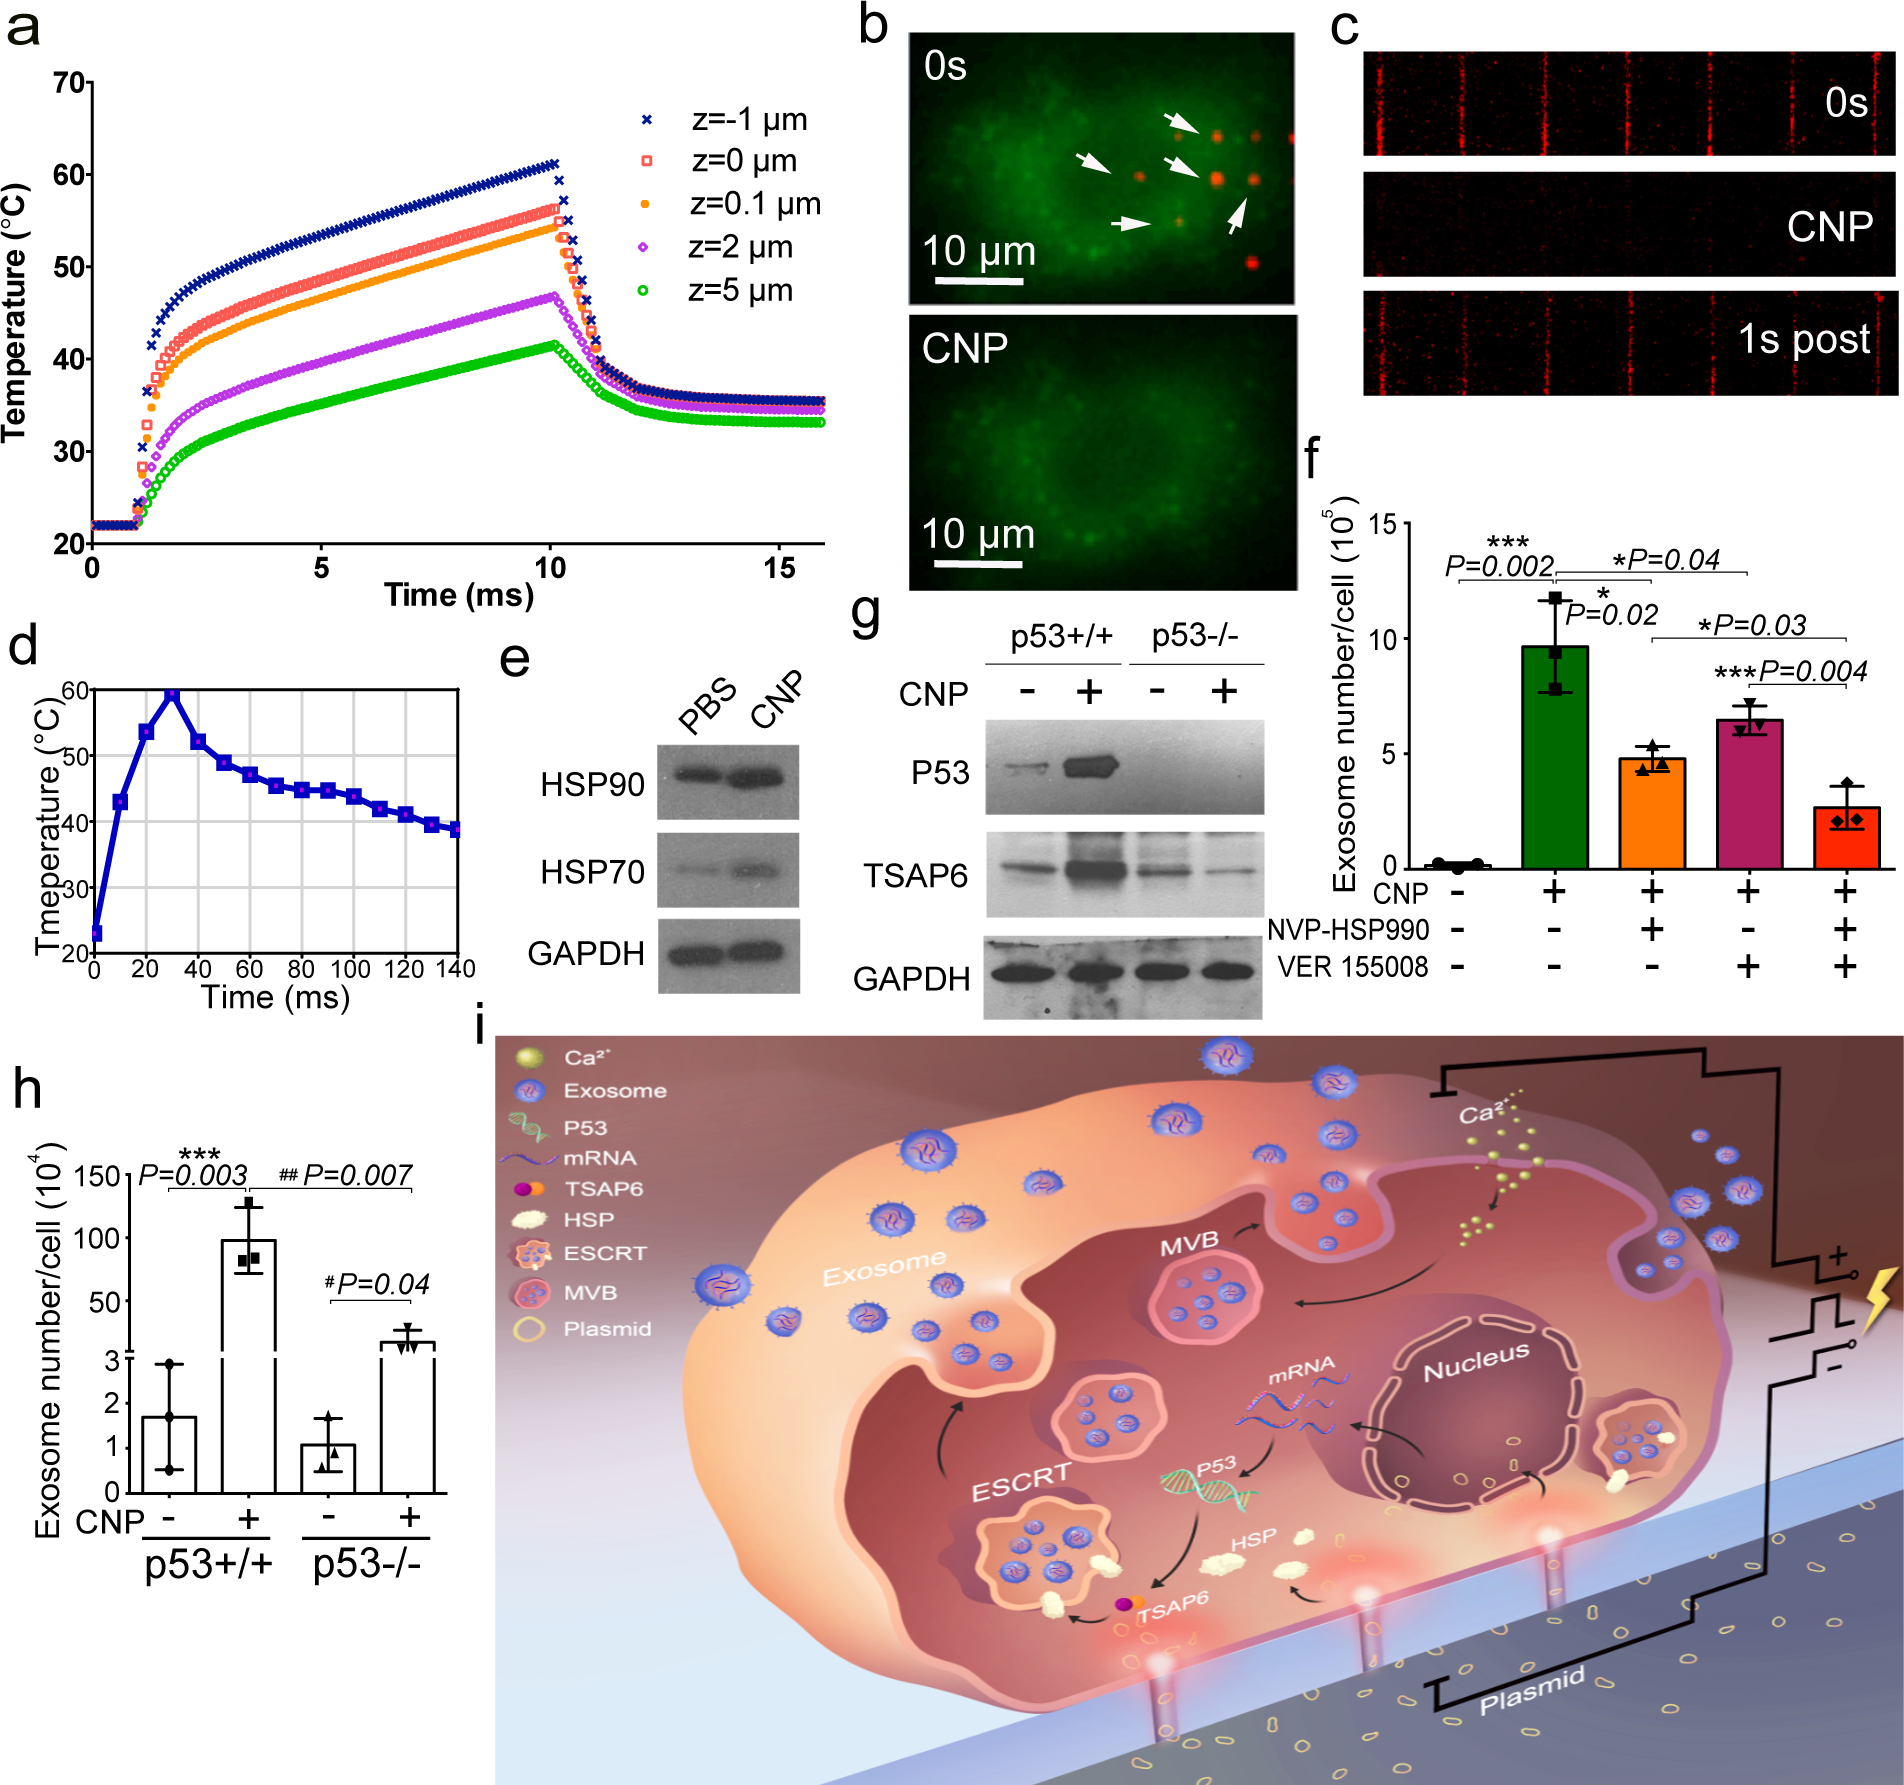
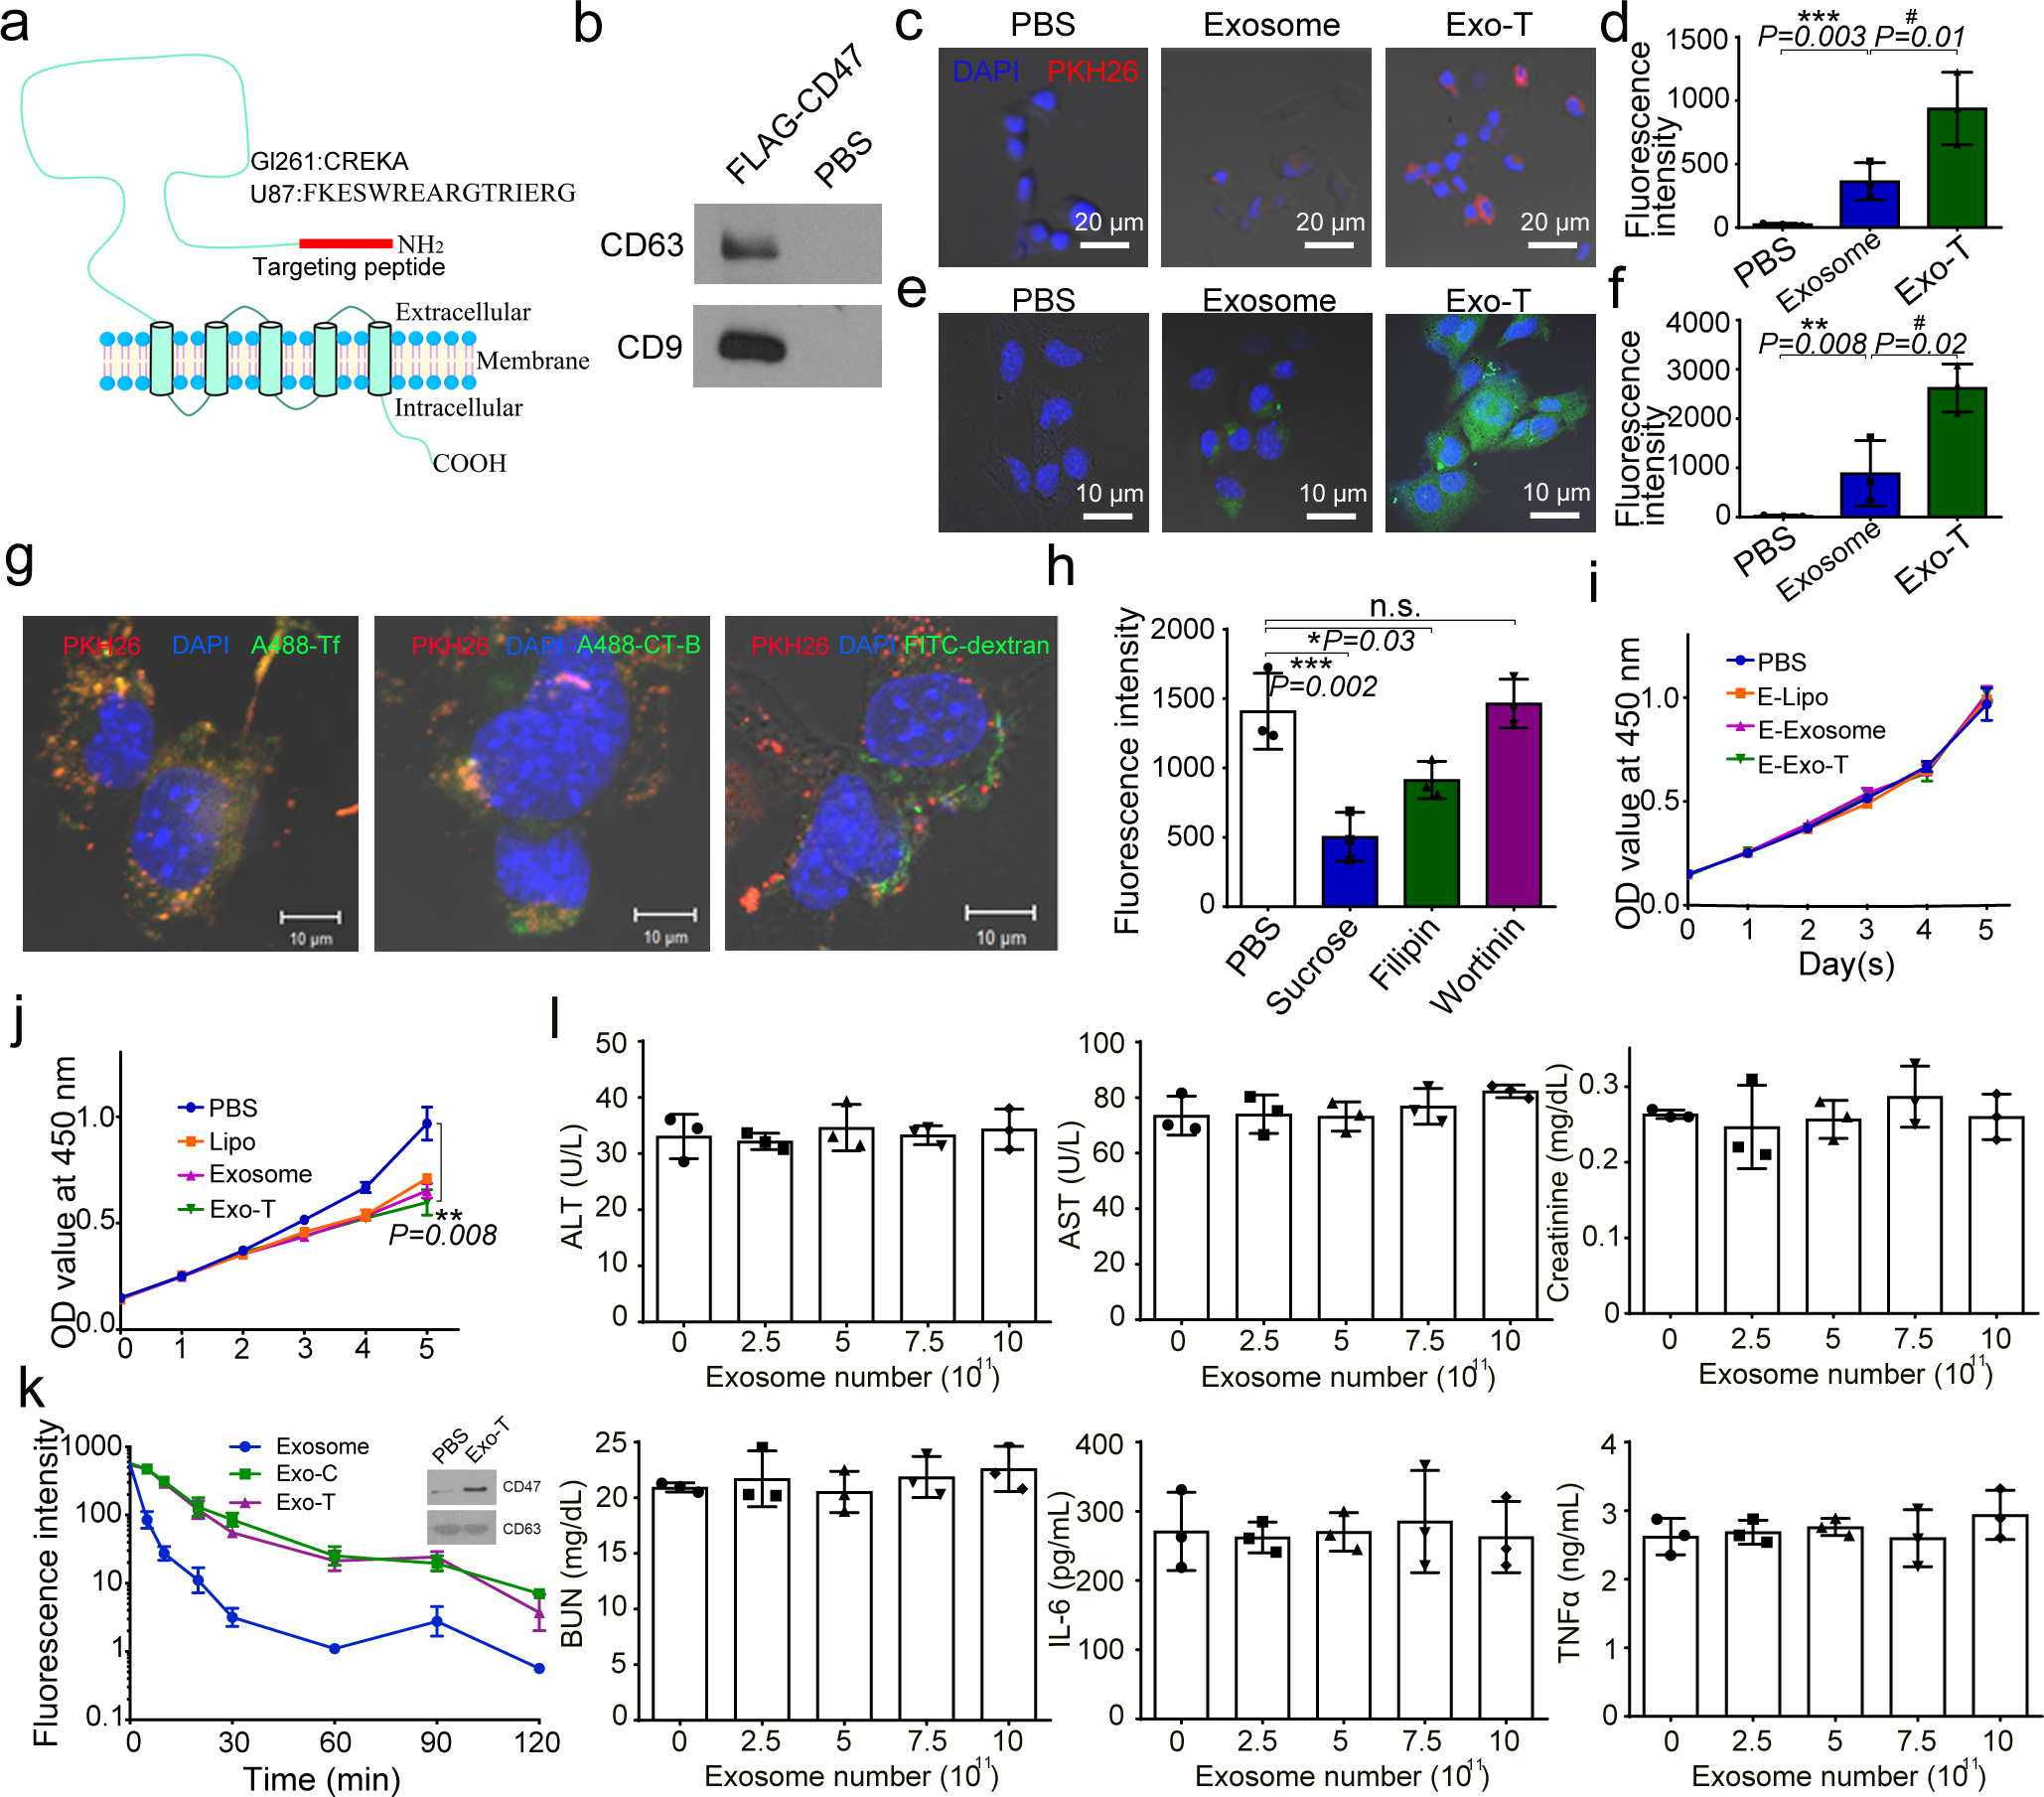
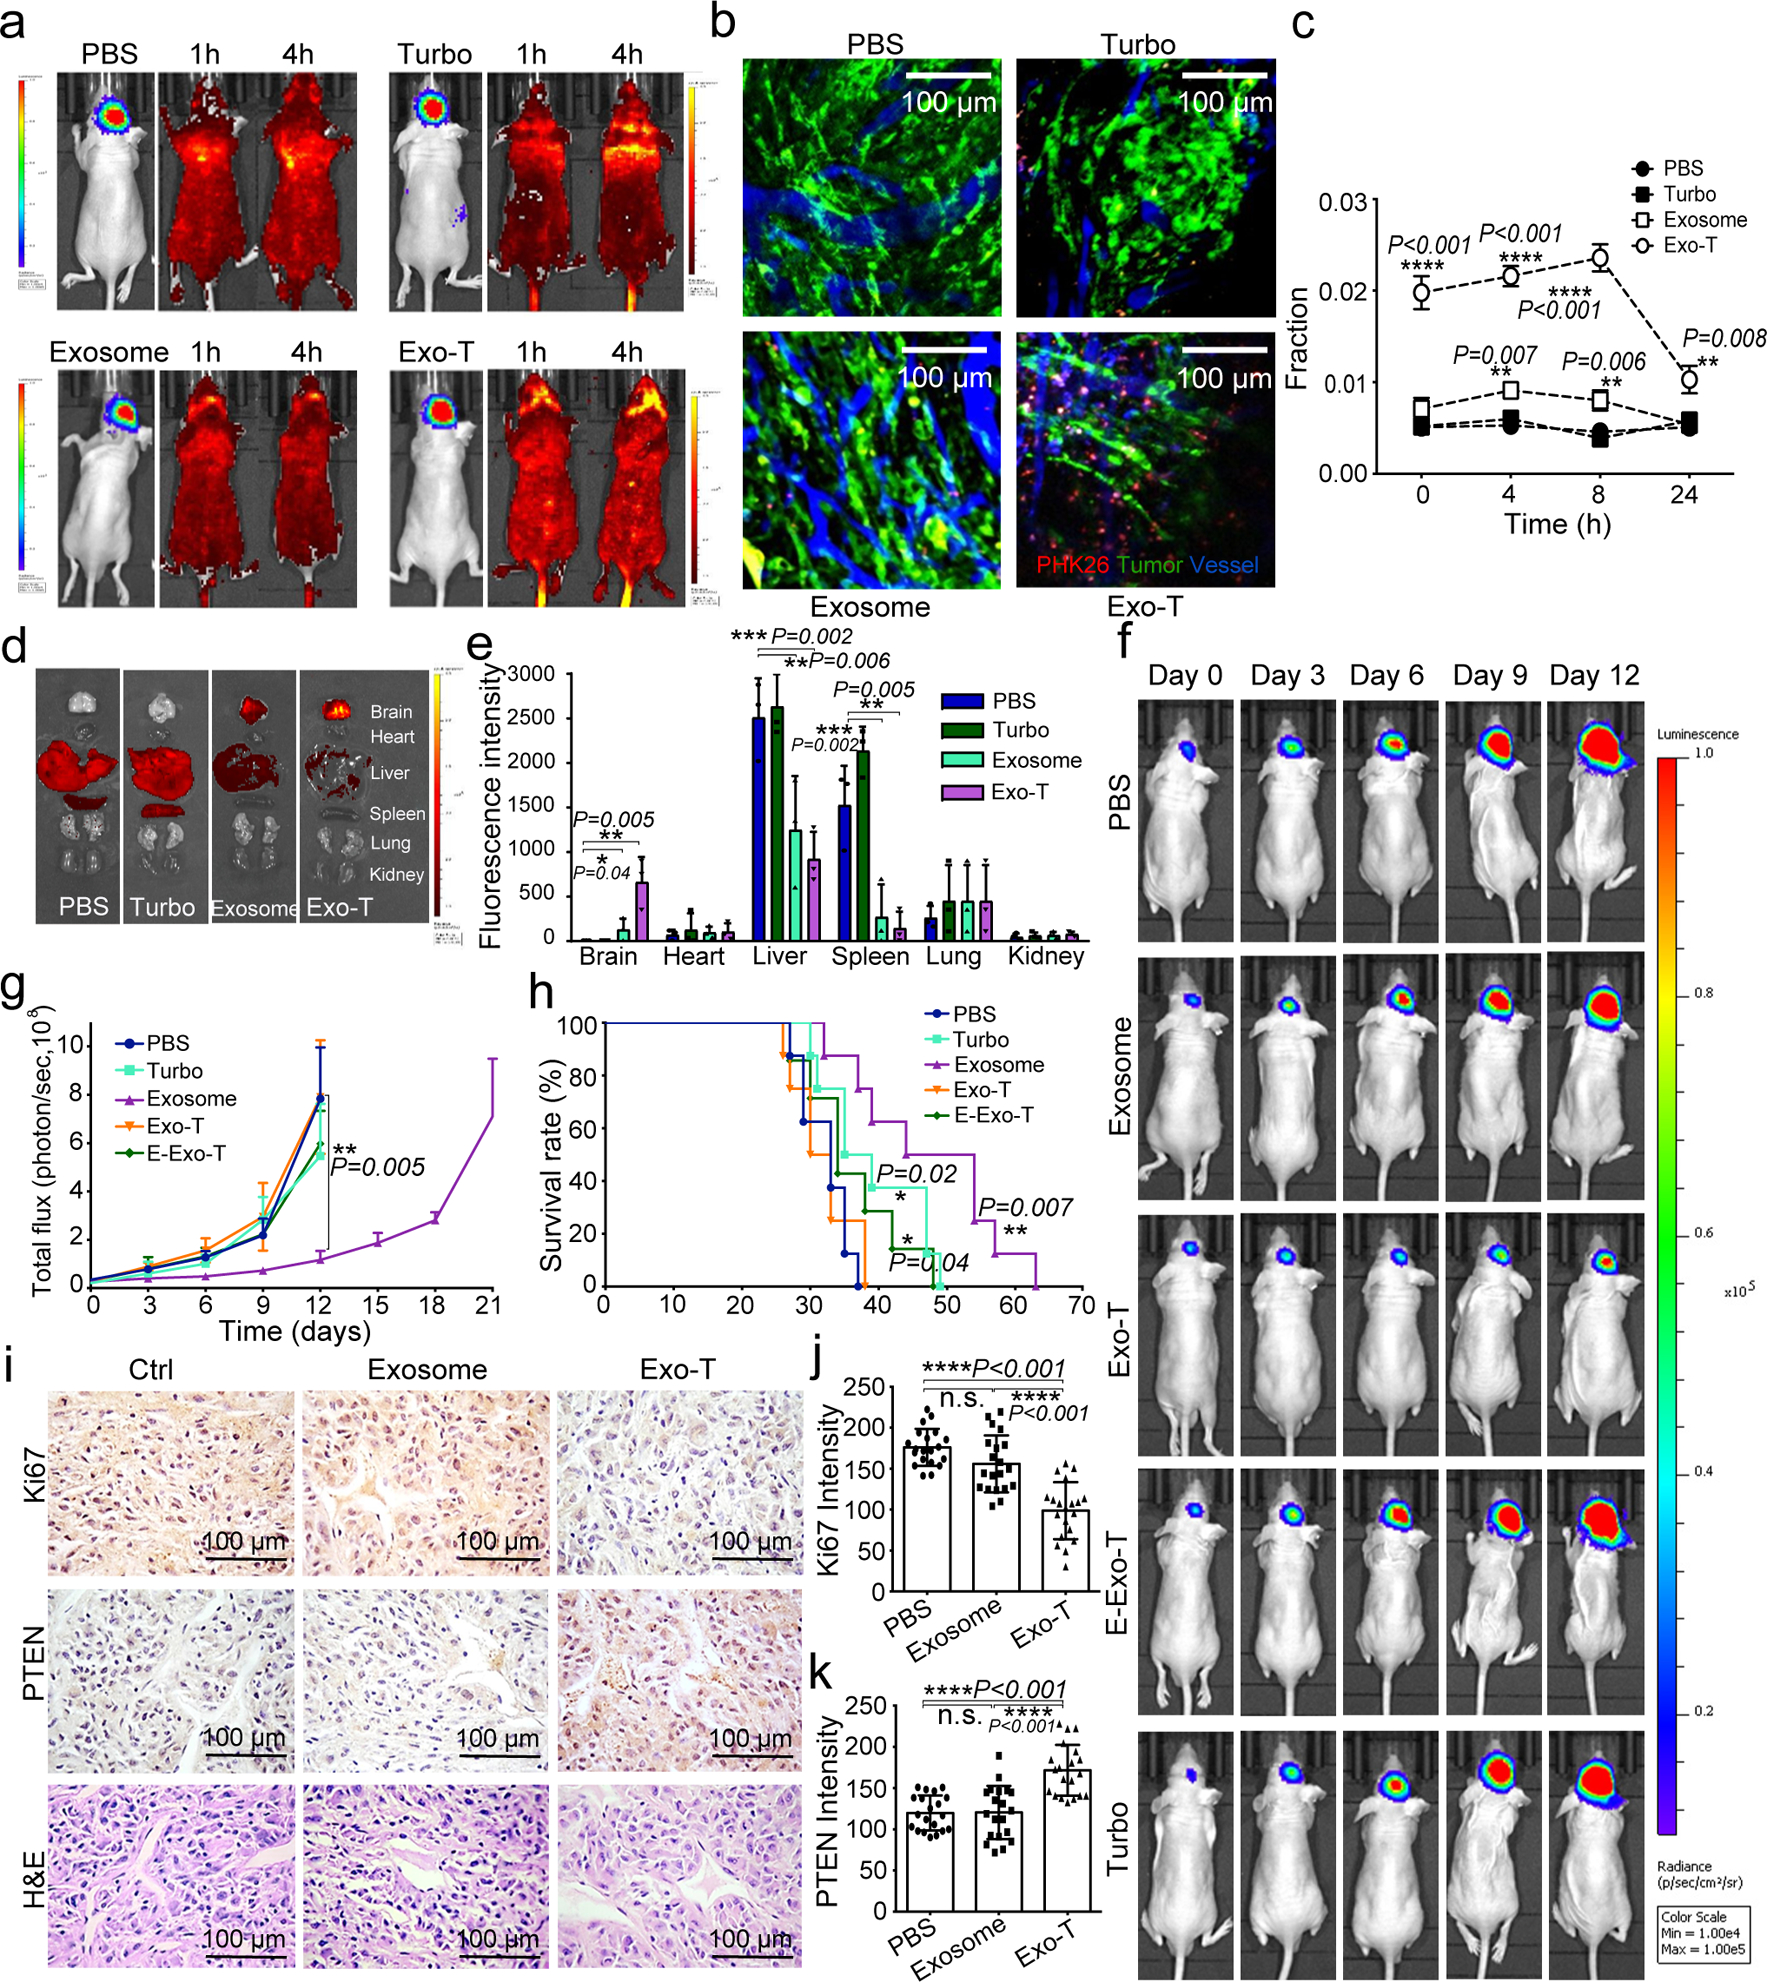
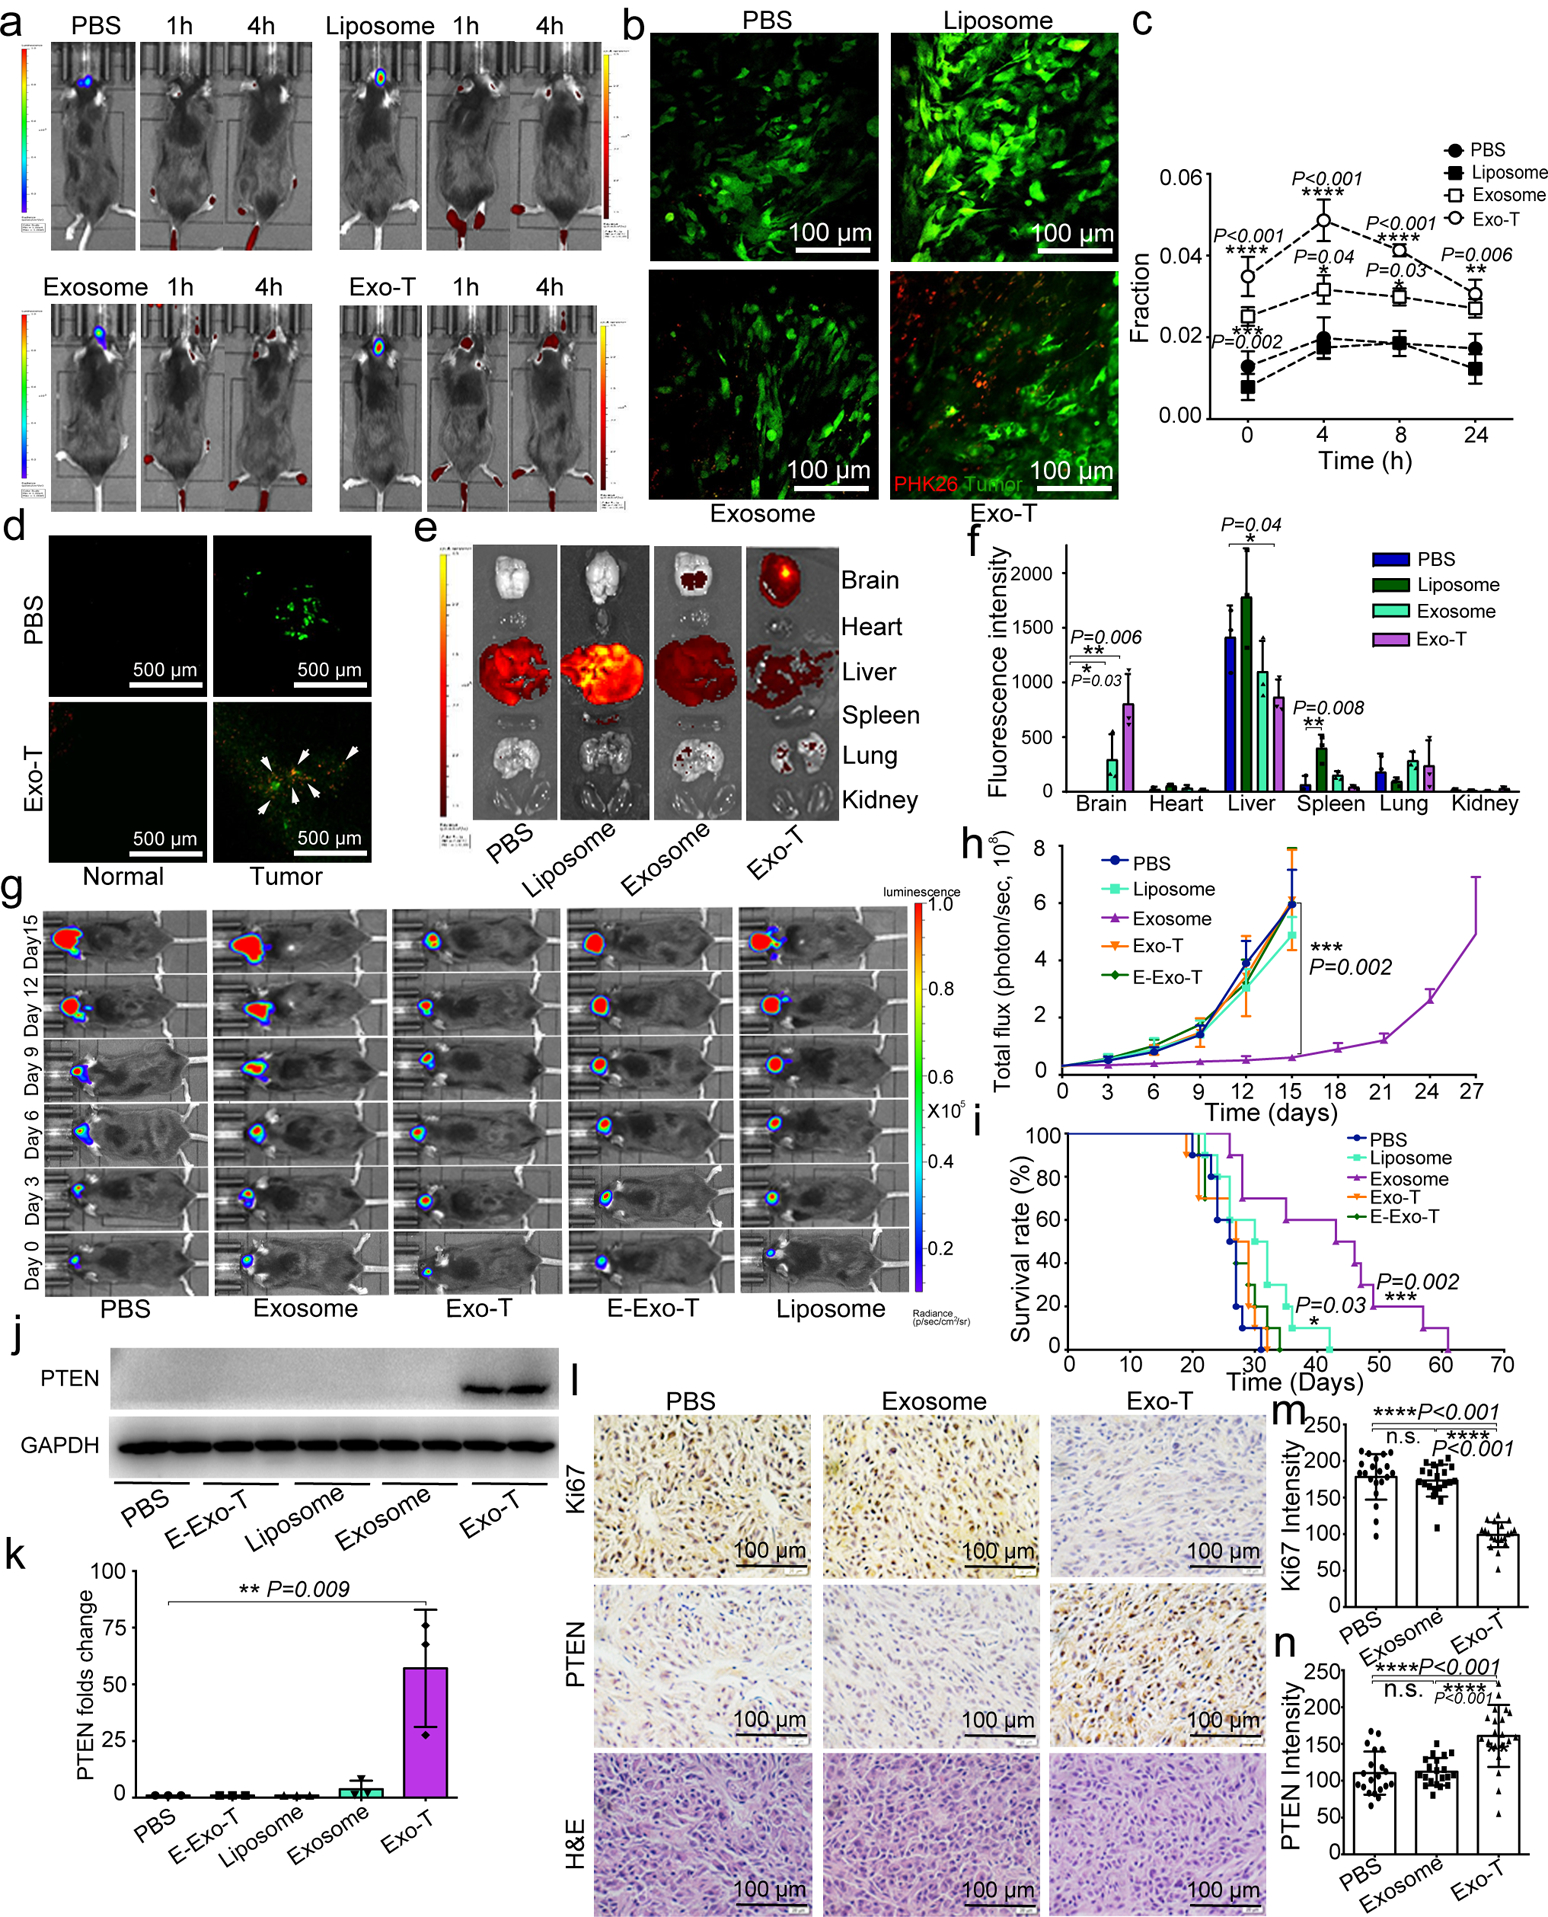
Exosomes are attractive as nucleic-acid carriers because of their favourable pharmacokinetic and immunological properties and their ability to penetrate physiological barriers that are impermeable to synthetic drug-delivery vehicles. However, inserting exogenous nucleic acids, especially large messenger RNAs, into cell-secreted exosomes leads to low yields. Here we report a cellular-nanoporation method for the production of large quantities of exosomes containing therapeutic mRNAs and targeting peptides. We transfected various source cells with plasmid DNAs and stimulated the cells with a focal and transient electrical stimulus that promotes the release of exosomes carrying transcribed mRNAs and targeting peptides. Compared with bulk electroporation and other exosome-production strategies, cellular nanoporation produced up to 50-fold more exosomes and a more than 103-fold increase in exosomal mRNA transcripts, even from cells with low basal levels of exosome secretion. In orthotopic phosphatase and tensin homologue (PTEN)-deficient glioma mouse models, mRNA-containing exosomes restored tumour-suppressor function, enhanced inhibition of tumour growth and increased survival. Cellular nanoporation may enable the use of exosomes as a universal nucleic-acid carrier for applications requiring transcriptional manipulation.


Conflict of interest statement

Competing interests

The authors declare no competing interests.

Figures

Fig. 1 |
Fig. 1 |. CNP generates large quantities of extracellular vesicles (EVs) loaded with transcribed mRNAs.
a. Schematic representation of CNP generated EVs for targeted nucleic acid delivery. Left: The CNP system consists of a nanochannel array (red rectangles), with each channel measuring 500 nm in diameter (top inset). DNA plasmids added in buffer enter attached cells through nanochannels under transient electrical pulses. Attached cells subsequently release large quantities of exosomes containing transcribed mRNA that can be collected for tumour-targeted delivery via blood-brain barrier (BBB) and blood-brain tumour barrier (BBTB) (Right). b. EV number per cell produced by un-treated MEFs in PBS buffer (PBS), MEFs after treatment with Ascl1/Brn2/Myt1l (A/B/M) plasmids transfected with lipofectamine 2000 (Lipo), bulk electroporation (BEP), cellular nanoelectroporation (CNP), and CNP with only PBS buffer (CNP/PBS). c. Comparison of EV release by CNP versus traditional methods of stress-induced EV release, including starvation, hypoxia and heat treatment. Starvation: MEF cells were cultured in DEMEM without FBS; Hypoxia: MEF cells were cultured in a hypoxia chamber at 1%O2/5% CO2 at 37°C humidified environment; Heat: MEF cells were cultured at 42°C for 2h and then transferred to 37°C with normal cell culture conditions. d. EV number per cell produced by mouse bone marrow-derived dendritic cells (BMDCs) in different treatment groups, including PBS, Lipo, BEP, CNP, and CNP/PBS groups. e. Exosome release from CNP-transfected MEFs peaks around 8 hours post-CNP. f. DLS measurements of exosome concentration in MEFs by CNP at various voltages ranging from 0 to 220 V. Results show that the exosome number does not increase when the voltage is increased from 200 to 220 V. g. Agarose gel analysis of EV-mRNAs collected from EVs after CNP. CNP/PBS: Total RNAs harvested from 107 MEFs after CNP with only PBS buffer; PTEN mRNA: 200 ng synthesized PTEN mRNA; CNP/PTEN: Total RNAs (~1.0 μg) harvested from 107 MEFs after CNP with PTEN plasmid. h. qPCR of A, B, and M mRNA reveals that exosomes produced by CNP contain much larger quantities of transcribed mRNAs than exosomes produced by other methods. i. qPCR of EV A, B and M mRNA from CNP-transfected MEFs (in culture medium replaced every 4h for 24h) shows that the largest transcript takes the longest amount of time to reach peak concentration. All data are from three independent experiments and are presented as mean ± s.e.m., two-sided Student’s t-test was performed for the comparison (b, c, d, f, h).
Fig. 2 |
Fig. 2 |. Exosomes, rather than microvesicles (MVs), contain functionally transcribed mRNAs after CNP transfection.
a. Detection of exosome markers (CD9, CD63, and Tsg101) and MV marker (Arf6) in the same amount (20 μg protein) of exosomes and MVs by Western blot. b. RNA amount encapsulated in exosomes vs. encapsulated in MVs produced by 108 CNP-transfected MEFs as measured by Nanodrop, indicating that most RNA is contained in exosomes, not MVs. c. Cryo-TEM images of exosomes from PBS group (PBS) and CNP group (CNP) show no differences in the appearance of exosomes obtained from these two groups, but exosomes from the CNP group contain higher RNA content. d. qPCR of A, B and M mRNA from exosomes and MVs shows that most of the transcribed mRNAs are contained in exosomes. e. In vitro protein translation from mRNAs extracted from exosomes and MVs secreted by CNP-transfected MEFs. f. Representative TIRF images of TLN assay in CNP and S-CNP groups show that S-CNP can optimize the loading of different mRNAs into individual exosomes. Green dot: Ascl1 mRNA, red dots: Brn2 mRNA, purple dots: Myt1l mRNA, pink arrow: exosomes with 1 mRNA, turquoise arrow: exosomes with 2 mRNAs, yellow arrow: exosomes with 3 mRNAs. g. Percentage of exosomes with different RNAs in CNP and S-CNP groups. One hundred images in each group were chosen for statistical analysis. All the other data are from three independent experiments and are presented as mean ± s.e.m., two-sided Student’s t-test was performed for the comparison (b, d).
Fig. 3 |
Fig. 3 |. CNP induced multivesicular bodies (MVBs) formation.
a. Epi-fluorescence images show increased intracellular vesicle formation in MEFs with CNP/PBS stimulation as measured by red fluorescence spots from PKH26 dye. b. CNP/PBS-porated MEFs (CNP) increased the number of multivesicular bodies (MVBs) containing CD63-GFP as compared to BEP. Insets: 3D intensity profiles in which peaks represent bright spots in images indicating active MVB formation. c. Transmission electron microscopy (TEM) images of MEFs with or without CNP/PBS stimulation contain different quantities of MVBs and interluminal vesicles (ILVs). Quantification of MVBs (d) and ILVs (e) in MEFs with or without CNP/PBS stimulation. n=20 TEM images for each group, and two-sided Student’s t-test was performed for the comparison. f. Western blot shows that proteins implicated in exosome biogenesis are increased after CNP.
Fig. 4 |
Fig. 4 |. CNP-induced exosome secretion is associated with Ca2+ ion influx after CNP
a. Longitudinal fluorescence intensity measurement of propidium iodide (PI) diffusion across membrane pores in BEP- and CNP-porated MEFs with PBS buffer. Rapid increase in PI intensity at the attached surface of the cell (top insert) indicates formation of an array of large pores, whereas a much slower PI increase at the contralateral cell surface (bottom insert) indicates formation of smaller pores. BEP-porated MEFs show an intermediate increase in PI intensity. b. Fluorescence images of cells after CNP indicate that membrane pores formed during CNP close between 1 to 2 minutes after transfection. PI is applied to the cells at indicated time points after CNP. c. Fluorescence intensity measurement of cells further confirms membrane pores close within 2 minutes following CNP. n=20 cells for each group. d. Exosome number per cell produced by MEFs at various calcium ion concentrations after CNP. e. Intracellular calcium ion concentration after CNP at various calcium ion concentrations in buffer. f. Correlation of exosome release with intracellular calcium ion concentration after CNP. g. Exosome number per cell produced by MEF at various calcium ion concentrations after CNP with the presence of calcium chelator, EGTA. h. Calcium ion concentration inside the cells after CNP at various calcium ion concentrations in buffer with the presence of EGTA. i. Correlation of exosome release with intracellular calcium ion concentration after CNP with the presence of EGTA. All the other data are from three independent experiments and are presented as mean ± s.e.m., two-sided Student’s t-test was performed for the comparison (d, e, g, h).
Fig. 5 |
Fig. 5 |. CNP increases exosome release through HSP-P53-TASP6 signaling pathway.
a. Simulated temperature changes at 5 chosen locations. A 200 V and 10 ms pulse created a localized “hot spot” in the nanochannel outlet with a power density of ~1 × 10¹⁴ W/m3 and a peak temperature up to 60°C from ambient temperature. Once the pulse ended, the ”hot spot” vanished rapidly due to the extremely small volume of the heated fluid inside the nanochannel (Vnanochannel ≈ 1 × 10⁻¹² cm3) compared to the bulk solution outside the nanochannel (Vbulk ≈ 0.1 cm3). b. Top-down images of MEFs (green) attaching to the CNP device surface. Prior to CNP transfection (0s), red dots show nanochannel locations and room temperature. CNP electric pulse (CNP) sharply increases temperature at the nanochannel/cell surface interface. c. Cross-section view of nanochannels shows temperature changes within the nanochannels before (0s), during and after (1s) a CNP pulse. d. Temperature at the cell-nanochannel interface transiently (<1s) increases to ~60°C. e. Western blot of HSP90 and HSP70 from un-treated (PBS) and CNP/PBS-stimulated (CNP) MEFs. f. Dynamic light scattering (DLS) measurements of exosome concentrations of 108 CNP-stimulated MEFs with or without HSP inhibitors show that HSP70 and HSP90 are critical to the production of exosomes. NVPHSP990: HSP90 inhibitor; VER155008: HSP70 inhibitor. g. Western blot results show that CNP increases the P53 and TSAP6 protein expression in P53 WT MEFs, but it does not affect the P53 or TSAP6 protein expression in p53−/− MEFs. h. Dynamic light scattering (DLS) measurements of exosome concentrations show that knockdown of P53 can partially block exosome release after CNP. i. Schematic of a proposed mechanism for how CNP triggers exosome release in CNP-transfected cells. Data are from three independent experiments and are presented as mean ± s.e.m. Two-sided Student’s t-test was performed for the comparison.
Fig. 6 |
Fig. 6 |. In vitro study of CNP-generated exosomes for gene therapy and immunogenicity evaluation in mice.
a. Schematic representation of GBM targeting peptide cloned into the N-terminal of CD47 transmembrane protein. b. Western blots of exosome pulldown assay show that FLAG beads can pull down the N-terminal cloned FLAG-CD47, suggesting that the N-terminal of CD47 is outside of the exosomes. c. Increased uptake of CNP-generated exosomes coated with a brain tumour targeting peptide linked to CD47 by glioma (GL261) cells. Exosome: uncoated exosomes. Exo-T: exosomes generated from CNP stimulated BMDCs transfected with CREKA-CD47 plasmid. d. Fluorescence intensity of PKH26-labeled Exo-T taken up by GL261 as assessed by flow cytometry further confirms that Exo-T has the best uptake in GL261 cells. e. Representative confocal microscopy images of PTEN staining in GL261 cells 24h after PBS, exosome or Exo-T treatments. f. Flow cytometry measurement of fluorescence intensity of PTEN staining 24 hours after incubating GL261 with exosomes shows that the Exo-T group has stronger PTEN protein expression. g. Representative immunostaining images of co-localization of PKH26-labeled Exo-T vesicles (red) with different endocytosis markers (green). Results indicate that most Exo-Ts are co-localized with A488-Tf, suggesting that Exo-Ts are mainly taken up through clathrin-dependent endocytosis. A488-Tf: Clathrin-dependent endocytosis marker; A488-CT-B: Caveolae-dependent endocytosis marker; and FITC-dextran: Macropinocytosis marker. h. Fluorescence intensity of PKH26-labeled Exo-T taken up by GL261 under different inhibition conditions by flow cytometry further confirms that Exo-Ts are primarily taken up through clathrin-dependent endocytosis. Sucrose: Clathrin-dependent endocytosis inhibitor; Filipin: Caveolae-dependent endocytosis inhibitor; and Wortinin: Macropinocytosis inhibitor. i. GL261 cell viability treated by empty lipofectamine (E-Lipo), exosome and Exo-T suggests good biocompatibility of the Exo-T. j. GL261 cell viability treated by lipofectamine, exosome and Exo-T containing PTEN mRNA. k. Circulatory half-life of systemically administered PKH26-labeled exosomes in mice. Overexpression of CD47 protein greatly extends the circulatory half-life of exosomes, which is not affected by the insertion of CREKA peptide. Exo-C: exosomes from CNP/CD47 plasmid-transfected BMDCs. Exo-T: exosomes from CNP/CREKA-CD47 plasmid-transfected BMDCs. Inset: Confirmation of CD47 protein expression in exosomes from BMDCs transfected with CREKA-CD47 plasmid. l. AST, ALT, creatinine, BUN, IL6 and TNFα levels measured by ELISA with administration of different doses of CREKA-CD47 targeted exosomes (Exo-Ts). All the data are from three independent experiments and are presented as mean ± s.e.m., two-sided Student’s t-test was performed for the comparison (d, f, h, i, j, k, l).
Fig. 7 |
Fig. 7 |. In vivo therapeutic efficacy of CNP-generated exosomes in a U87 orthotopic glioma model.
a. In vivo imaging showing preferential accumulation of PKH-26 labeled Exo-T within orthotopically implanted U87 tumours in nude mice. The targeted delivery of Exo-T into brain tumours is also confirmed by intravital fluorescence microscopy (b) which shows significantly increased accumulation of Exo-T within the tumour stroma as compared with uncoated exosomes (exosome) or TurboFect nanoparticles (Turbo). c. Quantification of exosome intensity in the tumour site at various time points. Ten images per animal with 3 mice per group. d,e. Tissue distribution analyses show that Exo-T exhibits increased brain targeting with low hepatic and splenic accumulation. f,g. Tumour growth inhibition by PBS, PTEN mRNA containing exosomes (exosome), Exo-T, empty Exo-T (E-Exo-T), or TurboFect nanoparticles (Turbo) treatment via tail vein injection. n=3 mice per group. h. PTEN mRNA Exo-T extends the survival of mice with U87 glioma (p<0.001, Log-rank test after Bonferroni correction). n=8 mice per group. i. PTEN, Ki67 and H&E staining of residual GBM tumour tissue with different treatments shows that Exo-T restores the PTEN expression and inhibits cell proliferation in tumour tissue. j. Ki67 intensity measurement of IHC images by ImageJ software. k. PTEN intensity measurement of IHC images by ImageJ software. Data are from three independent experiments unless otherwise stated and are presented as mean ± s.e.m. All the data are from three independent experiments and are presented as mean ± s.e.m., two-sided Student’s t-test was performed for the comparison (c, e, g, h, j, k).
Fig. 8 |
Fig. 8 |. In vivo therapeutic efficacy of CNP-generated exosomes in a GL261 orthotopic glioma model.
a. In vivo imaging showing preferential accumulation of PKH-26 labeled Exo-T within orthotopically implanted GL261 tumours in C57BL/6 mice. The targeted delivery of Exo-T into brain tumours is also confirmed by intravital fluorescence microscopy (b), which shows significantly increased accumulation of Exo-T within the tumour stroma as compared with uncoated exosomes (exosome) or PEG-liposome nanoparticles (Liposome). c. Quantification of exosome intensity in the tumour site at various time points. d. Distribution of PBS (Top row) and Exo-T (Bottom row) conjugated with PHK26 within normal tissue area and tumour area; scale bar: 500 μm. e, f. Tissue distribution analyses show that Exo-T exhibits increased brain targeting with low hepatic and splenic accumulation. g. h. Tumour growth inhibition by PBS, PTEN mRNA containing exosomes (exosome), Exo-T, empty Exo-T (E-Exo-T), or PEG-liposome nanoparticles (Liposome) treatment via tail vein injection. n=3 mice per group. i. PTEN mRNA Exo-T extends the survival of mice with GL261 glioma (p<0.001, Log-rank test after Bonferroni correction). n=8 mice per group. j, k. Western blots (j) and qPCR (k) of PTEN protein and mRNA levels respectively in GBM tumours, suggest the restoration of both PTEN protein and mRNA expression in PTEN-null GL261 GBM tumours. n=3 mice per group. l. PTEN, Ki67 and H&E staining of residual GBM tumour tissue with different treatments shows that Exo-T restores PTEN expression and inhibits cell proliferation in tumour tissue. m. Ki67 intensity measurement of IHC images by ImageJ software. n. PTEN intensity measurement of IHC images by ImageJ software. Data are from three independent experiments unless otherwise stated and are presented as mean ± s.e.m. Two-sided Student’s t-test was performed for the comparison (c, f, h, i, k, m, n).

Comment in

  • Functional extracellular vesicles aplenty.
    Zickler AM, El Andaloussi S. Zickler AM, et al. Nat Biomed Eng. 2020 Jan;4(1):9-11. doi: 10.1038/s41551-019-0507-z. Nat Biomed Eng. 2020. PMID: 31937938 No abstract available.

References

    1. Fraietta JA et al. Disruption of TET2 promotes the therapeutic efficacy of CD19-targeted T cells. Nature 558, 307–312 (2018). - PMC - PubMed
    1. Borducchi EN et al. Ad26/MVA therapeutic vaccination with TLR7 stimulation in SIV-infected rhesus monkeys. Nature 540, 284–287 (2016). - PMC - PubMed
    1. Dickson D UK scientists test liposome gene therapy technique. Nature 365, 4 (1993). - PubMed
    1. Lam FC et al. Enhanced efficacy of combined temozolomide and bromodomain inhibitor therapy for gliomas using targeted nanoparticles. Nature communications 9, 1991 (2018). - PMC - PubMed
    1. Sun T et al. Closed-loop control of targeted ultrasound drug delivery across the blood-brain/tumor barriers in a rat glioma model. Proceedings of the National Academy of Sciences of the United States of America 114, E10281–E10290 (2017). - PMC - PubMed

Publication types