. 2020 Feb;38(2):199-209.
doi: 10.1038/s41587-019-0322-9. Epub 2019 Dec 16.

A large peptidome dataset improves HLA class I epitope prediction across most of the human population

Affiliations

A large peptidome dataset improves HLA class I epitope prediction across most of the human population

Siranush Sarkizova et al. Nat Biotechnol. 2020 Feb.

Abstract

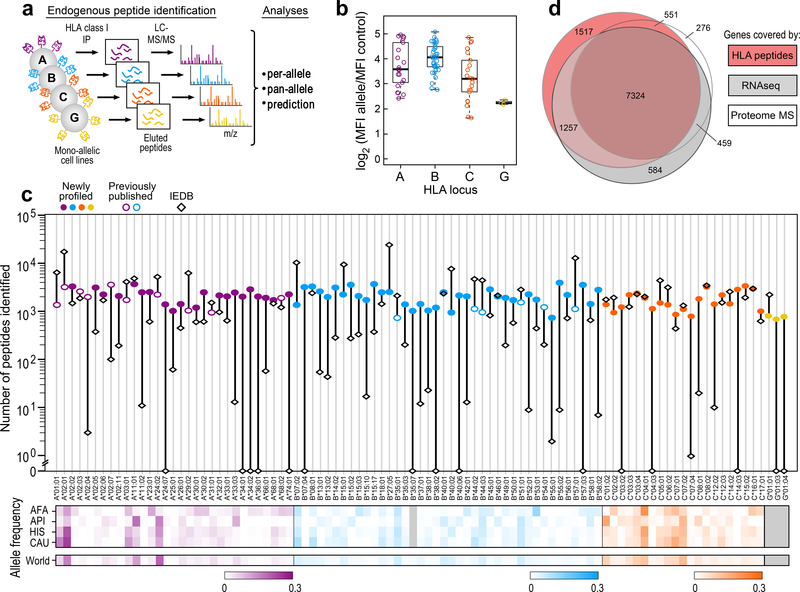
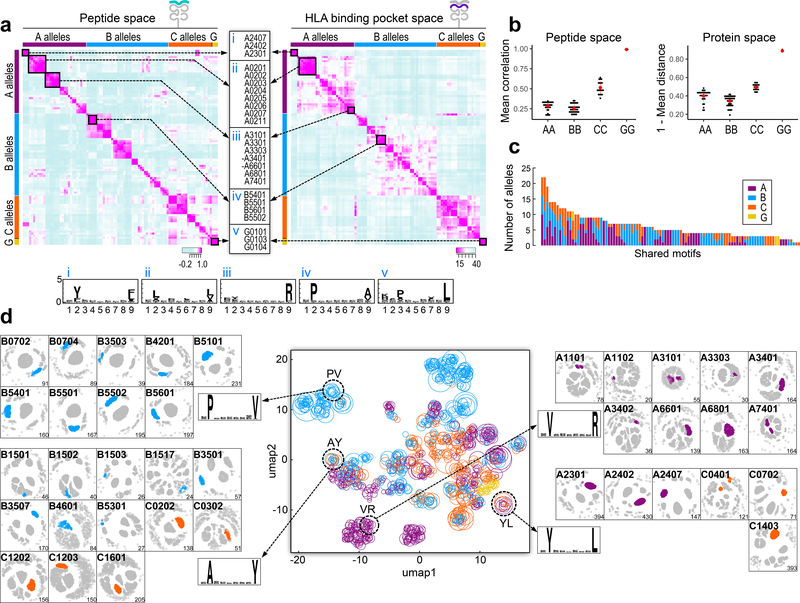
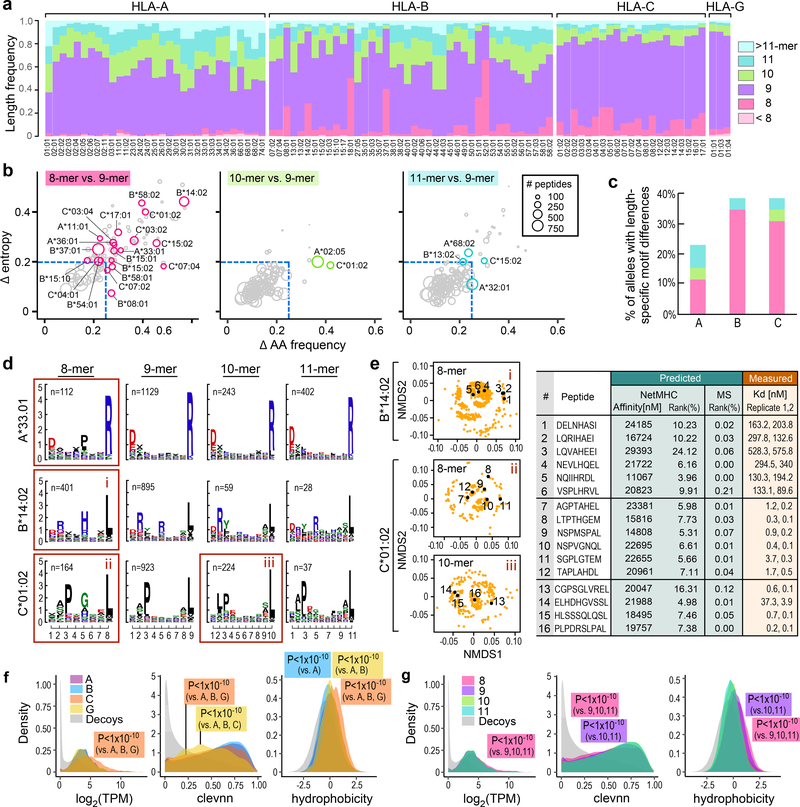
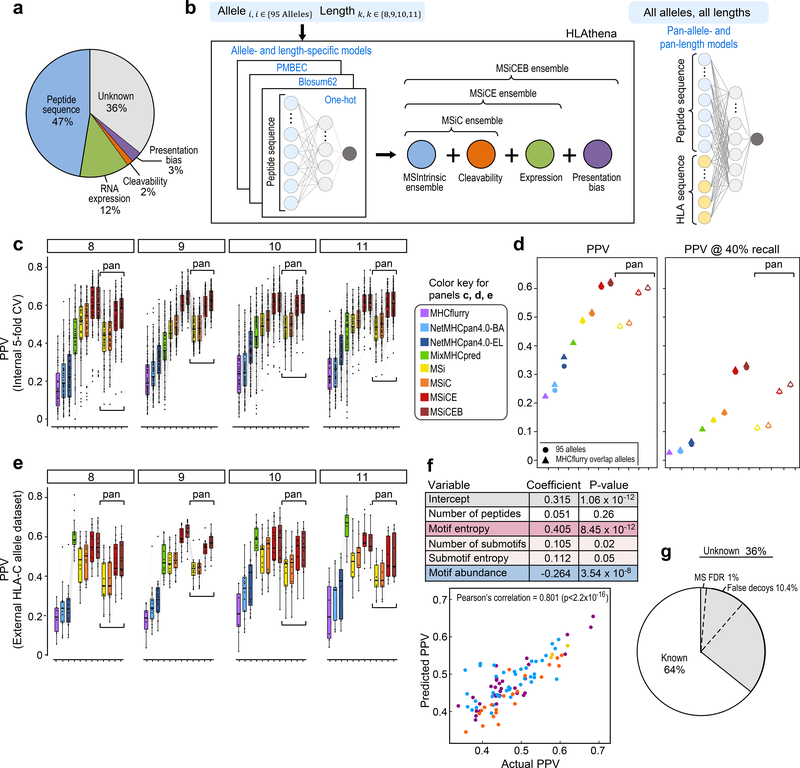
Prediction of HLA epitopes is important for the development of cancer immunotherapies and vaccines. However, current prediction algorithms have limited predictive power, in part because they were not trained on high-quality epitope datasets covering a broad range of HLA alleles. To enable prediction of endogenous HLA class I-associated peptides across a large fraction of the human population, we used mass spectrometry to profile >185,000 peptides eluted from 95 HLA-A, -B, -C and -G mono-allelic cell lines. We identified canonical peptide motifs per HLA allele, unique and shared binding submotifs across alleles and distinct motifs associated with different peptide lengths. By integrating these data with transcript abundance and peptide processing, we developed HLAthena, providing allele-and-length-specific and pan-allele-pan-length prediction models for endogenous peptide presentation. These models predicted endogenous HLA class I-associated ligands with 1.5-fold improvement in positive predictive value compared with existing tools and correctly identified >75% of HLA-bound peptides that were observed experimentally in 11 patient-derived tumor cell lines.


Conflict of interest statement

Competing Interests

D.B.K. has previously advised Neon Therapeutics, and owns equity in Aduro Biotech, Agenus Inc., Armata pharmaceuticals, Biomarin Pharmaceutical Inc., Bristol Myers Squibb Com., Celldex Therapeutics Inc., Editas Medicine Inc., Exelixis Inc., Gilead Sciences Inc., IMV Inc., Lexicon Pharmaceuticals Inc., and Stemline Therapeutics Inc. D.A.B. has received consulting fees from Octane Global, Defined Health, Dedham Group, Adept Field Solutions, Slingshot Insights, Blueprint Partnership, Charles River Associates, Trinity Group, Insight Strategy, and is a member of the RCC translational medicine advisory broad of Bristol-Myers Squibb. K.L.L. owns equity and is a founder of Travera LLC and is an advisor to Bristol Myers Squibb Com. and Rarecyte. S.A.C is a member of the scientific advisory boards of Kymera, PTM BioLabs and BioAnalytix and a scientific advisor to Pfizer and Biogen. C.J.W. and N.H. are founders of Neon Therapeutics and members of its scientific advisory board. N.H. is also an advisor for IFM therapeutics. W.J.L is a member of the scientific advisory board of CareDx. All other authors have no competing interests.

Figures

Figure 1:
Figure 1:. Mass spectrometric characterization of peptides eluted from HLA proteins in mono-allelic cell lines.
a) Schematic of the experimental design: HLA-null B721.221 cells transfected to express a single HLA allele (31 HLA-A, 40 HLA-B, 21 HLA-C and 3 HLA-G) were subjected to HLA class I-immunoprecipitation with W6/32 antibody from 50–300 million cells per allele followed by identification of eluted peptides by LC-MS/MS, in order to generate endogenous peptide binding data used to characterize allele-specific or pan-allele binding preferences and train neural network predictors of antigen processing and presentation. b) Surface expression of each transfected HLA-alleles was confirmed by flow cytometric detection against parental cells transfected with an empty vector (MFI: Mean fluorescence intensity; n=21 HLA-A, 34 HLA-B, 21 HLA-C, 3 HLA-G biologically independent samples; (boxplots depict median intensity, the box contains 25%−75% of the data, whiskers extend to lowest and highest values no further than 1.5*IQR; profiles of all lines in Supplementary Fig. 1a. c) Overlap of human genes represented by at least two HLA-associated peptides (pink), detected in RNA sequencing (TPM>2, light grey) or identified in deep proteome analysis (≥2 unique peptides, dark grey) of the B721.221 mono-allelic cells lines. d) Top: Numbers of HLA-bound peptides identified per allele by MS-based profiling (circles; filled: newly generated data; open: previously reported or recorded in IEDB (diamonds). Bottom: Heatmaps of relative median population frequencies per allele across racial groups (AFA: African American, API: Asian or Pacific Islander, HIS: Hispanic, CAU: Caucasian) in the US population and worldwide. See also Supplementary Figure 1.
Figure 2:
Figure 2:. Identification of shared motifs and submotifs amongst HLA-A, B, C and G alleles.
a) Pairwise correlations between 95 HLA-A, -B, -C and -G binding motifs, each represented as a vector of frequencies of the 20 amino acids at every peptide position) (left), and pairwise distances between the 95 HLA binding pockets, each represented by the properties of amino acids that are in contact with the peptide (right). Examples of groups of alleles with high similarity (middle; negative sign indicates that the allele was part of the peptide space group but not the HLA pocket group) and the corresponding binding motif of each group (bottom). b) Average correlations of A to A, B to B, C to C and G to G alleles show that C and G alleles are more similar to each other than A and B alleles in both peptide motif (left) and protein (right) space. Each dot represents an HLA allele and the y-axis is the mean of the correlations between that allele and all other alleles in that group. c) Number of alleles sharing a submotif colored according to HLA locus (A: purple, B: blue, C: orange, G: yellow). d) 2D-visualization of submotifs identified across the 95 alleles (middle), colored according to HLA locus (A:purple; B:blue; C:orange; G:yellow) and scaled in size according to the number of underlying peptides making up the sub-cluster. The collection of all allele-specific submotifs was clustered to identify groups of alleles that share a submotif (Supplementary Fig. 2b). Four examples of clusters of submotifs are highlighted with dashed circles, along with the respective motifs they represent and the allele-specific clusters that contribute to each shared motif. Motif xVxxxxxxR was found to be shared across subclusters amongst the −11:01, −11:02, −31:01, −33:03, −34:01, −34:02, −66:01, −68:01 and −74:01 alleles of HLA-A; likewise, motif xPxxxxxxV was shared by subclusters amongst the −07:02, −07:04, −35:03, −42:01, −51:01, −54:01, −55:01, −55:02 and −56:01 alleles of HLA-B. Motif xYxxxxxxL is shared amongst A*23:01, A*24:02, A*24:07, C*04:01, C*07:02, C*14:03; xAxxxxxxY is shared amongst B*15:01, B*15:02, B*15:03, B*15:17, B*35:03, B*35:07, B*46:01, B*53:01, C*02:02, C*03:02, C*12:01, C*12:03, C*16:01). See also Supplementary Figure 2.
Figure 3:
Figure 3:. Mono-allelic data uncovers lengths-specific HLA-binding preferences.
a) Frequencies of peptide lengths observed across alleles (8: pink; 9: violet; 10: green; 11: cyan). All but two HLA-B alleles preferentially present 9-mers. HLA-A alleles bind longer peptides more frequently than B and C alleles, while B and C alleles have a higher propensity for short peptides. b) 8-, 10- and 11-mer binding motifs were compared to 9-mer motifs by dropping middle residues (positions 4, 5, 6 or 7 depending on the length) to create pseudo motifs of the same length (8-mers: pseudo 8-mer from 9-mers vs true 8-mer motif; 10- and 11-mers: pseudo 9-mer from 10- and 11-mers vs true 9-mer motif) and selecting the pseudo motif which was most similar to the corresponding true motif. The maximum difference amongst peptide residue positions between the 8-, 10- and 11-mer pseudo motifs and the corresponding true motifs in amino acid frequency (x-axis) and entropy (y-axis) are shown. Circle size reflects number of peptides, dashed lines indicate cutoff values. Circles in color and label denote alleles with >100 peptides with change in amino acid frequency or entropy greater than the selected cutoffs (absolute difference in residue frequency with the true motif of >0.25 or an absolute difference in entropy of >0.2 at any position). c) Percent motif changes within each HLA type colored by length. d) Length dependent logo plots for A*33:01, B*14:02 and C*01:02; red boxes outline the changing motifs. e) Experimental validation of selected peptides (indicated with black dots on the NMDS plots) by in vitro binding assays compared to their predicted scores by NetMHCpan4–0.BA and MS models. f), g) Expression, predicted cleavability (clevnn) and hydrophobicity stratified by HLA loci (n=95 alleles, (31 HLA-A, 40 HLA-B, 21 HLA-C and 3 HLA-G, 1× 1e6 decoys) and peptide length (n=12,970 8-mers, 111,898 9-mers, 29,956 10-mers, 18.202 11-mers; all comparisons Welch’s two sample t-test, two-sided, provided in Supplementary Table 3c). See also Supplementary Figure 3.
Figure 4:
Figure 4:. Proteasomal and peptidase shaping of the HLA-associated peptidome.
a) Three types of primary tumor cell lines (melanoma [MEL], glioblastoma [GBM] and clear cell renal cell carcinoma [ccRCC]) used to identify HLA-associated peptidomes. b) Changes in relative protein abundance of proteasomal subunits and IFNγ inducible genes in patient-derived GBM cells with or without IFNγ-treatment based on MS proteome analysis. c) Schematic of cleavage signature analysis. d) Peptide processing signatures of HLA ligands presented by primary tumor and cancer cell lines at baseline (top, n=4 MEL, 3 GBM, 1 ccRCC, 1 Lung, biologically independent samples) and following IFNγ treatment (bottom, n=3 MEL, 3 GBM, 1 ccRCC, 1 Lung, biologically independent samples), showing overrepresented (red) or underrepresented (blue) amino acid residues upstream and downstream of the HLA peptide. The number in each cell denotes percent change over a background decoy set; color intensity indicates significance (see key, Chi-squared test, df=1). e) Heatmap of correlations between the processing preferences in untreated and IFNγ-treated samples at upstream and downstream positions. Signatures for peptides from the IFNγ treated cells correlate well with peptides eluted from untreated cells suggesting minimal to no difference between the two patterns (sample sizes as in 4d; Spearman’s rank correlation). See also Supplementary Figure 4.
Figure 5:
Figure 5:. Generation and evaluation of allele-and-length-specific and pan-allele-pan-length MS-based models on mono-allelic data.
a) Incremental contribution of predictor variables (peptide binding, transcript expression, cleavability, and gene presentation bias) to positive predictive value (PPV) as the most informative variables are added one at a time (analysis performed for 9-mer peptides). b) Cartoon schematic of the neural networks used to generate allele-and-length-specific and pan-allele-pan-length predictive models. c) Models are evaluated based on their ability to score MS-observed binders in the top 0.1% amongst a 999-fold excess of random decoys (PPV). Shown are 5-fold cross validation (CV) PPVs across each of the n=95 HLA alleles (grey lines) achieved by MHCflurry (available overlapping alleles = 31), NetMHCpan4.0-BA, NetMHCpan4.0-EL, MixMHCpred (available overlapping alleles = 72), and MS-informed models (boxplots depict median PPV, the box contains 25%−75% of the data, whiskers reach to lowest and highest values no further than 1.5*IQR). d) Average PPVs across alleles and lengths for state-of-the-art and MS-based models resulting in a 2-fold improvement in PPV, or 6–12-fold improvement in PPV at 40% recall in an evaluation dataset with 1:10000 hit:decoy ratio. e) Model evaluation as in d) on an external dataset of HLA-C presented peptides identified by MS. f) Correlation of actual PPVs achieved by the allele-specific 9-mer MSi models vs PPVs predicted by a multivariate linear regression fit, with variables and their respective effect sizes and significance tabulated (n=95). g) The negative contribution of motif abundance to PPV (i.e. negative regression coefficient) suggests that ~10.4% of ‘Unknown’ PPV (estimated as the average motif abundance scaled by the coefficient) can be attributed to false decoys present in the negative set, which artificially decreases PPV. Similarly, 1% of unexplained PPV could be due to false-positive identifications by MS at the 1% FDR threshold (n=95). See also Supplementary Table 5.
Figure 6:
Figure 6:. Integrative MS-informed models more accurately predict peptides directly observed on primary tumor cells.
a) Schematic of data generation and model evaluation: peptides displayed on primary tumor specimens are isolated and sequenced by MS, the HLA alleles of the patient sample are clinically typed, matched RNA-seq data is generated; each observed epitope is evaluated for binding against each of the unique HLA alleles in the sample, predictions that are better than 0.1% scores within a large decoy set are considered binders and assigned to the corresponding allele; the performance of 7 algorithms is evaluated as the fraction of observed binders that are successfully predicted as binders. b) MS-based predictor ranks MS detected peptides better than NetMHCpan and MHCflurry. Internal data on 11 patients (n=3 CLL (squares), 1 OV (diamond), 3 GBM (circle), 4 MEL (triangle), all biologically independent), and external data (n=4 MEL and 27 OV biologically independent samples),. c) Peptides were assigned to alleles in each sample based on the best scoring peptide-allele combination. Allele contribution to peptide presentation varies per tumor, IFNγ treatment and per individual. d) Fraction of peptides contributing per allele type +/− IFNγ (n=6, biologically independent samples). Peptide presentation on HLA-B increases with IFNγ stimulation (Wilcoxon signed-rank tests). See also Supplementary Figure 5.

Comment in

References

    1. Lefranc M-P et al. IMGT®, the international ImMunoGeneTics information system® 25 years on. Nucleic Acids Res. 43, D413–22 (2015). - PMC - PubMed
    1. Robinson J et al. The IPD and IMGT/HLA database: allele variant databases. Nucleic Acids Res. 43, D423–31 (2015). - PMC - PubMed
    1. Jurtz V et al. NetMHCpan-4.0: Improved Peptide–MHC Class I Interaction Predictions Integrating Eluted Ligand and Peptide Binding Affinity Data. The Journal of Immunology 199, 3360–3368 (2017). - PMC - PubMed
    1. Abelin JG et al. Mass Spectrometry Profiling of HLA-Associated Peptidomes in Mono-allelic Cells Enables More Accurate Epitope Prediction. Immunity 46, 315–326 (2017). - PMC - PubMed
    1. O’Donnell TJ et al. MHCflurry: Open-Source Class I MHC Binding Affinity Prediction. Cell Syst 7, 129–132.e4 (2018). - PubMed

Online Methods-only references

    1. Kidera A, Konishi Y, Oka M, Ooi T & Scheraga HA Statistical analysis of the physical properties of the 20 naturally occurring amino acids. J. Protein Chem 4, 23–55 (1985).
    1. Bremel RD & Homan EJ An integrated approach to epitope analysis I: Dimensional reduction, visualization and prediction of MHC binding using amino acid principal components and regression approaches. Immunome Res. 6, 7 (2010). - PMC - PubMed
    1. McInnes L, Healy J & Melville J UMAP: Uniform Manifold Approximation and Projection for Dimension Reduction. arXiv [stat.ML] (2018).
    1. Harndahl M et al. Peptide binding to HLA class I molecules: homogenous, high-throughput screening, and affinity assays. J. Biomol. Screen 14, 173–180 (2009). - PubMed
    1. Bassani-Sternberg M, Pletscher-Frankild S, Jensen LJ & Mann M Mass Spectrometry of Human Leukocyte Antigen Class I Peptidomes Reveals Strong Effects of Protein Abundance and Turnover on Antigen Presentation. Molecular & Cellular Proteomics 14, 658–673 (2015). - PMC - PubMed

Publication types