. 2020 Feb;38(2):176-181.
doi: 10.1038/s41587-019-0345-2. Epub 2019 Dec 16.

Electrical recognition of the twenty proteinogenic amino acids using an aerolysin nanopore

Affiliations

Electrical recognition of the twenty proteinogenic amino acids using an aerolysin nanopore

Hadjer Ouldali et al. Nat Biotechnol. 2020 Feb.

Abstract

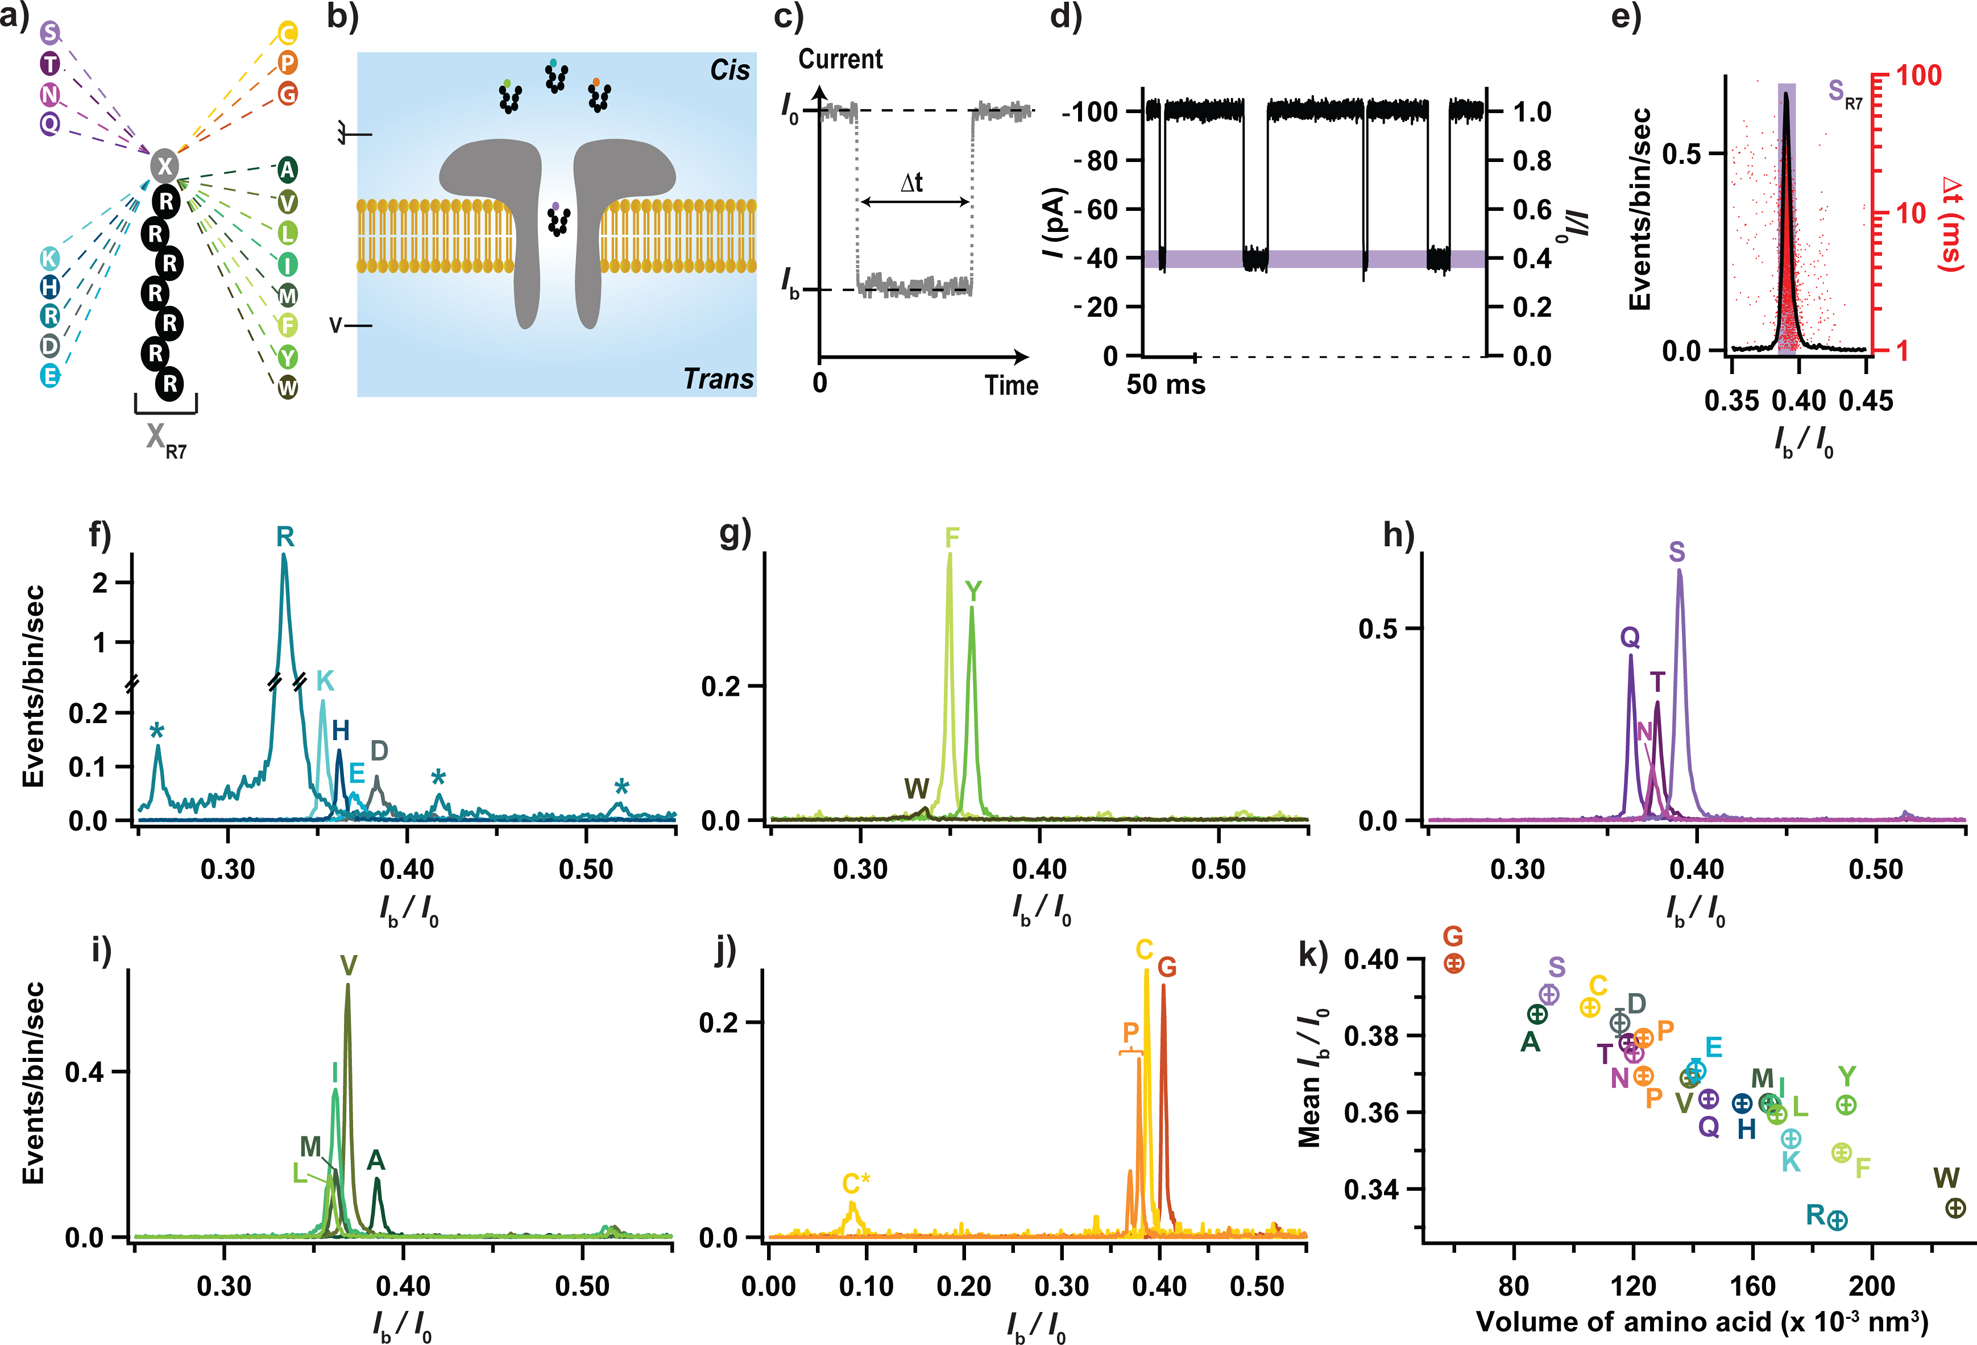
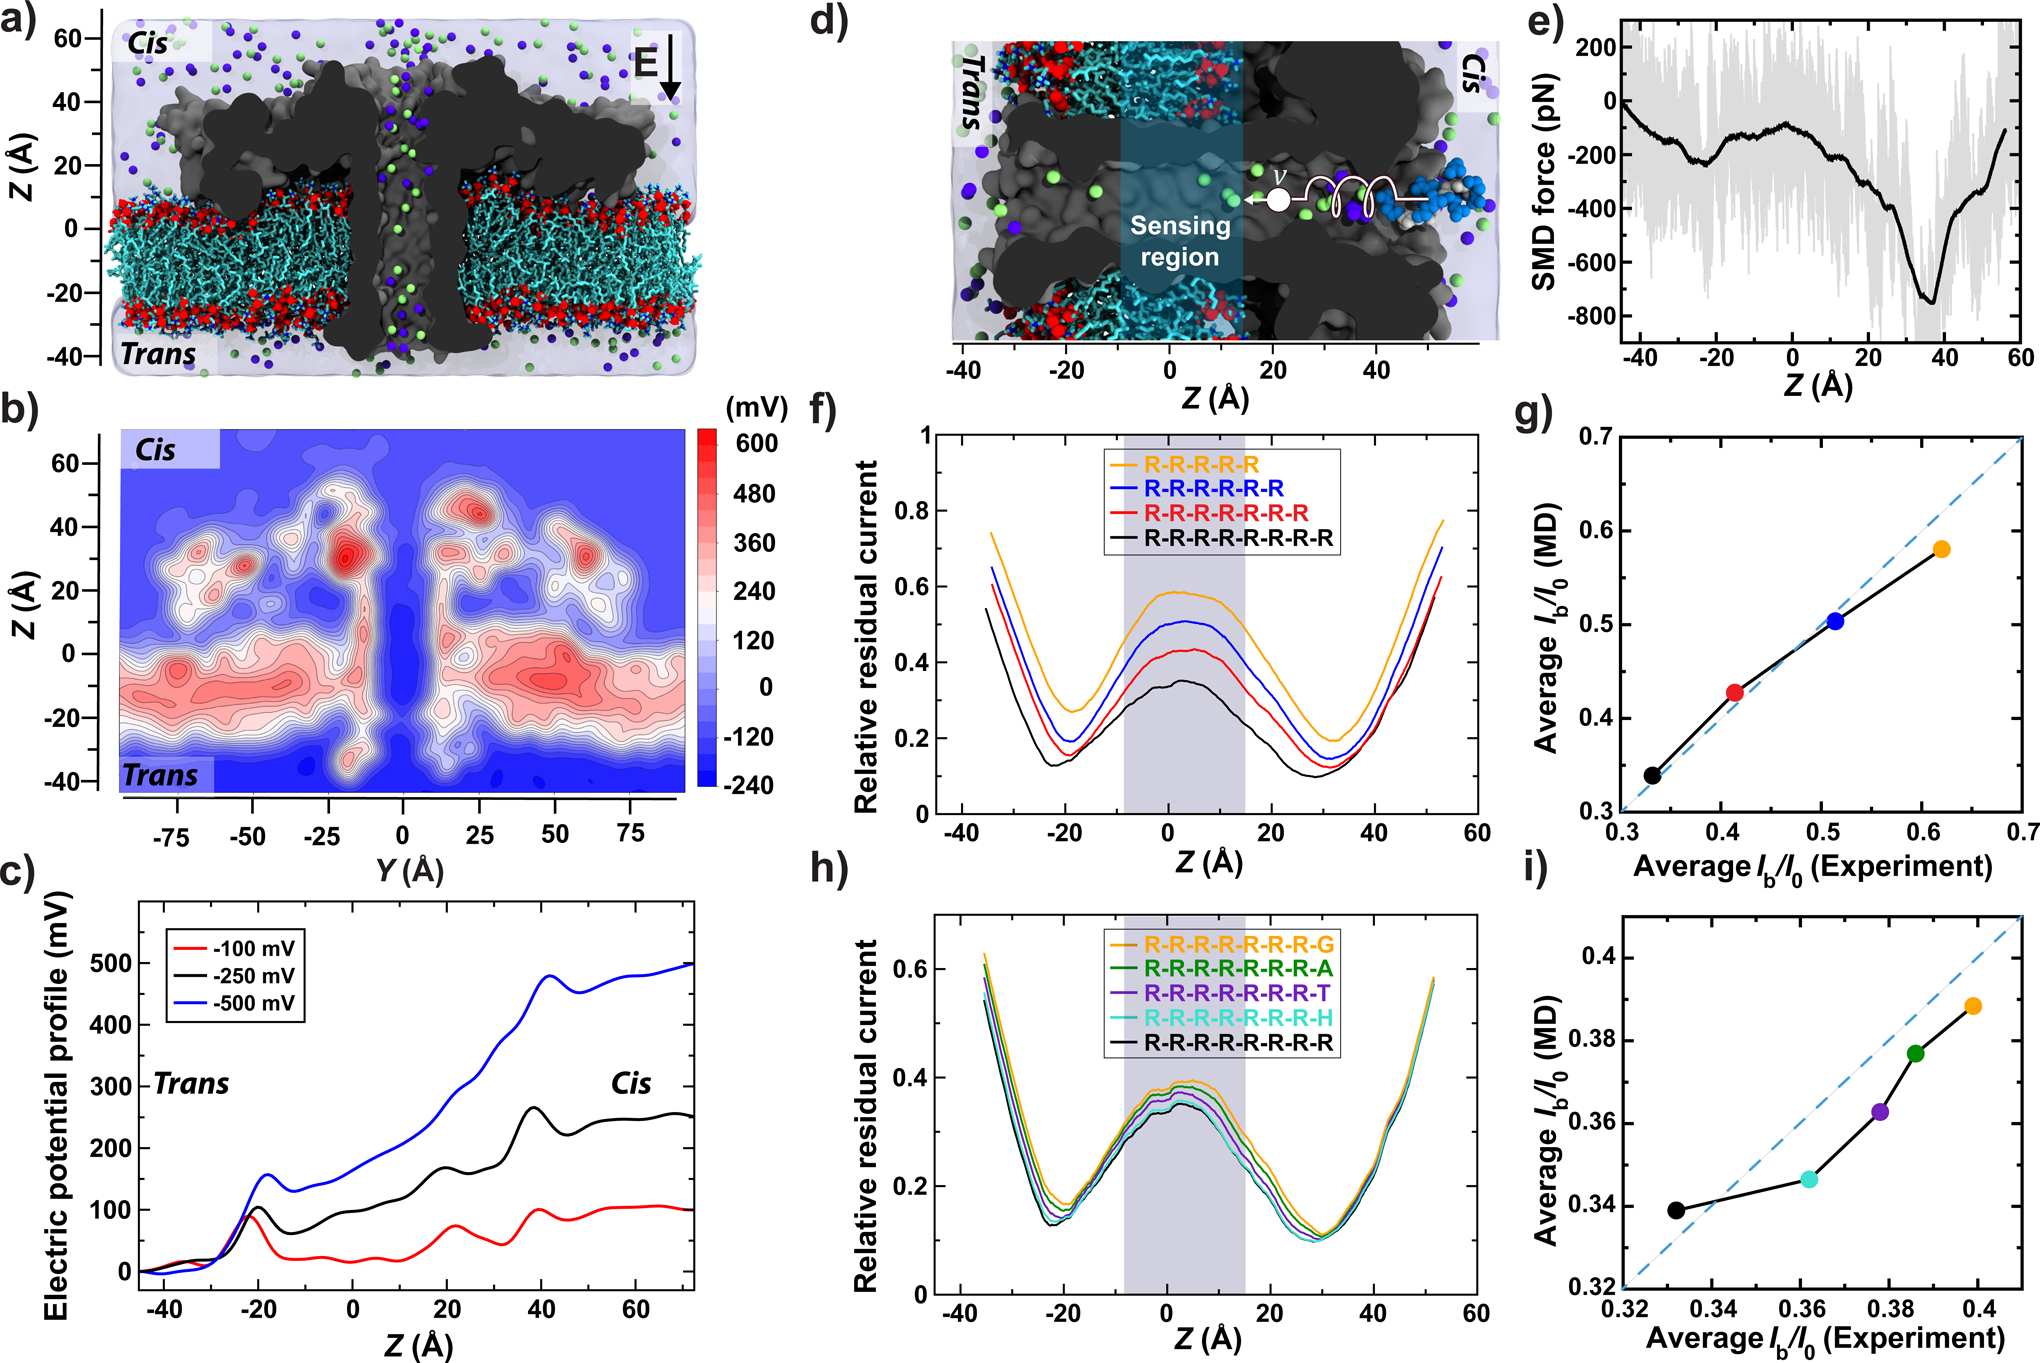
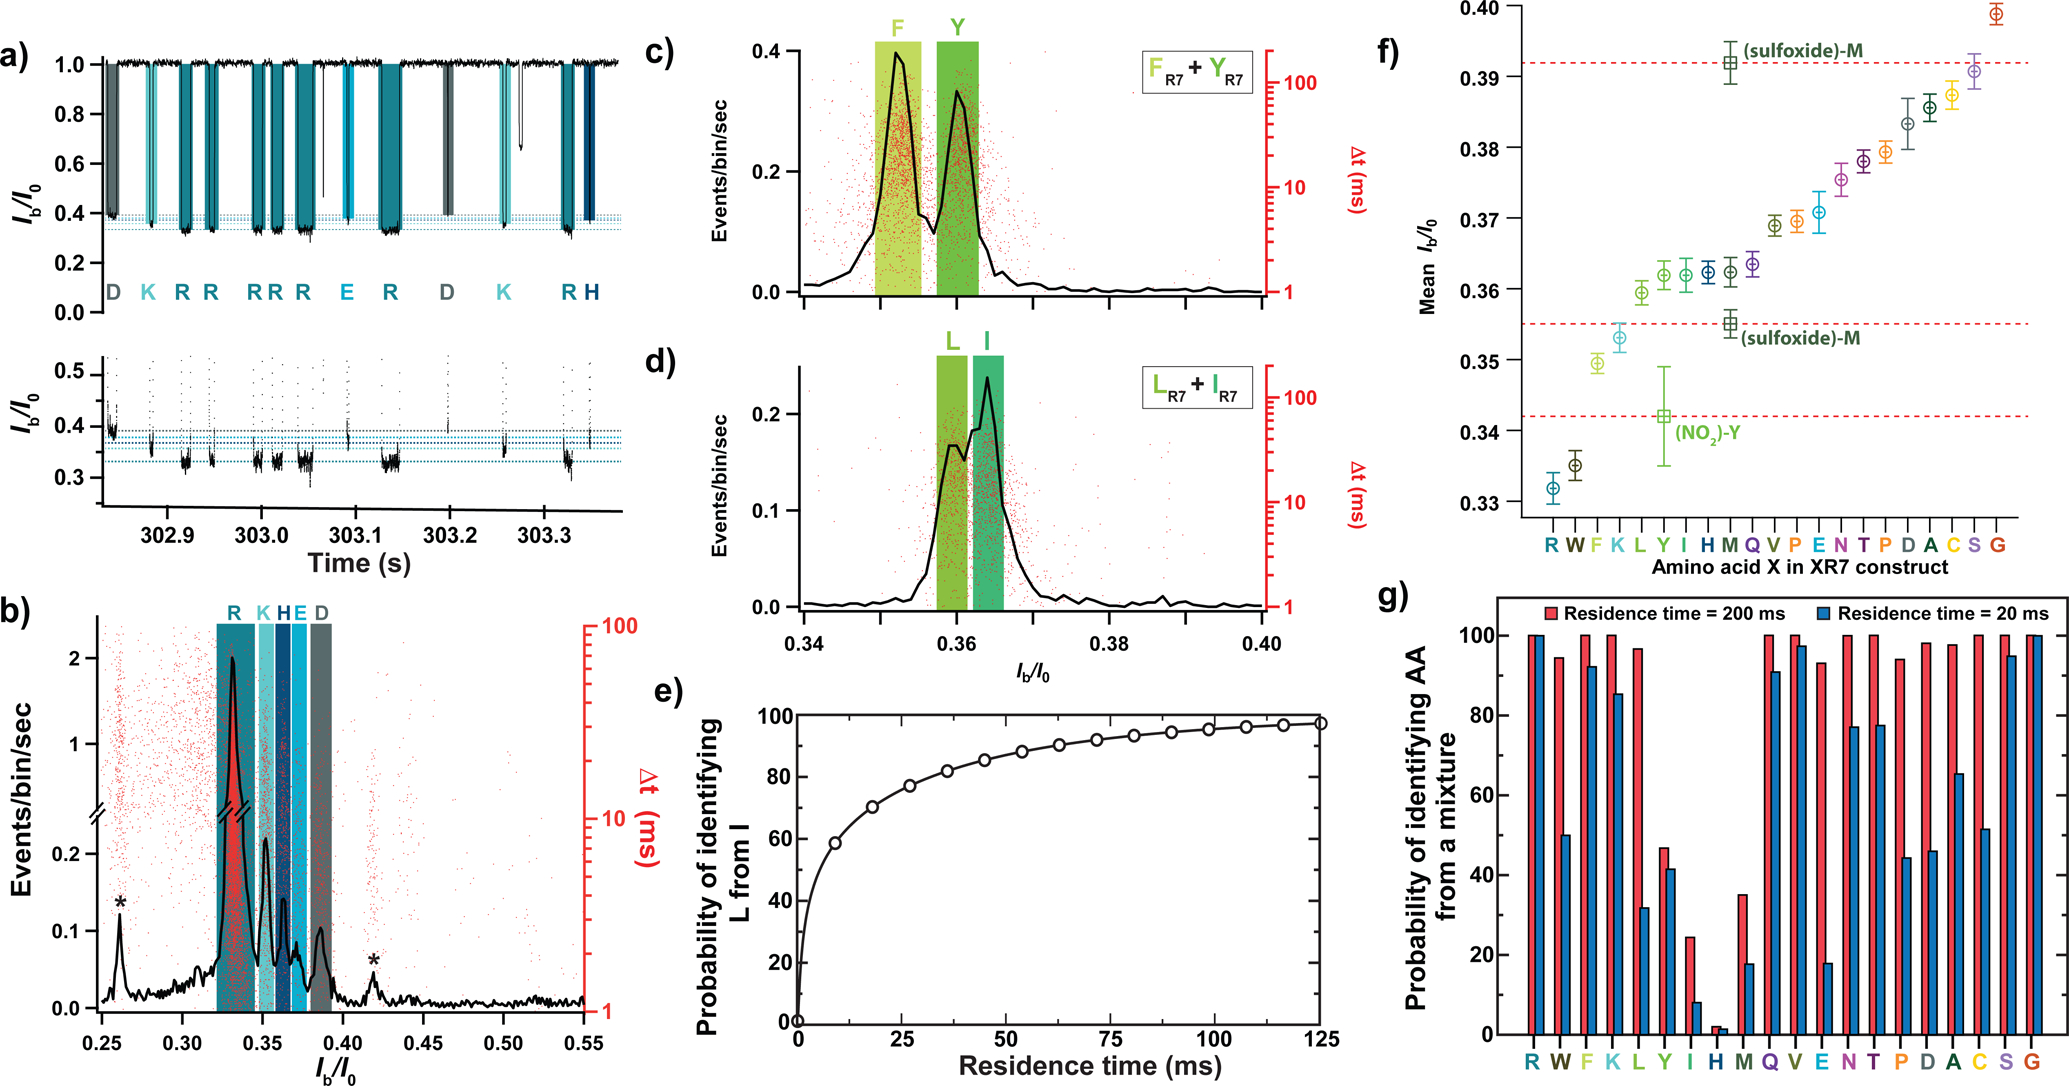
Efforts to sequence single protein molecules in nanopores1-5 have been hampered by the lack of techniques with sufficient sensitivity to discern the subtle molecular differences among all twenty amino acids. Here we report ionic current detection of all twenty proteinogenic amino acids in an aerolysin nanopore with the help of a short polycationic carrier. Application of molecular dynamics simulations revealed that the aerolysin nanopore has a built-in single-molecule trap that fully confines a polycationic carrier-bound amino acid inside the sensing region of the aerolysin. This structural feature means that each amino acid spends sufficient time in the pore for sensitive measurement of the excluded volume of the amino acid. We show that distinct current blockades in wild-type aerolysin can be used to identify 13 of the 20 natural amino acids. Furthermore, we show that chemical modifications, instrumentation advances and nanopore engineering offer a route toward identification of the remaining seven amino acids. These findings may pave the way to nanopore protein sequencing.


Conflict of interest statement

Competing financial interest

AU include any patents pending as a result of this work.

The authors declare the following competing financial interest(s): A.O, J.P and P.M are co-founders of DreamPore S.A.S. and F.P. is the head of research development of DreamPore S.A.S. J.C.B is cofounder of Ionera Technologies GmbH, Freiburg, Germany and of Nanion Technologies GmbH, Munich, Germany.

Figures

Figure 1:
Figure 1:. Electrical detection of the twenty proteinogenic amino acids.
(a) Schematic illustration of the peptide constructs used to probe the current blockade of the twenty amino acids. A cationic carrier of seven arginine amino acids (R7) is chemically linked at the C-terminus to the eighth amino acid, X, to form twenty XR7 peptides. (b) Schematics of the experimental setup (not to scale). (c) Illustration of a typical current blockade. (d) Representative fragment of ionic current recording. (e) Typical histogram of the relative residual current, Ib/I0 (left axis), and blockade duration, Δt (right axis), produced by the transport of SR7 peptides through the aerolysin nanopore. (f-j) Superimposed histograms of Ib/I0 obtained from nanopore experiments performed for each of the twenty XR7 peptides, analyzed individually and grouped according to the properties of amino acid X: charged (f), hydrophobic aromatic (g), polar uncharged (h), hydrophobic non-aromatic (i), and when amino acid X is either cytosine, proline or glycine (j). In panel f, stars indicate blockade levels likely produced by R9, R7 and R6 polyarginine impurities (from left to right) present in the RR7 sample. In panel j, C* and C indicate populations recorded before and after dithiothreitol treatment, see Supplementary Fig. 1. (k) Mean relative residual current and its standard deviation produced by the XR7 probes versus volume of amino acid X. All data were acquired in 4 M KCl, 25 mM HEPES buffer, at 7.5 pH, 1 μM peptide concentration, 20.0 ± 0.5°C, and under a −50 mV bias applied to the trans compartment. For each histogram, at least 1000 events were analyzed.
Figure 2:
Figure 2:. MD simulation of peptide translocation through aerolysin.
(a) Simulation system consisting of an aerolysin channel (cutaway molecular surface), embedded in a DPhPC membrane (cyan and red) and submerged in KCl electrolyte (blue semitransparent surface; green and purple spheres). (b) Electrostatic potential map of aerolysin at −100 mV transmembrane bias. The map was obtained by averaging instantaneous distributions of electrostatic potentials over a 20 ns MD trajectory and the six-fold symmetry of the channel. (c) Average electrostatic potential along the symmetry axis of aerolysin (the z axis). The plot was obtained by averaging instantaneous values of electrostatic potential along the symmetry axis over a 20 ns MD trajectory (10000 frames). (d) Initial state of an SMD simulation where an RR7 peptide (blue spheres) was moved through the transmembrane pore of aerolysin (grey) with a constant velocity of 1 Å/ns by means of a harmonic spring potential. For clarity, only the central part of the system is shown. The sensing region of the aerolysin pore is highlighted in cyan (same in panels f and h). (e) The force exerted on the peptide during the SMD simulation. The instantaneous SMD forces are shown in gray; their running average (5 Å window) is shown in black. (f) Relative residual current versus the CoM coordinate of RR7, RR6, RR5 and RR4 peptides. The peptides’ coordinates were derived from the conformations of RR7 sampled during the SMD simulation. The currents were computed using the steric exclusion model and averaged using a 10-Å running average. (g) Simulated versus experimental average relative currents produced by the arginine peptides within the sensing region of aerolysin. (h,i) Same as in panels f and g but for GR7, AR7, TR7, HR7 and RR7 peptides; the experimental values are reproduced from Fig. 1k. For panels g & i, the average simulated current was calculated from 130 relative residual current values corresponding to the presence of arginine peptides in the sensing region.
Figure 3:
Figure 3:. Discerning amino acids from a mixture.
(a) Fragment of a typical current recording from a nanopore experiment where equimolar amounts of RR7, KR7, HR7, ER7, and DR7 were introduced into the cis compartment solution. The bottom graph shows a zoomed-in view of the top graph. (b) Histogram of Ib/I0 values (black line, left axis) and the scatter plot of the blockade duration (red dots, right axis) for an equimolar mixture of RR7, KR7, HR7, ER7, and DR7 (n = 19641 events). (c,d) Histogram of Ib/I0 values (black line, left axis) and scatter plot of blockade duration (red dots, right axis) recorded from an equimolar mixture of YR7 and FR7 (panel c, n = 7731 events) or LR7 and IR7 (panel d, n = 4489 events). Colored rectangles indicate the mean (centerline) and the standard deviation (widths) of the Ib/I0 values recorded individually for each XR7 peptide (data from Fig. 1f–j and Supplementary Fig. 7). (e) Theoretically assessed probability of identifying LR7 from an equimolar mixture of LR7 and IR7 from a single nanopore passage of specified duration. (f) Experimentally determined mean Ib/I0 value and its standard deviation for all twenty XR7 peptides arranged in ascending order (circles) (n = 34025 (RR7), 1328 (WR7), 6228 (FR7), 1969 (KR7), 2319 (LR7), 3411 (YR7), 5185 (IR7), 1449 (HR7), 2317 (MR7), 3822 (QR7), 5369 (VR7), 1681 (PR7), 1655 (ER7), 3165 (NR7), 2978 (TR7), 1866 (DR7), 1717 (AR7), 3311 (CR7), 8169 (SR7), 3266 (GR7), 2626 ((NO2)-YR7), 2374 ((sulfoxide)-M R7) events). Square symbols indicate Ib/I0 values for chemically modified methionine, M-(sulfoxide), and tyrosine, Y-(NO2), peptides (see Supplementary Figs. 10 and 11). The mean value (respectively uncertainty) of relative residual current of each peptide was obtained as the mean value (respectively standard deviation) of a gaussian fit of the corresponding Ib/I0 distribution; from single independent experiments. (g) Theoretically assessed probability of identifying an individual XR7 peptide from a mixture of twenty XR7 peptides from a single nanopore measurement lasting 20 (blue) or 200 (red) ms. All experimental data were acquired in 4 M KCl, 25 mM HEPES buffer, at 7.5 pH and 20.0 ± 0.5°C, and under a −50 mV bias applied to the trans compartment.

Comment in

  • Reading amino acids in a nanopore.
    Howorka S, Siwy ZS. Howorka S, et al. Nat Biotechnol. 2020 Feb;38(2):159-160. doi: 10.1038/s41587-019-0401-y. Nat Biotechnol. 2020. PMID: 31974421 No abstract available.
  • Sensing proteinogenic amino acids.
    Tang L. Tang L. Nat Methods. 2020 Feb;17(2):126. doi: 10.1038/s41592-020-0741-z. Nat Methods. 2020. PMID: 32020089 No abstract available.

References

    1. Nivala J, Marks DB & Akeson M Unfoldase-mediated protein translocation through an α-hemolysin nanopore. Nat. Biotechnol 31, 247–250 (2013). - PMC - PubMed
    1. Rodriguez-Larrea D & Bayley H Multistep protein unfolding during nanopore translocation. Nat. Nanotech 8, 288–295 (2013). - PMC - PubMed
    1. Zhao Y et al. Single-molecule spectroscopy of amino acids and peptides by recognition tunnelling. Nat. Nanotech 9, 466–473 (2014). - PMC - PubMed
    1. Ohshiro T et al. Detection of post-translational modifications in single peptides using electron tunnelling currents. Nat. Nanotech 9, 835–840 (2014). - PubMed
    1. Kennedy E, Dong Z, Tennant C & Timp G Reading the primary structure of a protein with 0.07 nm3 resolution using a subnanometre-diameter pore. Nat. Nanotech 11, 968–976 (2016). - PubMed

Publication types