. 2020 Feb;16(2):179-187.
doi: 10.1038/s41589-019-0429-9. Epub 2019 Dec 16.

Artificial signaling in mammalian cells enabled by prokaryotic two-component system

Affiliations

Artificial signaling in mammalian cells enabled by prokaryotic two-component system

Alain Mazé et al. Nat Chem Biol. 2020 Feb.

Abstract

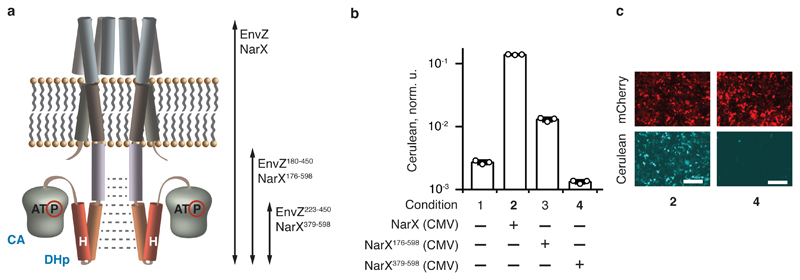
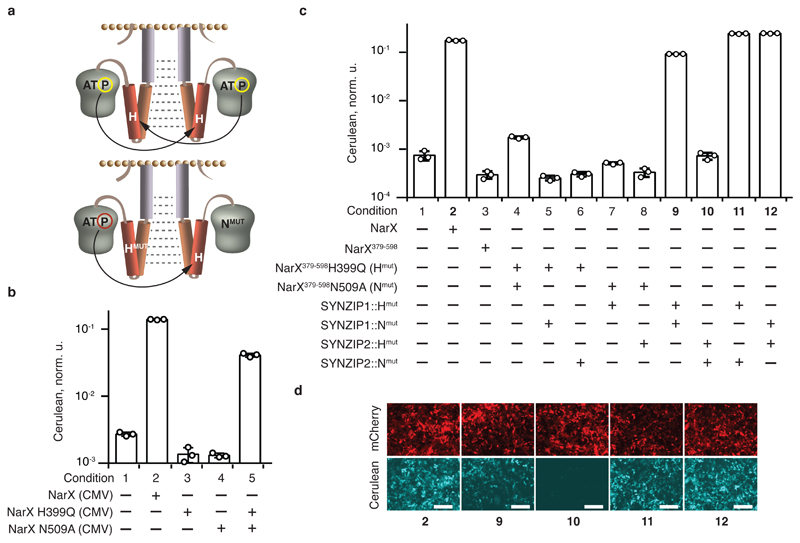
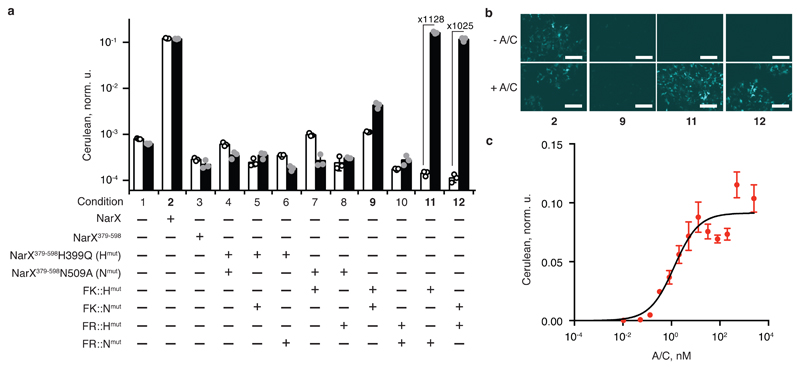
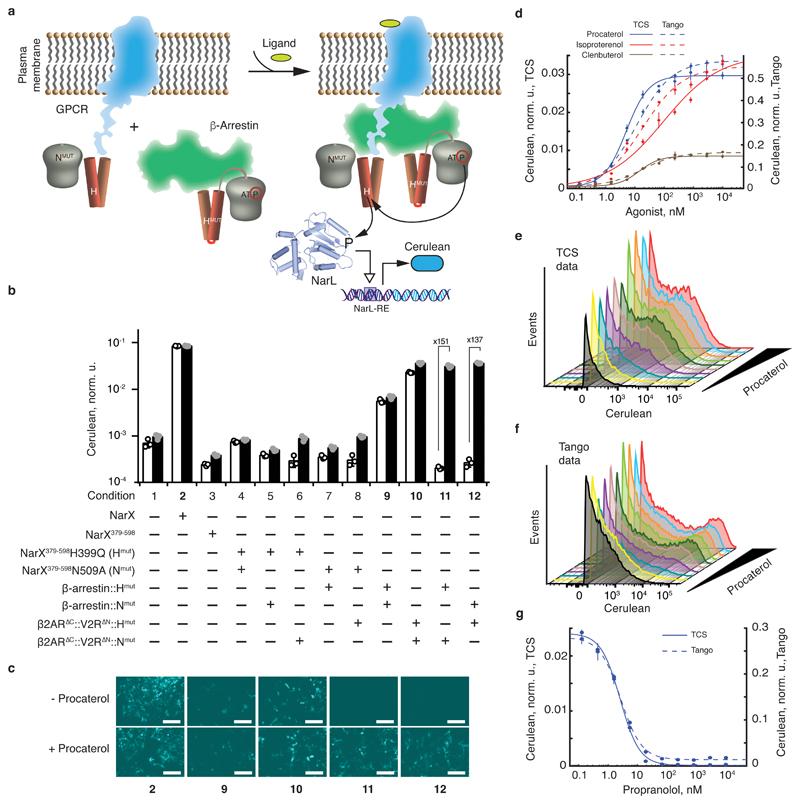
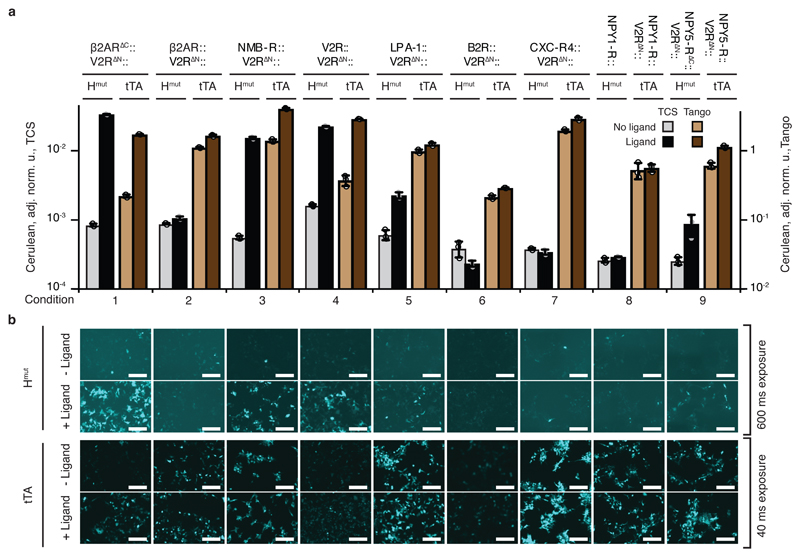
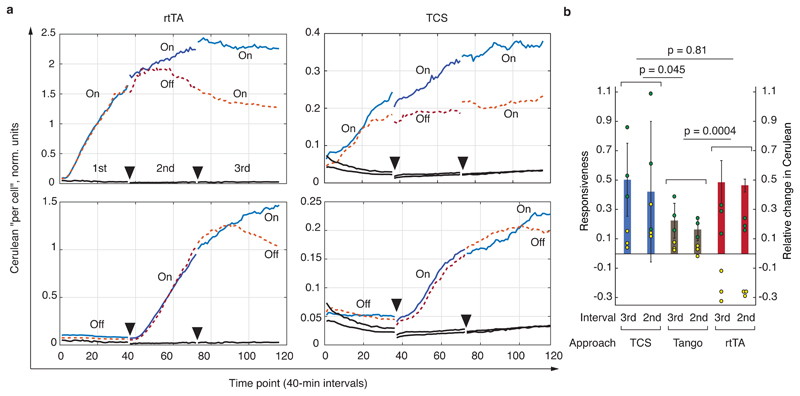
Augmenting live cells with new signal transduction capabilities is a key objective in genetic engineering and synthetic biology. We showed earlier that two-component signaling pathways could function in mammalian cells, albeit while losing their ligand sensitivity. Here, we show how to transduce small-molecule ligands in a dose-dependent fashion into gene expression in mammalian cells using two-component signaling machinery. First, we engineer mutually complementing truncated mutants of a histidine kinase unable to dimerize and phosphorylate the response regulator. Next, we fuse these mutants to protein domains capable of ligand-induced dimerization, which restores the phosphoryl transfer in a ligand-dependent manner. Cytoplasmic ligands are transduced by facilitating mutant dimerization in the cytoplasm, while extracellular ligands trigger dimerization at the inner side of a plasma membrane. These findings point to the potential of two-component regulatory systems as enabling tools for orthogonal signaling pathways in mammalian cells.


Conflict of interest statement

Competing interests.

A patent application has been filed describing the result in this study, with A.M. and Y.B. listed as coinventors. Y.B. is a coinventor of a background patent to this filing.

Figures

Fig. 1
Fig. 1. Identification of HK domains with reduced intrinsic signaling.
a, A representation of an HK receptor in a cell membrane. CA domain with bound ATP and DHp domain containing the phosphorylatable histidine (H) are shown. Dimerization is indicated with dotted gray lines. The arrows span the various tested domains (see also Supplementary Fig. 2). b, Signaling capacity of truncated NarX. The bars show Cerulean levels in cells coexpressing NarL and an indicated NarX variant in the presence of NarL-inducible Cerulean reporter. Cerulean expression is normalized to the transfection control and shown as mean ± SD of independent biological triplicates. The circles indicate individual measurements. c, Microscopy images of HEK293 cells for conditions shown in bold in panel b. The top and the bottom rows show, respectively, the expression of constitutive mCherry transfection control (red), and pathway-induced Cerulean reporter (cyan) in the same transfection. The numbers correspond to the conditions in b. The white scale bar is 200 μm. The DNA constructs are described in Supplementary Fig. 1. The results were reproduced at least once in an independent experiment.
Fig. 2
Fig. 2. Restoration of two-component signaling via forced dimerization.
a, Schematics of trans-autophosphorylation. The top and bottom schemes illustrate, respectively, the phosphorylation in a homodimer of a wild-type HK, and in a heterodimer of complementing ATP binding site and histidine mutants. b, Complementation activity assays for full-length NarX. The bars show Cerulean levels in cells coexpressing NarL and an indicated NarX variant, in the presence of NarL-inducible Cerulean reporter. c, Reestablishment of signaling via fusions to SYNZIP1 and SYNZIP2. The bars show Cerulean levels in cells coexpressing NarL and the indicated combinations of NarX- and SYNZIP-derived constructs, in the presence of NarL-inducible Cerulean reporter. See Supplementary Fig. 5 for schematic illustration of the protein fusions. d, Microscopy images of HEK293 cells for conditions shown in bold in panel c. The top and the bottom rows show, respectively, the expression of constitutive mCherry transfection reporter (red), and pathway-induced Cerulean reporter (cyan) in the same transfection. The numbers correspond to the conditions in panel c. Cerulean expression is normalized to the transfection control and shown as mean ± SD of independent biological triplicates. The circles indicate individual measurements. The white scale bars in d correspond to 200 μm. The DNA constructs are described in Supplementary Fig. 1. The results were reproduced at least once in an independent experiment.
Fig. 3
Fig. 3. Transduction of cytoplasmic ligand to gene expression.
a, Ligand-induced signaling with the help of FKBP/FRB fusions. The bars show Cerulean levels in cells coexpressing NarL and the indicated combination of NarX- and FKBP- or FRB- derived constructs, in the presence of NarL-inducible Cerulean reporter. The white and the black bars show Cerulean expression in the absence and in the presence of 100 nM of A/C ligand, respectively. The fold change of A/C induction is shown for conditions 11 and 12. See Supplementary Fig. 6 for schematic illustrations of the process. b, Microscopy images of HEK293 cells for conditions shown in bold in panel a. The top and the bottom rows show, respectively, the reporter expression in the absence and in the presence of A/C. The numbers correspond to the conditions in panel a. c, Dose response to the amount of A/C dimerizer. NarL-regulated Cerulean reporter expression is shown for different A/C concentrations in the presence of NarL and the pair FR::Hmut and FK::Nmut. In this figure, Cerulean levels are normalized to the transfection control and averaged over a biological triplicate, shown as mean ± SD. The circles indicate individual measurements. The white scale bar in b corresponds to 200 μm. The DNA constructs are described in Supplementary Fig. 1. The results were reproduced at least once in an independent experiment.
Fig. 4
Fig. 4. Rewiring the GPCR activity to the expression of a reporter gene.
a, Schematics of transducing ligand-induced GPCR/β-arrestin interaction into gene expression via TCS machinery. b, Ligand-induced reporter activation via GPCR rewiring. NarL-inducible Cerulean expression is shown in the presence of NarL and the indicated NarX-, β2AR∆C::V2R∆N, and/or β-arrestin-derived constructs. The white and the black bars correspond to the absence and the presence of 2 μM procaterol, respectively. The fold-change of procaterol-triggered induction is shown for the conditions 11 and 12. c, Microscopy images of HEK293 cells for selected conditions shown in bold in panel a. The top and the bottom rows show reporter expression without and with 2 μM of procaterol, respectively. The numbers correspond to the conditions in a. d, Reporter expression as a function of different β2AR agonists' concentration. Full lines represent the results obtained with β2AR∆C::V2R∆N::Hmut and β-arrestin::Nmut in the presence of NarL and NarL-regulated Cerulean reporter (TCS). Dotted lines represent the results obtained with the Tango assay using chimeric GPCR βAR∆C::V2R∆N::tTA. The primary Y axis is used for the TCS data and the secondary Y axis is used for Tango data. d, e, Fluorescence histograms in Cerulean-positive cells obtained for increasing amounts of procaterol with the TCS-based transduction (d) and Tango (e). f, Dose response to the antagonist propranolol in the presence of 100 nM of procaterol. The full line shows data obtained with TCS-based transduction and the dashed line summarizes data obtained with Tango assay. Primary and secondary Y-axes are as in (d). All values in the bar chart and the graph are Cerulean levels normalized to transfection control and averaged over a biological triplicate, shown as mean ± SD. The circles indicate individual measurements. The white scale bar in c corresponds to 200 μm. The DNA constructs are described in Supplementary Fig. 1. The results were reproduced at least once in an independent experiment.
Fig. 5
Fig. 5. Multiple GPCRs are rewired to induce gene expression.
a, Characterization of multiple GPCRs rewired via TCS and Tango cascades. Every experimental condition (numbered on X axis) represents a particular GPRC (indicated above the top horizontal line) fused either to Hmut (TCS) or tTA (Tango), as shown. GPCR Hmut fusions are coexpressed with β-arrestin::Nmut and NarL in the presence of NarL-inducible Cerulean reporter. GPCR tTA fusion is coexpressed with β-arrestin-TEV and tTA-inducible TRE-driven Cerulean reporter. Gray and light brown bars correspond to Cerulean expression in the absence of a cognate GPCR ligand, and the black and dark brown bars show Cerulean expression in the presence of a ligand. The primary Y axis is used for the TCS experiments and the secondary Y axis for Tango experiments. b, Representative microscopy images of HEK293 cells show Cerulean reporter expression with (+Ligand) and without the ligand (-Ligand) for TCS-based GPCR induction (two upper rows) and for Tango-based induction (two bottom rows). See Supplementary Fig. 9 for transfection control images. The bar charts display Cerulean level normalized to the transfection control and averaged over an independent biological triplicate as mean ± SD. Circles show individual measurements. The constructs are described in Supplementary Fig. 1. The white scale bars in panel b correspond to 200 μm. The results were reproduced at least once in an independent experiment.
Fig. 6
Fig. 6. Dynamic characterization of the various signaling approaches.
a, Selected time lapse traces of normalized output expression. Charts show, from left to right, the response of rtTA-Doxycycline (rtTA) system, and GPCR signaling via TCS pathway (Hmut fusions). Each trace is labeled either On or Off, with On indicating the presence of a ligand and Off means absence of a ligand during the measurement interval. Dotted lines indicate time course that include an Off condition during the 2nd or the 3rd interval, and solid lines are time courses with On conditions during both the 2nd and the 3rd interval. Full triangles indicate the endpoints of the measurement intervals. Solid black lines are background readouts. See Supplementary Fig. 11 for the entire dataset including the time traces obtained with the Tango assay. b, Responsiveness compared for the three approaches. The interval (3rd or 2nd, see also top left chart in panel a) indicated on the X axis is the interval during which the On and the Off responses were compared. The yellow and the green dots, respectively, represent the relative change in the expression of the Cerulean reporter (see Methods and Supplementary Fig. 12) during the On (green) and Off (yellow) intervals. The bars indicate the responsiveness during each interval, i.e., the difference between the relative Cerulean change during an On and Off interval (Methods), and the error bars are calculated from the raw data (circles) using appropriate error propagation. The p-values are the products of the p-values calculated for the responsiveness comparison between matched intervals (2nd vs 2nd and 3rd vs 3rd, two-sided t-test, 8 degrees of freedom, also see Methods). The primary Y axis shows responsiveness and the secondary Y axis shows relative change in the Cerulean expression. The entire experiment was performed once, every condition was measured as a biological triplicate, and the conclusions are drawn upon analysis of six independent measurements (three for the 2nd and three for the 3rd interval comparison).

Comment in

References

    1. Park SH, Zarrinpar A, Lim WA. Rewiring MAP kinase pathways using alternative scaffold assembly mechanisms. Science. 2003;299:1061–1064. - PubMed
    1. Jackson HJ, Rafiq S, Brentjens RJ. Driving CAR T-cells forward. Nat Rev Clin Oncol. 2016;13:370–383. - PMC - PubMed
    1. Benenson Y. Biomolecular computing systems: principles, progress and potential. Nat Rev Genet. 2012;13:455–468. - PubMed
    1. Hansen J, Benenson Y. Synthetic biology of cell signaling. Nat Comput. 2016;15:5–13.
    1. Cho JH, Collins JJ, Wong WW. Universal chimeric antigen receptors for multiplexed and logical control of T cell responses. Cell. 2018;173:1426–1438. - PMC - PubMed

Publication types

MeSH terms