. 2020 Jan;52(1):48-55.
doi: 10.1038/s41588-019-0549-x. Epub 2019 Dec 16.

N6-methyladenosine regulates the stability of RNA:DNA hybrids in human cells

Affiliations

N6-methyladenosine regulates the stability of RNA:DNA hybrids in human cells

Abdulkadir Abakir et al. Nat Genet. 2020 Jan.

Abstract

R-loops are nucleic acid structures formed by an RNA:DNA hybrid and unpaired single-stranded DNA that represent a source of genomic instability in mammalian cells1-4. Here we show that N6-methyladenosine (m6A) modification, contributing to different aspects of messenger RNA metabolism5,6, is detectable on the majority of RNA:DNA hybrids in human pluripotent stem cells. We demonstrate that m6A-containing R-loops accumulate during G2/M and are depleted at G0/G1 phases of the cell cycle, and that the m6A reader promoting mRNA degradation, YTHDF2 (ref. 7), interacts with R-loop-enriched loci in dividing cells. Consequently, YTHDF2 knockout leads to increased R-loop levels, cell growth retardation and accumulation of γH2AX, a marker for DNA double-strand breaks, in mammalian cells. Our results suggest that m6A regulates accumulation of R-loops, implying a role for this modification in safeguarding genomic stability.


Conflict of interest statement

Competing interests: Authors declare no competing interests.

Figures

Extended Data Fig. 1
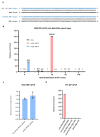
Extended Data Fig. 1. Validation of m6A DIP using synthetic RNA and DNA substrates.
Validation of m6A DIP using synthetic RNA and DNA substrates. See also Supplementary Note. (a) Schematic demonstrating the sequences of synthetic oligonucleotides and RNA:DNA hybrids used for spike in validation experiments. (b) The relative enrichment of DIP/DRIP performed on 0.1 pmol of spike in synthetic m6A-containing RNA:DNA hybrid (81-mer with 46 % GC content) shown in (a) using anti-m6A and S9.6 antibodies along with IGG for IP after the indicated time intervals of heat denaturation. (c) S9.6 DRIP exhibits comparable efficiencies in precipitating non-modified and m6A-containing RNA:DNA hybrids. Relative enrichment of DRIP performed on the m6A-containing RNA:DNA synthetic substrate normalized against that of DRIP done on equivalent amount (0.1 pmol) of non-modified spike in synthetic RNA:DNA hybrid. (d) The results of m6A DIP on 0.1 pmol of the indicated spike in synthetic oligonucleotides and RNA:DNA hybrids. Unlike non-modified RNA:DNA hybrid substrate or single stranded m6A-containing RNA oligonucleotide, m6A-containing RNA:DNA hybrid is efficiently detected by m6A DIP technique. Data are means ± SD, n=3 independent experiments.
Extended Data Fig. 2
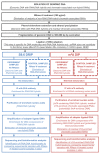
Extended Data Fig. 2. Detailed schematic illustrating S9.6 DRIP and m6A DIP techniques.
Detailed schematic illustrating S9.6 DRIP and m6A DIP techniques.
Extended Data Fig. 3
Extended Data Fig. 3. m6A is present on the majority of RNA:DNA hybrids in hiPSCs.
m6A is present on the majority of RNA:DNA hybrids in hiPSCs. (a) Heatmaps showing the distribution of density of indicated reads across genomic regions containing peaks (3 kb around peak center) of the three categories: m6A peaks overlapping with S9.6 peaks (m6A/S9.6), m6A peaks that do not overlap with S9.6 DRIP peaks (m6A only) and S9.6 peaks that do not correspond to m6A DIP peaks (S9.6 only). The colour of each line represents the density of reads for a given peak. The width of the heatmaps is normalized by peak length. (b, c) Distribution of the m6A/S9.6-, m6A only- and S9.6 only peaks at the indicated genomic features (b) and relative to transcription start site (TSS) (c) in hiPSCs.
Extended Data Fig. 4
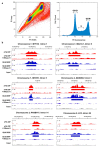
Extended Data Fig. 4. RNA:DNA hybrids exhibit cell cycle-specific dynamics in hPSCs.
RNA:DNA hybrids exhibit cell cycle-specific dynamics in hPSCs. (a) The diagram illustrating gating of single hiPSCs using PI-Area and PI-Width signals (left panel) and DNA content frequency histogram (right panel) of a representative hiPSCs population used for cell cycle analysis. hPSCs at G0/G1, S and G2/M phases are marked. (b) The coverage plots of m6A DIP and S9.6 DRIP densities (CPK) in the intronic regions of the indicated genes. m6A and S9.6 peaks are marked with red and blue rectangles.
Extended Data Fig. 5
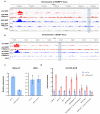
Extended Data Fig. 5. m6A DIP signal is increased upon RNase H1 knockdown in hPSCs.
m6A DIP signal is increased upon RNase H1 knockdown in hPSCs. (a, b) The coverage plots of m6A and S9.6 DRIP/DIP densities (CPK) in the regions located downstream of the m6A and S9.6 peaks (marked with red rectangles). The location of regions that were used as controls in (d) is designated by blue rectangles. (c) Relative expression of RNase H1 and LINE1 transcripts in hPSCs transfected with control non-targeting (siCTL) and RNase H1 (siRNaseH1) siRNAs. (d) The results of m6A DIP qPCR of the indicated repeats and intronic sequences performed on siCTL and siRNaseH1 hiPSCs. The regions without peaks (RANBP17 Downstream and HECW1 Downstream) were used as controls. Generic primers amplifying Alu elements from the indicated families and evolutionarily young L1Hs were used for DRIP qPCRs and qPCR. Data are means ± SD, n=3 independent experiments.
Extended Data Fig. 6
Extended Data Fig. 6. m6A is detectable on the RNA components of R-loops.
m6A is detectable on the RNA components of R-loops. (a) Schematic representation of the two round (S9.6 followed by m6A) DRIP/DIP procedure. (b, c) The results of the two round (S9.6 DRIP followed by m6A DIP) DRIP/DIP performed on individual intronic (b) and repetitive (c) m6A/S9.6 peak containing sequences. (d) Schematic representation of the m6A RIP performed on the RNA isolated from S9.6 IP-ed nucleic acids, followed by RT-qPCR of the candidate sequences. (e) The results of the m6A RIP performed on the S9.6 DRIP of individual and repetitive DRIP/m6A DIP-peak containing sequences. No RT represents control samples processed without reverse transcription. The regions without peaks (RANBP17 Downstream and HECW1 Downstream) were used as controls in (b and e). Representative results of analysis of one of 3 independent biological samples are presented. Data are means ± SD, n=3 technical repeats.
Extended Data Fig. 7
Extended Data Fig. 7. METTL3 depletion leads to accumulation of RNA:DNA hybrids in hPSCs.
METTL3 depletion leads to accumulation of RNA:DNA hybrids in hPSCs. (a) The results of S9.6 DRIP qPCR of the indicated repeats and intronic sequences performed on siCTL and siMETTL3 hiPSCs sorted at different cell cycle phases. (b) Relative expression of the indicated transcripts in siCTL and siMETTL3 hiPSCs. The difference between the values of Y-axes in (a) and in Fig.3b is due to incorporation of RNase H control samples in the analysis shown in Fig.3b. Data are means ± SD, n=3 independent experiments.
Extended Data Fig. 8
Extended Data Fig. 8. METTL3 depletion leads to an increase in the m6A DIP peaks in hPSCs.
METTL3 depletion leads to an increase in the m6A DIP peaks in hPSCs. (a) SID-UPLC-MS/MS quantification of m6A in the total nucleic acids (left panel), and in ultrafiltrate fractions released upon RNase H treatment of siCTL and siMETTL3 hPSCs (right panel). The data are means of 2 independent experiments. (b) The total numbers of consensus m6A peaks in WT and siMETTL3 hiPSCs. (c) Heatmaps showing the distribution of density of indicated reads across peak-containing genomic regions (3 kb around peak center) for S9.6 DRIP in WT and m6A DIP in WT and siMETTL3 hPSCs. The colour of each line represents the density of reads for a given peak. The width of the heatmaps is normalized by peak length. (d) Pie chart showing the percentages of transcripts differentially expressed between siCTL and siMETTL3 hPSCs (p<0.01) and without significant changes in expression amongst genes containing siMETTL3-specific m6A peaks. P values were calculated using the Standard ballgown parametric F-test. (e) Pie chart demonstrating the percentages of genes differentially expressed between siCTL and siMETTL3 hPSCs containing siMETTL3-specific m6A peaks (diff peaks) and without such peaks (No diff peaks). (f) Average profile of m6A peak densities for all genes sorted based on levels of their expression in siMETTL3 hPSCs. The colour gradient represents log10 of mean RPKM per bin. (g) Average profile of m6A peak densities for all genes sorted based on the fold change of their expression between siCTL and siMETTL3 hPSCs. The colour gradient represents log10 of mean fold change (FC) per bin.
Extended Data Fig. 9
Extended Data Fig. 9. YTHDF2 co-localizes with R-loops in vivo and interacts with synthetic m6A-marked RNA:DNA hybrids in vitro.
YTHDF2 co-localizes with R-loops in vivo and interacts with synthetic m6A-marked RNA:DNA hybrids in vitro. (a) Co-immunostaining of YTHDF2 with R-loops (S9.6) in a representative hiPSCs interphase nucleus. Merged view and individual channels are shown. The area used for S9.6/YTHDF2 signals quantification is indicated. The arrow designates the region used for generation of signal intensity profile shown in (b). (b) The profile showing intensities of YTHDF2, S9.6 and DAPI signals across the nuclear region marked with an arrow in (a). (c) Representative image of hPSCs immunostained for YTHDF2 and R-loops. Merged view and YTHDF2/S9.6 channels are shown. Scale bars are 20 μm The experiments shown in (a, c) were repeated independently 3 times with similar results. (d) Scatter diagram for YTHDF2 and S9.6 fluorescence intensities in an individual hPSCs nucleus. (e) The value of overlapping coefficient of YTHDF2 vs S9.6 intensities quantified for 20 cells immunostained for YTHDF2 and S9.6. The centre value is median, error bars show minimal and maximal values. (f, g) The results of EMSA using recombinant YTHDF2-His fusion (f) or YTHDF2-FLAG (g) and 0.15 pmol of unmodified (non) or m6A-containing (meth) RNA oligonucleotides (ssRNA) or corresponding synthetic RNA:DNA hybrids (RNA:DNA). Triangles indicate increasing concentrations of the protein (10, 100, 300 ng). Concentrations of the recombinant protein (g) and NaCl/KCl in the binding buffer are indicated. The RNA and RNA:DNA-protein complexes are arrowed. See also Supplementary Note. The gel images were cropped. The full scans of the gels are shown in Source Data 2.
Extended Data Fig. 10
Extended Data Fig. 10. YTHDF2 interacts with R-loop-containing loci in vivo and its depletion leads to accumulation of RNA:DNA hybrids in hPSCs.
YTHDF2 interacts with R-loop-containing loci in vivo and its depletion leads to accumulation of RNA:DNA hybrids in hPSCs. (a-f) The results of YTHDF2 (a, c, e) and HNRNPA2B1 (b, d, f) ChIP qPCR of the indicated repeats and intronic sequences performed on REBL-PAT hiPSCs (a, b), siCTL and siMETTL3 hPSCs (c, d) as well as on siCNTL and siRNase H1 hPSCs (e, f). (g) Relative expression of YTHDF2 transcript in hiPSCs transfected with siYTHDF2 siRNAs compared with that in non-targeting control siRNA (siCTL) transfected cells. (h, i) The results of S9.6 DRIP qPCR (h) and m6A DIP qPCR (i) of the indicated repeats and intronic sequences performed on siCTL and siYTHDF2 hiPSCs. Generic primers amplifying Alu elements from the indicated families and evolutionarily young L1Hs were used for DRIP qPCRs and qPCR. The regions without peaks (RANBP17 Downstream and HECW1 Downstream) were used as controls. Representative results of analysis of one of 3 independent biological samples are presented. Data are means ± SD, n=3 technical repeats.
Fig. 1
Fig. 1
m6A marks the RNA components of RNA:DNA hybrids in hPSCs. (a) m6A and 5-methyldeoxycytosine (5mC) co-immunostaining of KaryoMAX-treated hiPSCs without RNases and after RNase A treatment. Merged images are shown. Mitotic cells are arrowed. (b) The ratios of the indicated deoxynucleotides obtained from the quantification of LC-MS/MS peaks in KaryoMAX-treated and untreated hiPSCs/hESCs DNA. Data are means ± SD, n=2 MS experiments. (c) Immunostaining of hiPSCs using anti-m6A and anti-phospho-Histone H3 antibodies without RNases and after RNase A or combined RNases A/H treatments. Merged views are presented. (d) Box plots showing quantification of m6A signal intensity in the interphase and mitotic hiPSCs at indicated immunostaining conditions. The elements of the box plots are: center line, median; box limits, upper and lower quartiles; whiskers, minimum and maximum of all the data; n=20 nuclei for each condition. Significance was determined by unpaired two-tailed Student’s t-test. No adjustments were made for multiple comparisons. (e) Schematic illustrating design of the experiment on SID-UPLC-MS/MS analysis of hPSCs-derived nucleic acids released and retained upon RNase H treatment. (f) SID-UPLC-MS/MS quantification of m6A and ribo-m5C in the fractions of hESCs- and hiPSCs-derived nucleic acids released upon RNase H treatment. Data are shown as means ± SD, n=4/n=3 MS experiments for m6A/ribo-m5C quantification. Scale bars are 10 μm in (a) and 5 μm in (c). KaryoMAX treatment was used to enrich hPSCs for mitotic cells in (a, b). The experiments shown in (a, c) were repeated independently 6 times with similar results.
Fig. 2
Fig. 2
m6A is present on the majority of the RNA:DNA hybrids in hPSCs. (a) Schematic illustrating the m6A DIP technique. See also Extended Data Fig. 2. (b) The coverage plots of m6A DIP and S9.6 DRIP densities (CPK) in the intron of CAMTA1-201 gene. m6A DIP and S9.6 DRIP peaks are marked with red and blue rectangles. (c) Distribution of m6A and S9.6 peaks at the indicated genomic features in hiPSCs. (d) Venn diagram illustrating an overlap between m6A DIP and S9.6 DRIP consensus peaks in REBL-PAT hiPSCs. (e) Heatmaps showing the distribution of density of m6A DIP and S9.6 DRIP reads across genomic regions containing the peaks (3 kb around peak center) of the three categories: m6A peaks overlapping with S9.6 peaks (m6A/S9.6), m6A peaks that do not overlap with S9.6 DRIP peaks (m6A only) and S9.6 peaks that do not correspond to m6A peaks (S9.6 only). The color of each line represents the density of reads for a given peak. The width of the heatmaps is normalized by peak length. Median numbers of reads per normalized region within each of the peak subsets are plotted over the top of the heatmaps. As the exact mode of genomic distribution of m6A-containing RNA:DNA hybrids was initially unknown, we performed detection of both narrow and broad peaks in the datasets. The results shown were obtained from analyses of the narrow m6A and S9.6 peaks.
Fig. 3
Fig. 3
RNA:DNA hybrids exhibit cell cycle-specific dynamics in hPSCs. (a) The m6A DIP and S9.6 DRIP consensus narrow peak counts of the indicated repetitive elements in hiPSCs. (b) The results of m6A DIP and S9.6 DRIP qPCR of the indicated repeats performed on hiPSCs sorted at different cell cycle phases. Generic primers amplifying evolutionarily young L1Hs were used. (c, d) The results of S9.6 DRIP (c) and m6A DIP qPCR (d) of the RNA:DNA peaks localized in the introns of the indicated genes (See Extended Data Fig. 9b) performed on hiPSCs sorted at different phases of the cell cycle. Data are means ± SD, n=3 independent experiments in (b-d).
Fig. 4
Fig. 4
m6A reader proteins interact with RNA:DNA hybrids. (a) Western blot of RNA:DNA hybrids protein co-IP probed with indicated antibodies. Top1 and Lamin B1 serve as positive and negative controls for R-loop IP, respectively. The experiments were repeated independently 2 times for METTL3 and 3 times for other proteins with similar results. The blots were cropped. The full scans of the blots are shown in Source Data 1. (b, c) Immunostaining of hiPSCs using anti-YTHDF1 and anti-phospho-Histone H3 antibodies imaged at two different magnifications. (d, e) Immunostaining of hiPSCs for HNRNPA2B1 and m6A imaged at two different magnifications. (f, g) Immunostaining of hiPSCs for YTHDF2 and phospho-Histone H3 imaged at two different magnifications. Merged views and YTHDF1/HNRNPA2B1/YTHDF2 channels (b, d, f) or merged views and individual channels (c, e, g) are shown. The locations of the views shown in (c, e, g) are marked with dotted rectangles in (b, d, f). Scale bars are 10 μm. The experiments shown in (b-g) were repeated independently 4 times with similar results. (h) Microscale thermophoresis binding curves for YTHDF2 interaction with m6A-containing/non-modified RNA:DNA hybrid and m6A-marked/non-modified ssRNA synthetic substrates The binding is shown as fraction protein bound as a function of substrate concentration. Binding curves are fitted to the data points from experiments for m6A-containing (filled circles/triangles) and unmodified (open circles/triangles) substrates. Dissociation constant values are shown for each of the interactions. Error bars show SD, the centre values are means, n=6 independent series of experiments.
Fig. 5
Fig. 5
YTHDF2 depletion leads to accumulation of R-loops, increased accretion of m6A on RNA:DNA hybrids and cell growth retardation. (a) Immunostaining of WT and YTHDF2 KO HAP1 for YTHDF2 and phospho-Histone H3. The experiments were repeated independently 3 times with similar results. (b) Immunostaining of WT and YTHDF2 KO HAP1 for R-loops alongside the quantification of S9.6 nuclear signal. (c) DRIP qPCR of the indicated sequences performed on WT and YTHDF2 KO HAP1. RANBP17 and HECW1 downstream regions lacking DRIP peaks were used as controls. (d) SID-UPLC-MS/MS quantification of m6A and ribo-m5C in S9.6-IPs performed on WT and YTHDF2 KO HAP1 and normalized for dA or rA. RNase H-pre-treated samples were used as controls. Data are means ± SD, n=5 (left) and n=7 (right panel) measurements of 4 independent samples. (e) The growth curves of WT and YTHDF2 KO HAP1. (f) Immunostaining of WT/Ythdf2 KO mNSCs for R-loops alongside the quantification of S9.6 nuclear signal. (g) DRIP and m6A DIP qPCR of mouse LINE-1 ORF1 performed on WT and Ythdf2 KO mNSCs. Individual channels (a) or S9.6 channel (b, f) with merged views are shown. Scale bars are 10 μm. Data are means ± SD, n=3 independent experiments in (c, e, g). The elements of the box plots (b, f) are: centre line, median; box limits, upper and lower quartiles; whiskers, minimum and maximum of all the data; n, sample size, ***p < 0.0001. Significance was determined by unpaired two-tailed Student’s (b, f) or unpaired two-tailed Welch's (e) t-test.
Fig. 6
Fig. 6
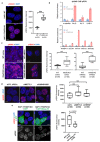
YTHDF2 depletion leads to elevated levels of H2AX phosphorylation in human and mouse cells. (a) Representative images of WT and YTHDF2 KO HAP1 cells immunostained for γH2AX, and quantification of γH2AX signal intensity in these cells. (b) The results of γH2AX ChIP qPCR of the indicated sequences performed on WT and YTHDF2 KO HAP1. Generic primers amplifying Alu elements from the indicated families and evolutionarily young L1Hs were used. Data are means ± SD, n=3 independent experiments. (c) Representative images of WT/Ythdf2 KO embryonic brain cortex and mNSCs immunostained for γH2AX alongside quantification of γH2AX signal intensity in these tissues/cells. (d) Immunostaining of siCTL, siMETTL and siHNRNPA2B1 hPSCs for γH2AX and quantification of γH2AX signal intensity in these cells. (e) Representative images of YTHDF2 KO HAP1 cells transfected with GFP-RNase H1 and GFP-only expression constructs immunostained for γH2AX, alongside the quantification of γH2AX signal intensity in the GFP-positive cells. P value is indicated. Examples of the nuclei used for signal quantification are marked with dotted shapes. Merged images and S9.6 channel views are shown in (a, c-e). Scale bars are 10 μm. The elements of the box plots shown in (a, c-e) are: centre line, median; box limits, upper and lower quartiles; whiskers, minimum and maximum of all the data, n, sample size, ***p < 0.0001. Significance was determined by unpaired two-tailed Student’s t-test, no adjustments were made for multiple comparisons.

Comment in

References

    1. Chédin F. Nascent Connections: R-Loops and Chromatin Patterning. Trends Genet. 2016;32:828–838. - PMC - PubMed
    1. Sanz LA, et al. Prevalent, Dynamic, and Conserved R-Loop Structures Associate with Specific Epigenomic Signatures in Mammals. Mol Cell. 2016;63:167–178. - PMC - PubMed
    1. Lu WT, et al. Drosha drives the formation of DNA:RNA hybrids around DNA break sites to facilitate DNA repair. Nat Commun. 2018;9 532. - PMC - PubMed
    1. Santos-Pereira JM, Aguilera A. R loops: new modulators of genome dynamics and function. Nat Rev Genet. 2015;16:583–597. - PubMed
    1. Yue Y, Liu J, He C. RNA N6-methyladenosine methylation in post-transcriptional gene expression regulation. Genes Dev. 2015;29:343–355. - PMC - PubMed

Publication types

MeSH terms