. 2020 Jan;21(1):86-100.
doi: 10.1038/s41590-019-0549-0. Epub 2019 Dec 16.

High-throughput phenotyping reveals expansive genetic and structural underpinnings of immune variation

Affiliations

High-throughput phenotyping reveals expansive genetic and structural underpinnings of immune variation

Lucie Abeler-Dörner et al. Nat Immunol. 2020 Jan.

Abstract

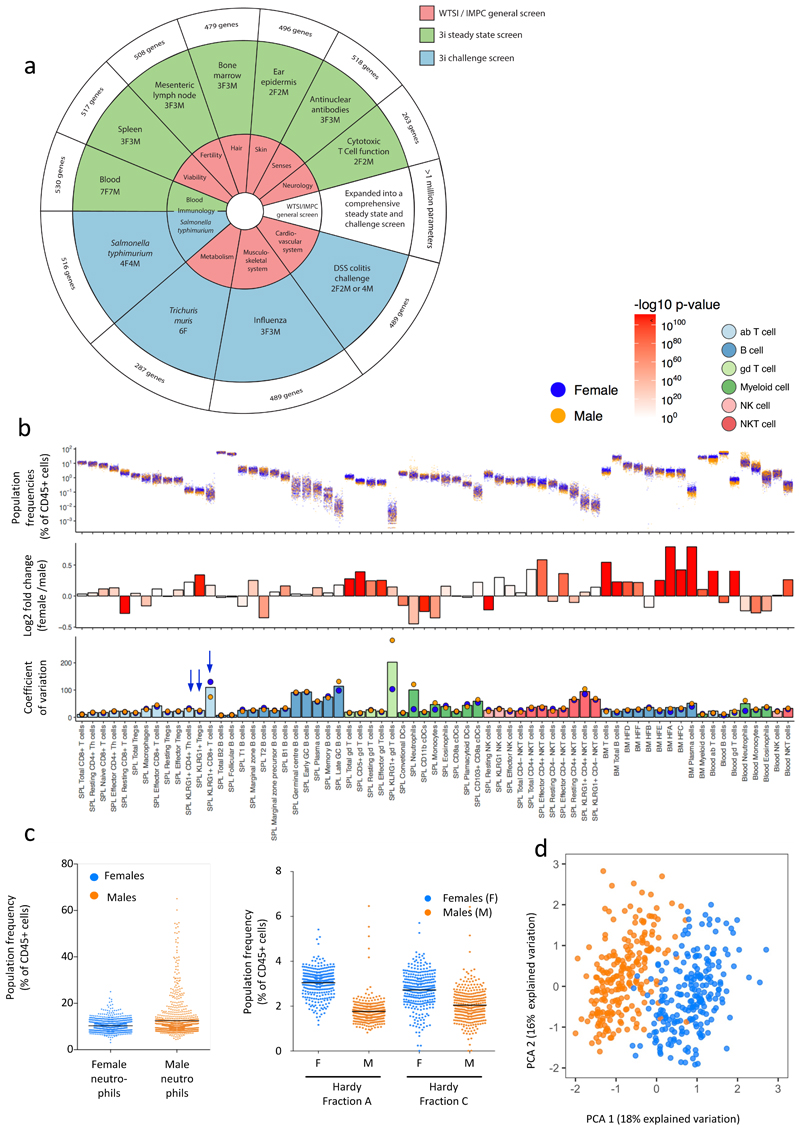
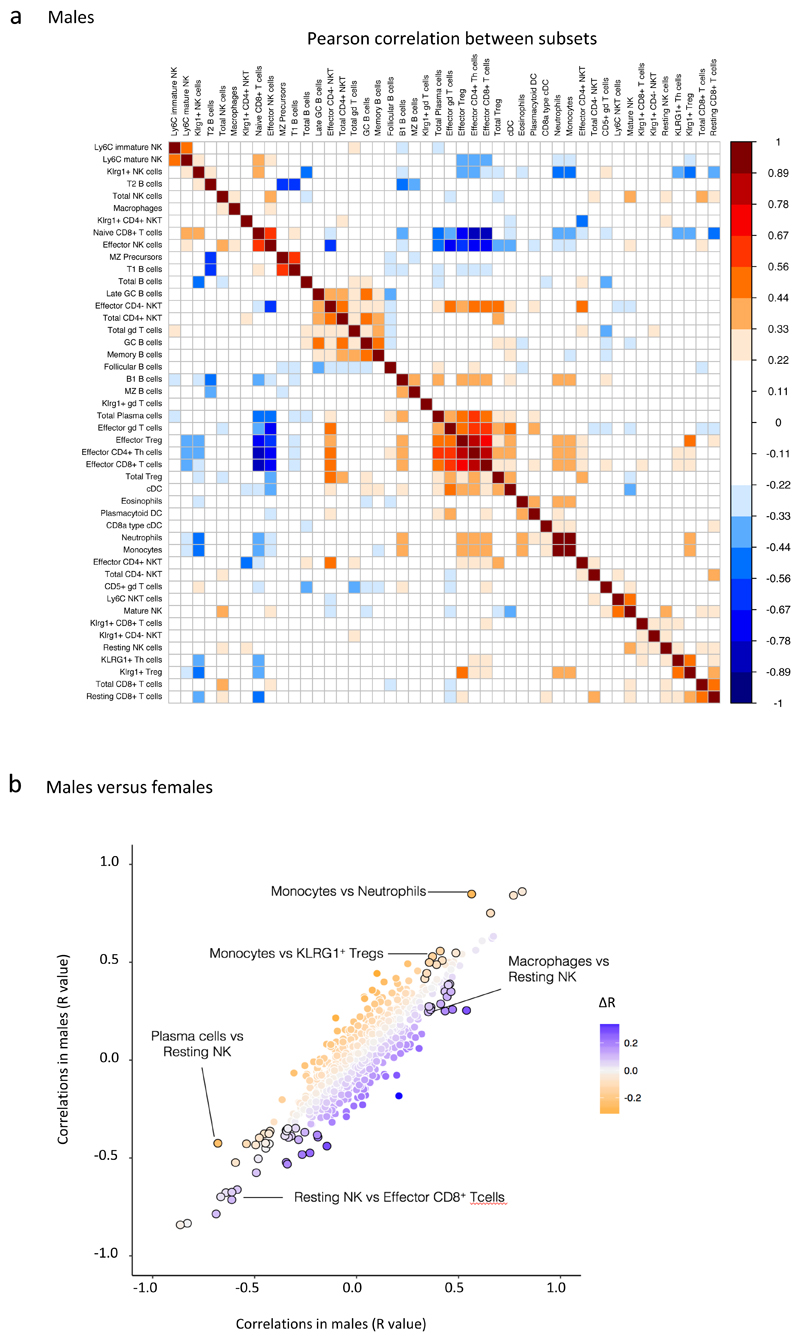
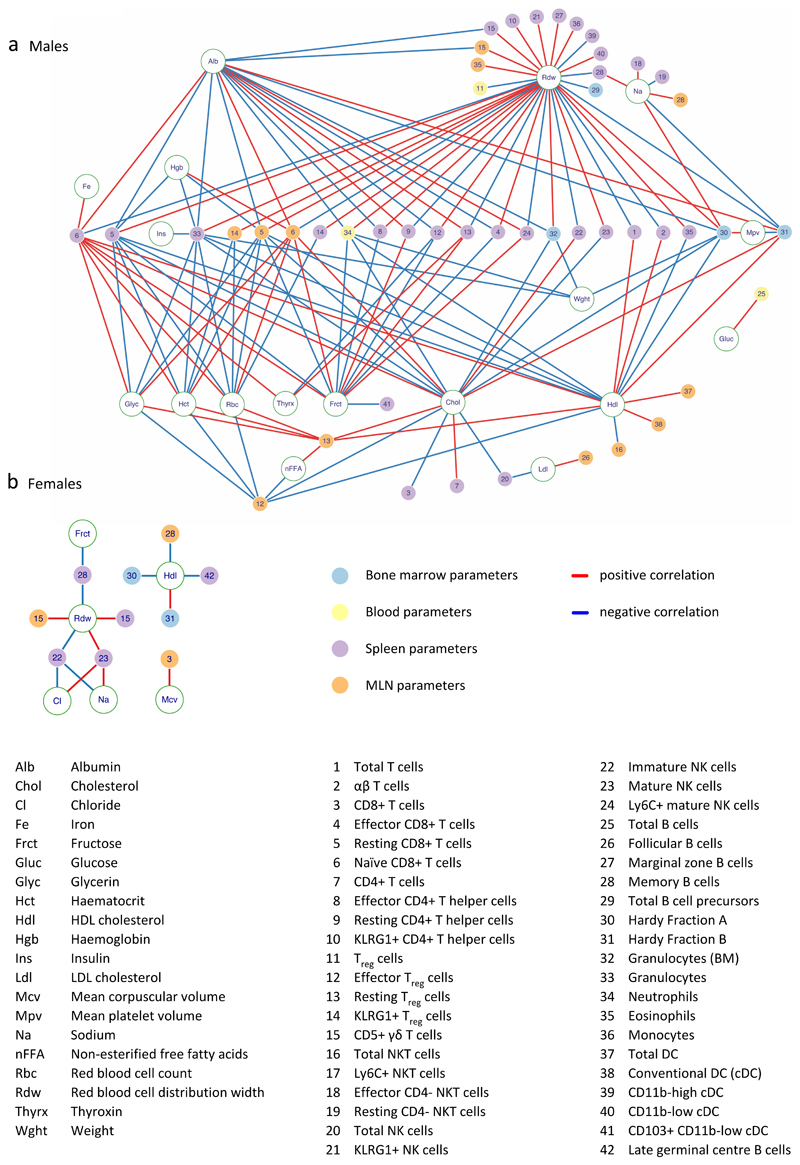
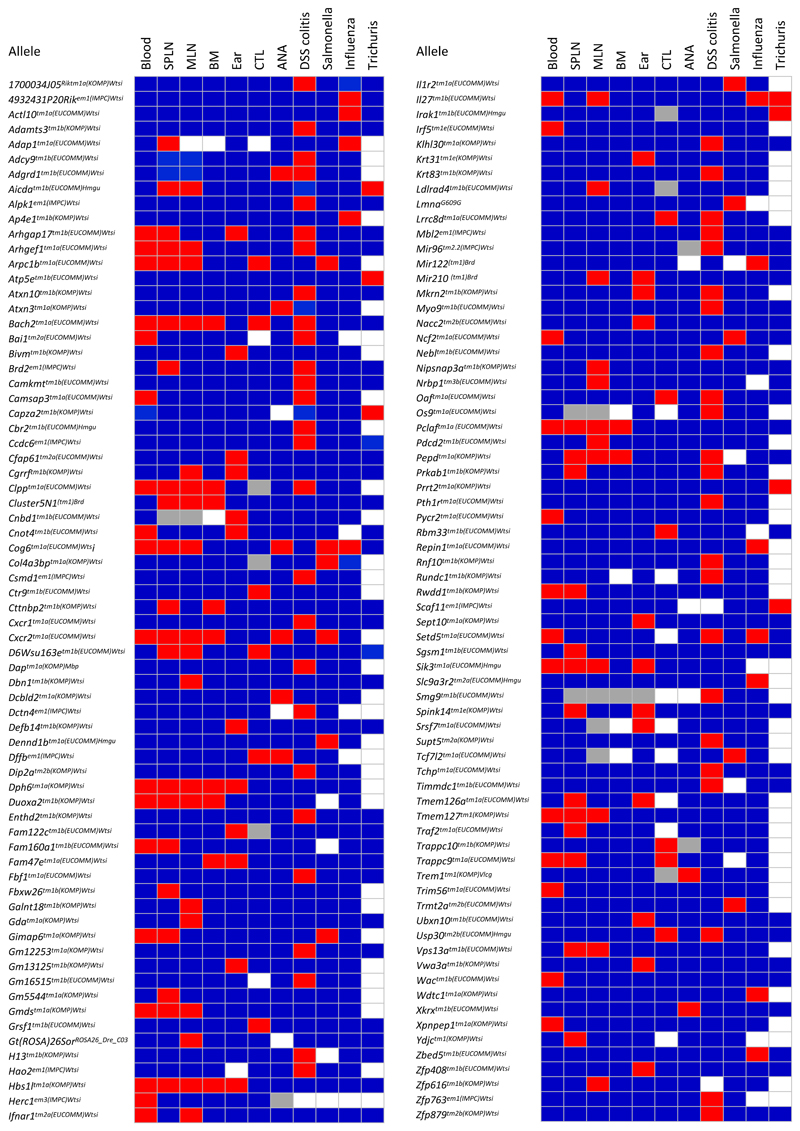
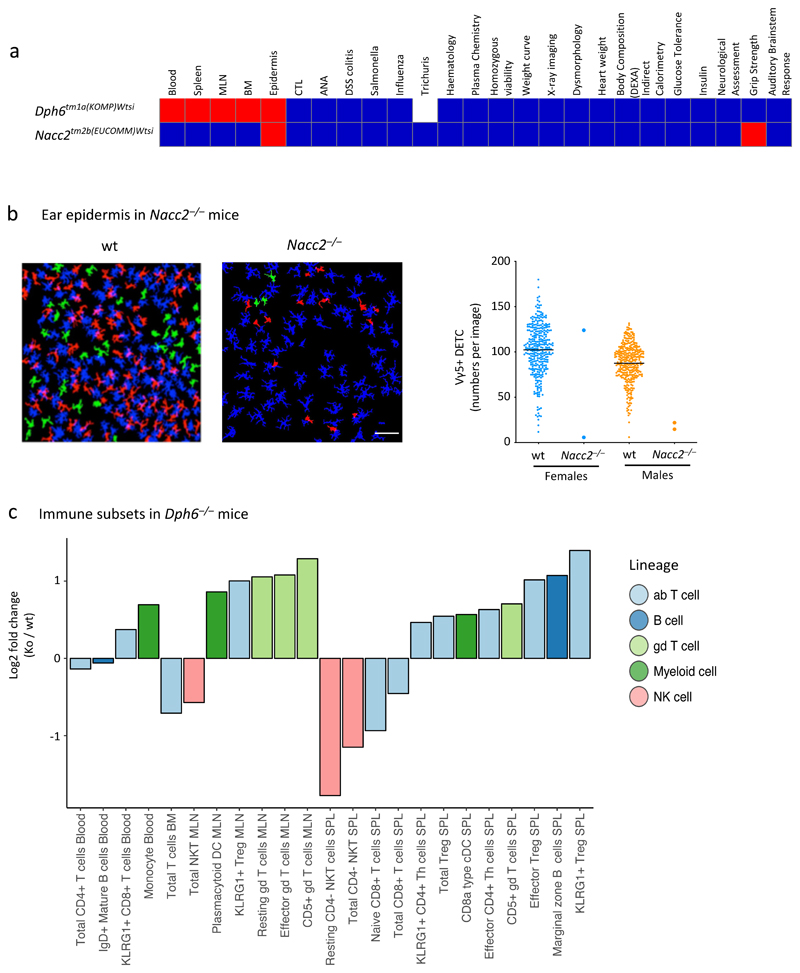
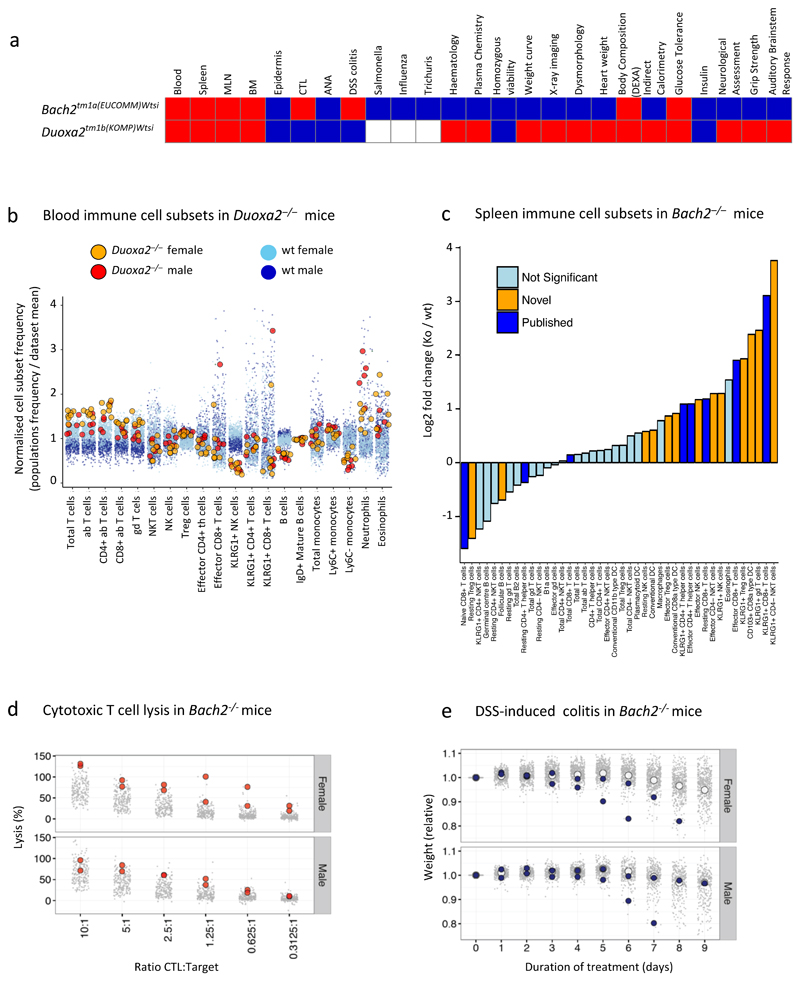
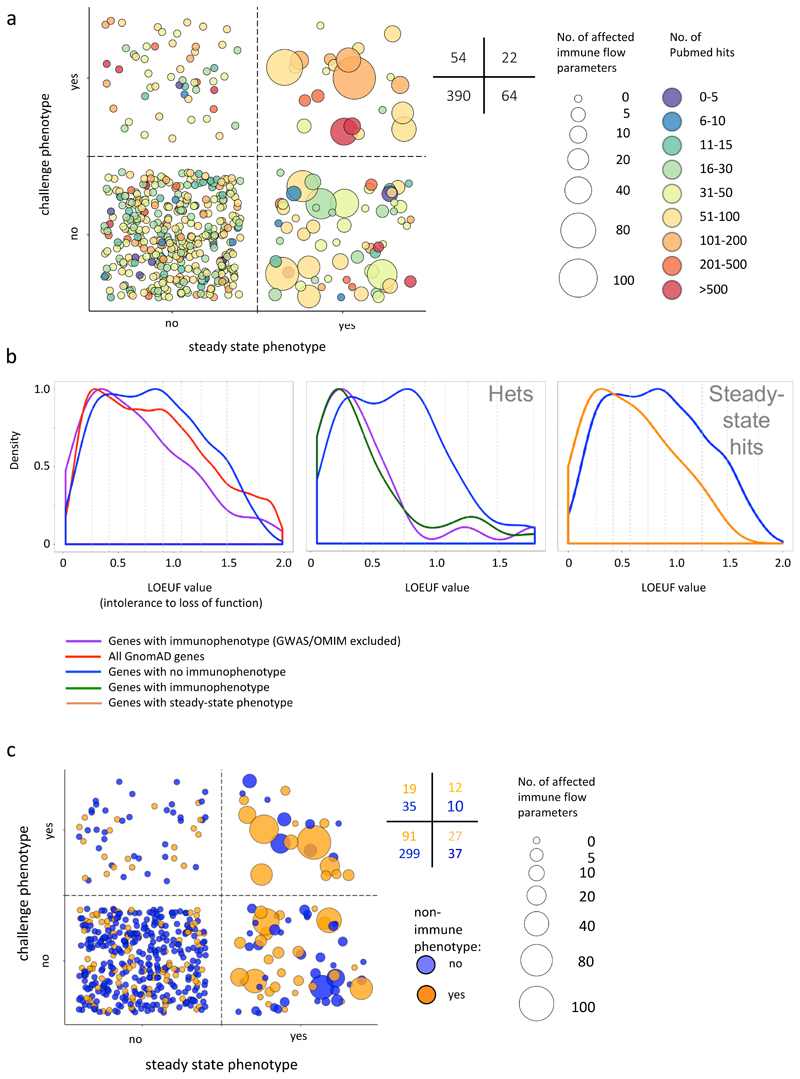
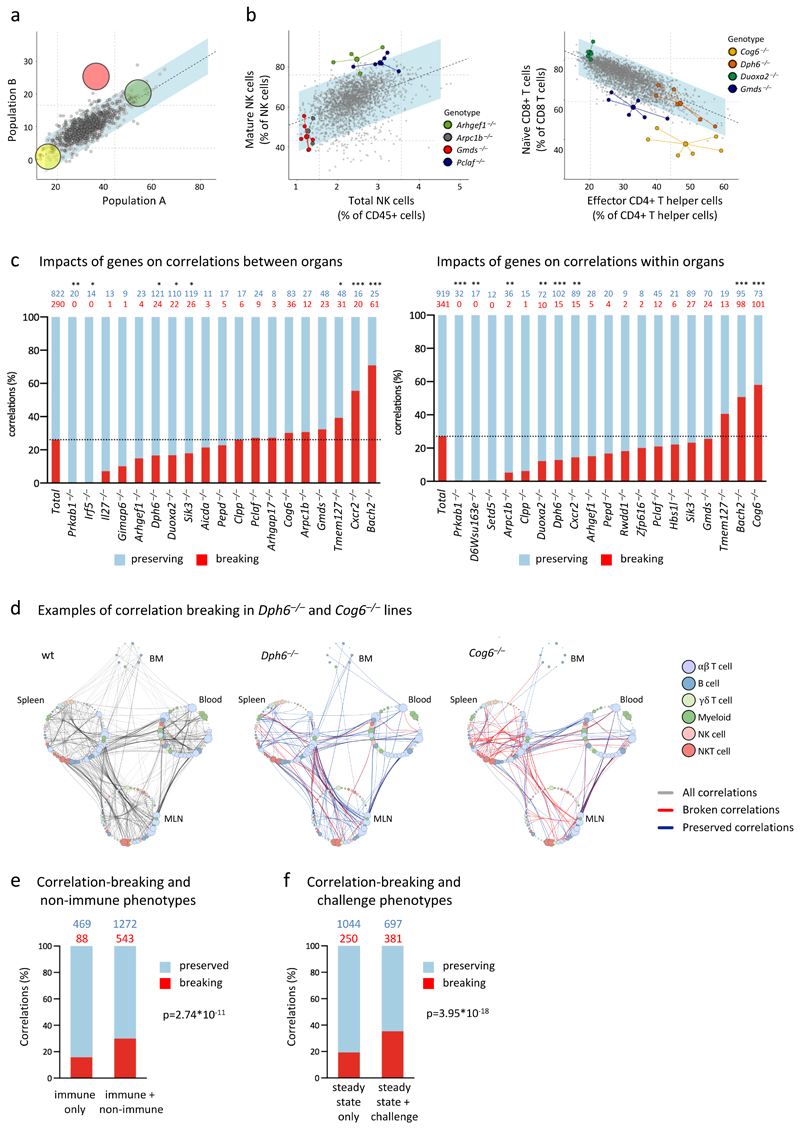
By developing a high-density murine immunophenotyping platform compatible with high-throughput genetic screening, we have established profound contributions of genetics and structure to immune variation (http://www.immunophenotype.org). Specifically, high-throughput phenotyping of 530 unique mouse gene knockouts identified 140 monogenic 'hits', of which most had no previous immunologic association. Furthermore, hits were collectively enriched in genes for which humans show poor tolerance to loss of function. The immunophenotyping platform also exposed dense correlation networks linking immune parameters with each other and with specific physiologic traits. Such linkages limit freedom of movement for individual immune parameters, thereby imposing genetically regulated 'immunologic structures', the integrity of which was associated with immunocompetence. Hence, we provide an expanded genetic resource and structural perspective for understanding and monitoring immune variation in health and disease.


Figures

Figure 1
Figure 1. Variation in immune cell subset composition with sex as a contributory driver
a. Overview of the tests performed by WTSI as part of IMPC (inner circle) and by 3i and WTSI as part of 3i (outer circle). b. Sexual dimorphism in the immune system: Population sizes as % of CD45 cells (upper panel); sexual dimorphism of mean values of population sizes as log2 fold change (middle panel, female/male); and % coefficient of variation (lower panel) of immune populations in SPL, BM and PB from 16-week old male and female wt C57BL/6N mice (n>500). Blue arrows denote cell subsets mentioned in text. Blue and orange circles in bottom panel denote CV values for female and male mice, respectively. Non adjusted p-values from two-sided Wilcoxon test. c. Left: Neutrophils from peripheral blood of 16-week old wt C57BL/6N mice (for females n=918 and for males n=913, bars represent means) Right: Hardy fractions A and C from the bone marrow of 16-week old WT C57BL/6N mice (for females n=308, for males n=315, bar represents mean) d. PCA of cell type frequencies from four tissues (SPL, MLN, BM, PB), 60 subsets, and 451 mice; colour denotes sex.
Figure 2
Figure 2. Correlations exist between immune parameters
a. Heat map represents Pearson correlations of 46 splenic immune cell subsets with each other in wt males (n>230) as determined by flow cytometry. Dark red fields denote strong positive, dark blue fields strong negative correlations between frequencies of spleen immune cell subsets. b. Correlation differences between males and females. Colour denotes ∆R, the difference between the correlation coefficient R for SPL subsets in male and female wt mice. Black circumferences mark parameter pairs that are significantly sexually dimorphic (see Materials and Methods). Correlation coefficients for male and female mice were derived from data depicted in Fig 2a and Fig S2, respectively.
Figure 3
Figure 3. Correlations between immune and non-immune parameters form a sex-specific network of interactions
Correlations with a Pearson R-value >0.33 and p<0.001 between PBL, SPL, MLN, BM with haematological, clinical blood chemistry, and additional parameters (see Supplementary Fig 3) for males (a) and females (b). Circle colours denote organ assayed; red lines denote positive correlations; blue lines, negative correlations (n>180 per sex).
Figure 4
Figure 4. 140 out of 530 genes perturb the immunophenotype
Red, significantly different from wt; blue, not significantly different from wt; white, not performed; grey, insufficient data to make a call. Each cell is coloured red when at least one of parameters within an assay is significant. Methods for determining significance of parameters are parameter-specific (see Materials and Methods and www.immunophenotyping.org).
Figure 5
Figure 5. Examples of genes with specific impacts on the immune system
a. Overview of two genes that display specific immunophenotypes. Colours as in Fig 4. Statistical methods and sample size differ between parameters – see Materials and Methods and www.immunophenotype.org for specific gene/parameter combination of n. b. Vγ5 DETC in ear epidermis of wt and Nacc2–/–mice. The image represents a z-projection of cell outlines produced by image processing in Definiens Developer XD, which were used for quantitative object-based image analysis: blue, Langerhans cells (LC); red, Vγ5+ DETC contacting LC; green, Vγ5+ DETC not contacting LC. Bottom: cumulative data for Nacc2–/–mice (n=4) versus sex-matched wt controls (for females n=330, for males n=340, bar represents mean). c. Phenotypic abnormalities in Dph6–/– mice. Fold change in immune cell subset proportions between Dph6–/– and wt mice across multiple tissues (Dph6–/–, n=6 for SPL, MLN, BM and n=14 for PBL; wt, n>500 for all parameters).
Figure 6
Figure 6. Examples of genes that impact upon the immune system and physiology
a. Overview of two genes that exhibit broad immunophenotypes. Colours as in Fig 4. Statistical methods and sample size differ between parameters – see Materials and Methods and www.immunophenotype.org for specific gene/parameter combination of n. b. Phenotypic abnormalities PBL in Duoxa2–/– mice. Relative PBL cell subset frequencies for Duoxa2–/– (n=11) versus wt mice (n>450 per sex for all parameters). Dark and light blue denote wt males and females; red and orange denote Duoxa2–/– males and females. c. Effector cell subsets in Bach2–/– mice. Fold-change in SPL cell subset composition in mutant mice (n=6) versus wt controls (n=76). Yellow represents significant cellular phenotypes not previously reported, as detected by reference range; dark blue represents significant cellular phenotypes previously reported; light blue represents non-significant differences. KLRG1+CD4- NK cells: 10-fold increase, p=1.1x10⁻⁹; reference range combined with Fisher’s exact test). d. Cytotoxic T lymphocytes in Bach2–/– mice (n=4) compared to wt controls (212 female and 208 male): grey points represent individual wt mice; red circles represent individual Bach2–/– mice. e. DSS colitis in Bach2–/– mice (n=4) compared to wt controls (n=481 female and n=315male): grey points represent individual wt mice; white circles represent wt mean values; blue circles represent individual Bach2–/– mice.
Figure 7
Figure 7. Genes affecting baseline immunophenotypes and challenge responses
a. Effected parameters and Pubmed citations per gene. Each bubble represents one gene; size represents the number of immune flow phenotypes detected for that gene; colour represents the extent to which each gene has been reported on, determined by number of Pubmed citations, as of October 2018. Numbers denote the numbers of genes in quadrants of the figure. b. Tolerance to LOF mutations in human orthologs of 3i genes. Left-hand panel: LOF tolerance scores derived from GnomAD for human orthologs of: 3i genes without hits (blue, n=334); 3i genes with hits OMIM/GWAS genes excluded (purple, n=77), and for all GnomAD genes (red, n=16037). A score of 0 denotes complete intolerance; a score of 2 complete tolerance to loss of function. Wilcoxon test: purple versus red p=0.010; purple versus blue p=0.009. Deciles of all genes marked with vertical grey broken lines. Middle panel: Genes tested in heterozygotes. 3i genes without hits (blue, n=109), 3i genes with hits (green, n=31), 3i genes with hits OMIM/GWAS genes excluded (purple, n=19). Wilcoxon test: purple versus blue p=0.0029; green versus blue p=0.003. Right-hand panel: Human orthologs of all 3i genes without hits (blue, n=334) versus genes with hits in steady state flow cytometry phenotypes but without challenge hits (orange, n=34); orange versus blue p=0.014, Wilcoxon test. c. Relationship between immune phenotypes and non-immune phenotypes. Each bubble represents one gene; size represents the number of immune flow phenotypes detected for that gene; colour indicates non-immune phenotype. Genes with any immune hit and a non-immune phenotype (orange bubbles among bubbles in top and right bottom quadrants) versus not hit genes (orange bubbles among bubbles in left bottom quadrant); p=0.000072, Fisher exact test. Genes with baseline phenotype change and a non-immune phenotype (orange bubbles among bubbles in right bottom quadrant) versus not hit genes (orange bubbles among bubbles in left quadrants); p= p=0.00021, Fisher exact test.
Figure 8
Figure 8. Phenodeviants preserve or break immunological structures.
a. Schematic illustrating the concept of structural perturbation. The yellow and green genes are theoretical hits in both correlated parameters (Pearson’s correlation), and exist as an exaggeration of the normal relationship that exists at steady state (grey dots represent wt mice). The pink gene is also a hit in both parameters, but breaks the correlation by falling outside the blue corridor that represents a 95% prediction confidence interval around the correlation line. b. Examples of genes that preserve or disrupt immunological structure. Plotted are data frequencies of SPL subsets (indicated on x- and y-axes) as determined by flow cytometry. Data from mutant lines with phenotypes are highlighted in different colours; large dots represent the x/y centroid (mean) values, small dots represent data points for each mouse. Grey data points represent wt mice and mutant mice that are comparable to wt mice for both parameters shown. n=4 for Arhgef1–/–, n=5 for Arpc1b–/–, n=5 for Gmds–/–, n=4 for Pclaf–/–. c. Genes differ in their capacity to break or preserve relationships. Stated in red font are the number of correlations that each cited gene disrupts and in blue font the residual number of correlations that each cited gene preserves, the total being all correlations contributed to by the steady-state parameters that the cited gene affects. These are represented as percentages in the left-hand graph (correlations across organs) and right-hand graph (correlations within the same organ). Only genes affecting parameters which contribute to >10 correlations are depicted. Statistical significance was determined by two-sided Fisher’s exact test in comparison to the data set average (dotted line). Number of correlations above bars, *p<0.05, **p<0.01, ***p<0.001. d. Examples of genes that either preserve or disrupt many correlations. Plotted are parameters (colour-coded according to cell lineage) in BM, SPL, MLN, and PBL, and the correlations that link them in wt mice (left panel, grey lines) or in Dph6–/– mice (middle) or Cog6–/– mice (right), in which cases blue and red lines denote correlations that are preserved or broken, respectively. e. Comparison of correlation breaking in genes that score in non-immune tests and immune tests versus genes that have hits only in immune parameters (Probit regression, p=2.74*10-11; p=7.45*10-7 when controlling for unequal numbers of correlations per gene; p=0.007 when allowing for any dependencies of correlations within a gene by using cluster-robust standard errors). Numbers of correlations above bars. f. Comparison of correlation breaking in genes that score in challenge assays and steady-state immune tests versus genes that have hits only in steady-state immune parameters (Probit regression, p=3.95*10-18; p=9.10*10-16 when controlling for unequal numbers of correlations per gene; p=0.021 when allowing for any dependencies of correlations within a gene by using cluster-robust standard errors). Numbers of correlations above bars. Separate contributions of non-immune and challenge phenotypes: p= 1.56*10-6 for non-immune controlling for challenge; p=2.93*10-13 for challenge controlling for non-immune.

References

    1. Nakaya HI, et al. Systems biology of vaccination for seasonal influenza in humans. Nat Immunol. 2011;12:786–795. - PMC - PubMed
    1. Sobolev O, et al. Adjuvanted influenza-H1N1 vaccination reveals lymphoid signatures of age-dependent early responses and of clinical adverse events. Nat Immunol. 2016;17:204–213. - PMC - PubMed
    1. Tsang JS, et al. Global Analyses of Human Immune Variation Reveal Baseline Predictors of Postvaccination Responses. Cell. 2014;157:499–513. - PMC - PubMed
    1. Wei SC, et al. Distinct Cellular Mechanisms Underlie Anti-CTLA-4 and Anti-PD-1 Checkpoint Blockade. Cell. 2017:1–32. - PMC - PubMed
    1. Brodin P, et al. Variation in the human immune system is largely driven by non-heritable influences. Cell. 2015;160:37–47. - PMC - PubMed

Publication types