. 2019 May 1;6(5):1516-1526.
doi: 10.1039/C8EN01381K. Epub 2019 Apr 10.

Development & Characterization of Fluorescently Tagged Nanocellulose for Nanotoxicological Studies

Affiliations

Development & Characterization of Fluorescently Tagged Nanocellulose for Nanotoxicological Studies

Maryam Salari et al. Environ Sci Nano. .

Abstract

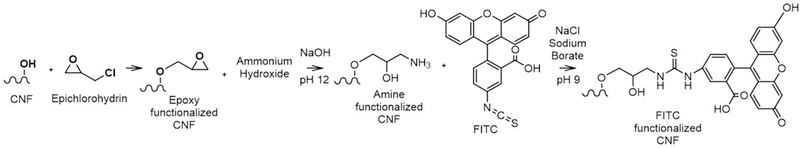
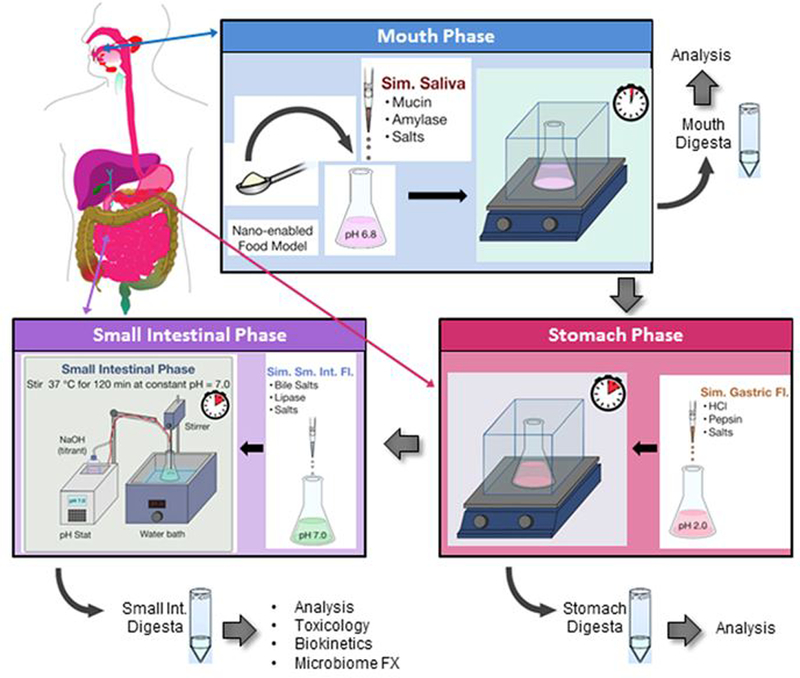
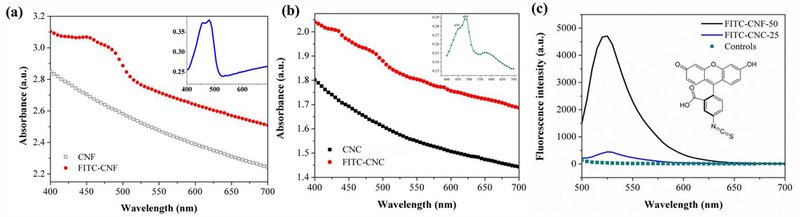
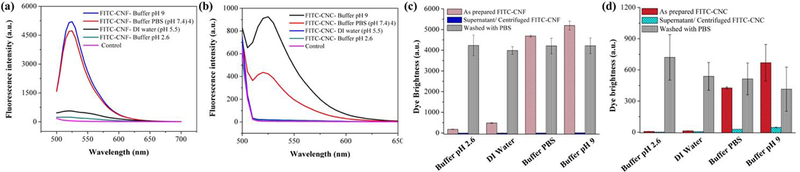
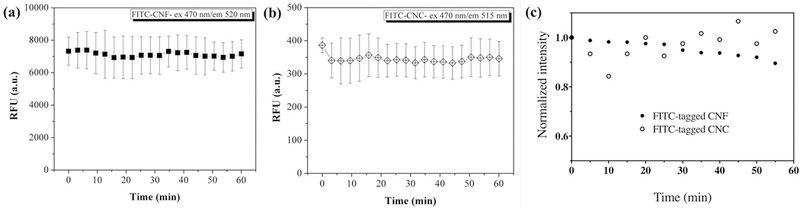
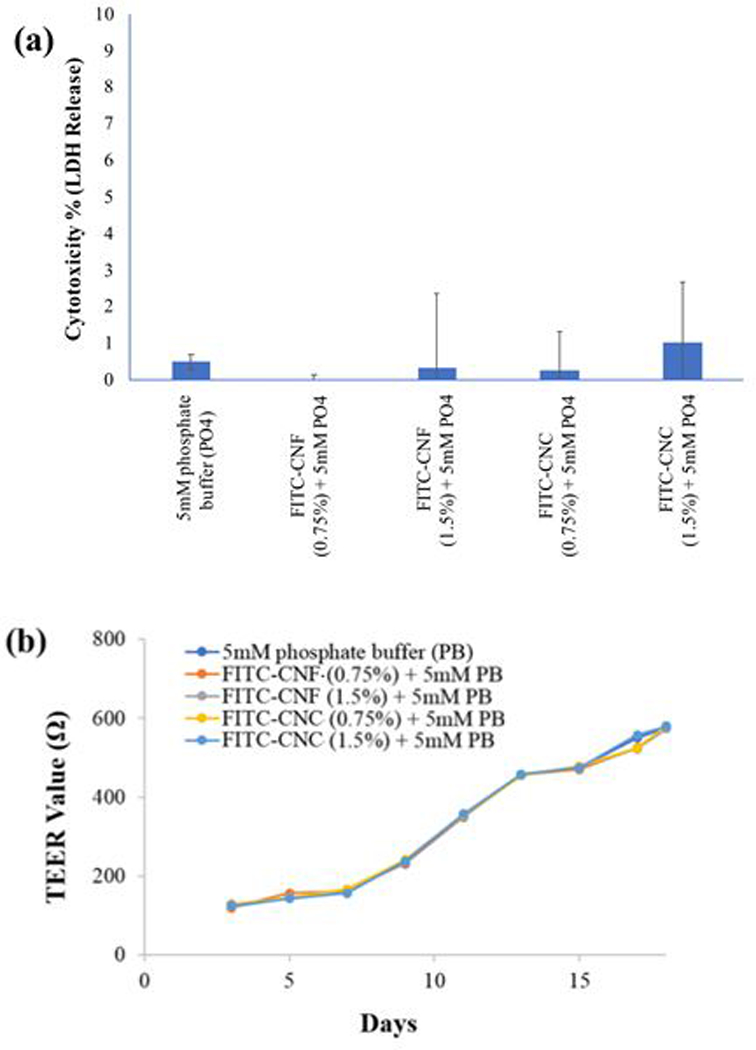
The rapid adoption of nanocellulose-based engineered nanomaterials (CNM) by many industries generates environmental health and safety (EHS) concerns. This work presents the development of fluorescently tagged CNM which can be used to study their interactions with biological systems. Specifically, cellulose nano-fibrils and cellulose nano-crystals with covalently attached fluorescein isothiocyanate (FITC) molecules on their surface were synthesized. The fluorescence of the FITC-tagged materials was assessed along with potential FITC detachment under pH conditions encountered in the human gastrointestinal tract, in intracellular compartments, and in cell culture media. Finally, the potential cytotoxicity due to the presence of FITC molecules on the surface of CNM was assessed using a cellular gut epithelium model. The results showed that neither FITC-CNF nor FITC-CNC were cytotoxic and that they have a comparable bioactivity to their untagged counterparts, rendering them suitable for biological studies.


Conflict of interest statement

Conflicts of interest There are no conflicts to declare.

Figures

Figure 1.
Figure 1.
Three-step reaction to attach FITC to CNF (the functionalization process is the same for CNC).
Figure 2.
Figure 2.
Simulated digestion of CNM present in food matrix in GIT representing mouth, stomach and small intestinal phases, (adapted from ref. 48)
Figure 3.
Figure 3.
SEM analysis of the FITC-tagged materials: (a) and (b) a representative SEM image of CNC and CNF, respectively. (c) and (d) the data analysis of CNC and CNF, respectively.
Figure 4.
Figure 4.
(a) UV-VIS absorption spectra of CNF and FITC-CNF. The inset presents the absorption spectrum of FITC-CNF without the contribution by the untagged CNF. (b) UV-VIS absorption spectra of CNC and FITC-CNC. The inset presents the absorption spectrum of FITC-CNC without the contribution by the untagged CNC. (c) Emission spectra of FITC-CNF and FITC-CNC upon excitation at 470 nm and 480 nm, respectively; the “Controls” are overlaid spectra of untagged CNF and untagged CNC. The molecular structure of fluorescein isothiocyanate (FITC) is shown as an inset. The concentration of FITC-CNF, FITC-CNC, untagged CNF, and untagged CNC were 0.5 mg/ml; cut-off wavelengths were set at 475 nm and 485 nm for FIC-CNF and FITC-CNC, respectively.
Figure 5.
Figure 5.
(a) Fluorescence emission spectra of FITC-CNF excited at 470 nm prepared at various pH values (pH 2.6 – 9). (b) Emission spectra of FITC-CNC excited at 480 nm prepared at various pH values (pH 2.6 – 9). For both (a) and (b), “Controls” are overlaid emission spectra of their untagged counterparts dispersed in the same buffers. Summary of fluorescence intensities at 520 nm obtained from FITC-tagged CNF (c) and FITC-tagged CNC (d) exposed to different pH values and compared against their respective supernatants following centrifugation. Dispersions of both FITC-tagged materials were further washed with PBS to evaluate the sustainability of fluorescence intensity at various pH values. The survey reflects the pH sensitivity of FITC fluorescence. At the same time, FITC is strongly attached to CNM and its fluorescence recovers in PBS. All suspensions are prepared at 0.5 mg/ml; standard deviations are obtained from 3 replicates (n=3).
Figure 6.
Figure 6.
Fluorescence intensity of 0.5 mg/ml FITC-tagged materials: (a) FITC-CNF and (b) FITC-CNC. The samples are exposed to excitation of 470 nm for one hour. The standard deviations are obtained from 2 replicates (n=2). (c) Photobleaching impact of confocal laser scanning microscopy on FITC-tagged CNF (solid circles) and FITC-tagged CNC (open circles). Fluorescence intensities were recorded every 5 minutes and are normalized against the values at t = 0 min.
Figure 7.
Figure 7.
(a) Lactate dehydrogenase release (cytotoxicity percentage): LDH release analysis showed no membrane damage to the GIT tri-culture cells following 24 h exposure to the FITC-CNF and FITC-CNC digesta. (b) Transepithelial electrical resistivity (TEER) analysis: a gradual increase in TEER values indicated that the cell junctions of the cellular monolayer remained intact during 17 days of cell culture. On day 18, cells were exposed for 24 hrs to the FITC-CNF and FITC-CNC digesta and the TEER values across the transwell membranes did not decrease, thus indicating no loss of cell viability or loss of cellular monolayer integrity had occurred.

References

    1. Moon RJ, Schueneman GT and Simonsen J, JOM, 2016, 68, 2383–2394.
    1. Ong KJ, Shatkin JA, Nelson K, Ede JD and Retsina T, NanoImpact, 2017, 6, 19–29.
    1. Pyrgiotakis G, Vedantam P, Cirenza C, McDevitt J, Eleftheriadou M, Leonard SS and Demokritou P, Sci. Rep., 2016, 6, 21073. - PMC - PubMed
    1. Yu H, Qin Z, Liang B, Liu N, Zhou Z and Chen L, J. Mater. Chem. A, 2013, 1, 3938.
    1. † Stephanie Beck-Candanedo, ‡ and Maren Roman and † Derek G. Gray*, , DOI:10.1021/BM049300P. - DOI - PubMed

LinkOut - more resources