. 2019 Dec 11;5(12):eaax8898.
doi: 10.1126/sciadv.aax8898. eCollection 2019 Dec.

Gastrointestinal transcription factors drive lineage-specific developmental programs in organ specification and cancer

Affiliations

Gastrointestinal transcription factors drive lineage-specific developmental programs in organ specification and cancer

Roshane Francis et al. Sci Adv. .

Abstract

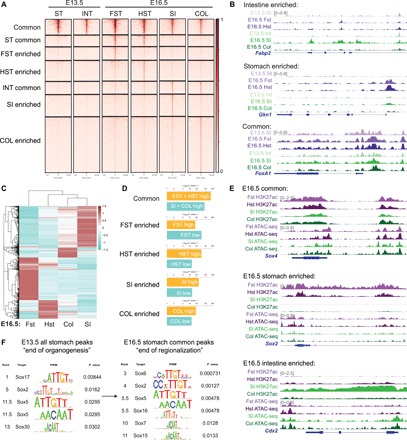
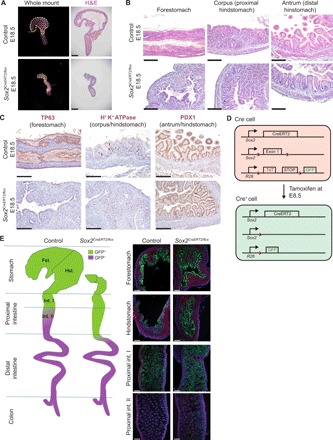
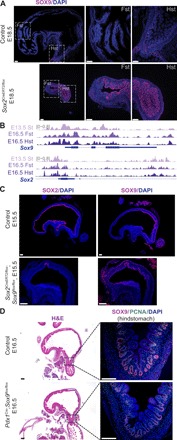
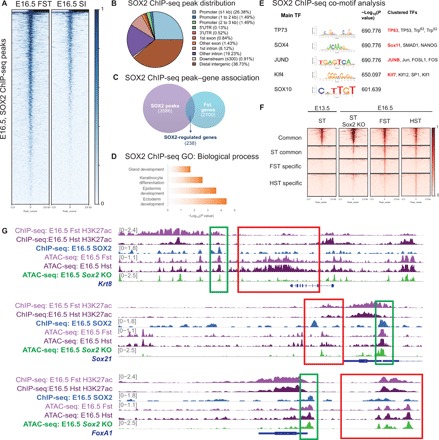
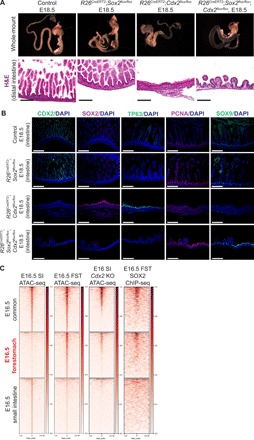
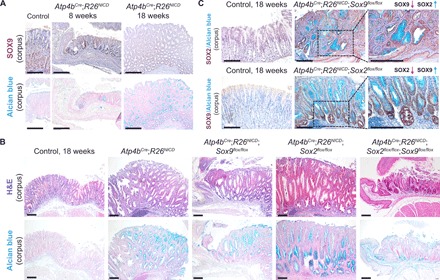
Transcription factors (TFs) are spatially and temporally regulated during gut organ specification. Although accumulating evidence shows aberrant reactivation of developmental programs in cancer, little is known about how TFs drive lineage specification in development and cancer. We first defined gastrointestinal tissue-specific chromatin accessibility and gene expression during development, identifying the dynamic epigenetic regulation of SOX family of TFs. We revealed that Sox2 is not only essential for gastric specification, by maintaining chromatin accessibility at forestomach lineage loci, but also sufficient to promote forestomach/esophageal transformation upon Cdx2 deletion. By comparing our gastrointestinal lineage-specific transcriptome to human gastrointestinal cancer data, we found that stomach and intestinal lineage-specific programs are reactivated in Sox2high /Sox9high and Cdx2high cancers, respectively. By analyzing mice deleted for both Sox2 and Sox9, we revealed their potentially redundant roles in both gastric development and cancer, highlighting the importance of developmental lineage programs reactivated by gastrointestinal TFs in cancer.


Figures

Fig. 1
Fig. 1. SOX TFs are enriched in the stomach as the chromatin landscape acquires accessibility during development.
(A) ATAC-seq profiles of E13.5 stomach and intestine compared to E16.5 forestomach, hindstomach, intestine, and colon. Region-enriched peaks are determined on the basis of E16.5 profiles, and their corresponding accessibility is analyzed in the E13.5 tissues. (B) Representative examples of ATAC-seq tracks show acquired chromatin accessibility in E16.5 stomach-specific (Gkn1) and intestinal-specific (Fabp2) loci as the GI organs become regionalized, while common, endodermal loci such as FoxA1 are accessible throughout gut development. (C) Unsupervised hierarchical clustering of E16.5 forestomach, hindstomach, small intestine, and colon transcriptomes based on the top 2000 most variable genes. (D) Binding and Expression Target Analysis (BETA) comparing association of region-specific ATAC-seq peaks to genes differentially regulated in each region at E16.5. (E) Representative examples of H3K27ac ChIP-seq and ATAC-seq peaks of common (Sox4), stomach-specific (Sox2), and intestinal-specific (Cdx2) active DNA regulatory elements such as promoters and enhancers are shown. (F) TF motif analysis of all E13.5 stomach and E16.5 stomach common ATAC-seq peaks shows enrichment of SOX TF motif. Rank indicates the ranking of the motif enrichment in all 637 mouse TF motifs. For ATAC-seq (n = 1 per group), six to eight embryonic guts were pooled. For H3K27ac ChIP-seq (n = 1 per group), 25 to 30 embryonic guts were pooled. For RNA-seq (n = 2 per group), 13 to 15 embryonic guts were pooled. ST, stomach; INT, intestine; FST, forestomach; HST, hindstomach; SI, small intestine; COL, colon.
Fig. 2
Fig. 2. Sox2 is essential for gastric specification and regionalization.
(A) Whole-mount images and subsequent histological analyses using H&E staining of control and Sox2-deleted guts at E18.5 (n ≥ 3 each). Tamoxifen was administered at E8.5. Scale bars, 200 μm. (B) Higher magnification images of gastric regions highlight the loss of squamous, forestomach and epithelium and the maintenance of glandular, hindstomach morphology in Sox2 KO mutants. Scale bars, 100 μm. (C) Immunohistochemistry of regional gastric markers reiterates the loss of TP63+ forestomach epithelium but the proper expression of hindstomach markers, H+ K+ ATPase and PDX1, in Sox2 KO embryos (n ≥ 3 each). Scale bars, 100 μm. (D) Schematic of alleles used to generate conditional Sox2-deleted embryos using tamoxifen-induced Cre-LoxP recombination for cell lineage–tracing experiments is shown. (E) Schematic (left) and fluorescence images (right) of cell lineage tracing of Sox2-deleted endodermal progenitors throughout gut development and their allocation into the different regions of the GI tract (n = 3 each). Scale bars, 100 μm.
Fig. 3
Fig. 3. Sox9 compensates for the loss of Sox2 and maintains residual gastric development.
(A) Immunofluorescence staining shows that SOX9 is ectopically expressed in Sox2 deleted proximal stomachs (n ≥ 3 each). Scale bars, 100 μm. DAPI, 4′,6-diamidino-2-phenylindole. (B) ATAC-seq tracks of Sox2 and Sox9 in stomach tissues at E13.5 and E16.5 display broad chromatin accessibility maintained during gut regionalization. (C) SOX9 expression is maintained in Sox2;Sox9 DKO embryos, shown through immunofluorescence staining (n = 3 each). Scale bars, 100 μm. (D) H&E (left) and fluorescence images (right) of Sox9-deleted embryos using an alternative gut epithelial Cre (Pdx1Cre) show normal gastric specification, with maintained SOX9 and proliferating cell nuclear antigen (PCNA) expression in the hindstomach. Dashed boxes on H&E images correspond to regions shown for subsequent immunofluorescence staining (n = 3 each). Scale bars, 100 μm.
Fig. 4
Fig. 4. SOX2 directly induces forestomach lineage-specific genes by maintaining chromatin accessibility at their loci.
(A) SOX2 ChIP-seq peaks are enriched in the E16.5 forestomach ATAC-seq profile versus the E16.5 intestinal ATAC-seq profile, which lacks Sox2 expression. For SOX2 ChIP-seq (n = 1), 30 embryonic stomachs were pooled. (B) Genomic distribution of SOX2 ChIP-seq peaks. 5′UTR, 5′ untranslated region. (C) Venn diagram outlining the overlap between SOX2 target gene associations and the top 2100 most highly expressed genes in the E16.5 forestomach transcriptome (P < 0.05 and fold change > 1.5 when compared to the E16.5 small intestinal transcriptome). FC, fold change. (D) GO term analysis of SOX2-regulated forestomach genes. (E) Co-TF motif analysis shows enrichment for motifs important in squamous epithelium (TP63), endodermal development (SOX4), and embryonic stem cells [Kruppel-like factor 4 (KLF4)]. (F) Comparison of E16.5 forestomach and hindstomach and E13.5 stomach ATAC-seq heat maps to E16.5 Sox2 KO stomach ATAC-seq data shows loss of forestomach-enriched peaks. The peaks are categorized on the basis of the common and region-enriched peaks defined in Fig. 1. (G) Alignment of E16.5 forestomach and hindstomach ATAC-seq and H3K27ac ChIP-seq tracks with SOX2 ChIP-seq to show examples of SOX2 directly regulated genes (the green box highlights Sox2 binding site in proximity to the gene of interest). E16.5 Sox2 KO ATAC-seq profile demonstrates that forestomach lineage-specific open chromatin regions become inaccessible in Sox2 KO embryos, but the same is not observed for Sox2-regulated endodermal genes (the red box outlines corresponding ATAC-seq signal).
Fig. 5
Fig. 5. Loss of Sox2 rescues forestomach/esophageal transformation induced by Cdx2 deletion.
(A) Whole-mount images and subsequent histological analyses using H&E staining of control and Sox2;Cdx2 doubly deleted guts at E18.5 (n ≥ 3 each). Cre-LoxP recombination was induced at E8.5. Scale bars, 100 μm. (B) Immunofluorescence images show CDX2, SOX2, TP63, PCNA, and SOX9 staining in control, Sox2 KO, Cdx2 KO, and Sox2;Cdx2 DKO embryos. Scale bars, 100 μm. (C) Comparison of E16.5 common-, forestomach-, and small intestine–enriched ATAC-seq peaks in publicly available Cdx2 KO ATAC-seq data. Ectopic forestomach-specific peaks in Cdx2 KO embryos are associated with SOX2 binding (SOX2 ChIP-seq). Cdx2KO ATAC-seq was performed in E16 intestine tissue by Banerjee et al. and retrieved from GSM3181688. SOX2 ChIP-Seq was performed in E16.5 forestomach epithelium.
Fig. 6
Fig. 6. Developmental stomach and intestinal programs are enriched in Sox2high- and Cdx2high-expressing GI cancers, respectively.
(A) Top: Differential genes expressed in Sox2high, Sox9high, and Cdx2high human stomach cancer (STAD) transcriptomes are compared to our E16.5 GI RNA-seq profiles. Bottom: Gene set enrichment analysis reveals strong associations between Sox2high/Sox9high cancer genes and the E16.5 stomach profiles and between Cdx2high cancer genes and the E16.5 intestinal profiles. (B) Similar analysis conducted using human colon cancer (COAD) transcriptomes from TCGA shows the activation of stomach and intestinal lineage-specific genes in Sox2high/Sox9high and Cdx2high cancers, respectively.
Fig. 7
Fig. 7. Single deletion of Sox2 or Sox9 in gastric adenoma mice increases cancer severity, whereas DKO rescues tumor severity when compared to singly deleted counterparts.
(A) SOX9 immunohistochemistry (top) and Alcian blue staining (bottom) show SOX9 overexpression at sites of adenomatous epithelium in early (8 weeks) and late (18 weeks) adenoma mice (n = 3 each). Scale bars, 100 μm. (B) Corresponding H&E (top) and Alcian blue (bottom) staining shows the aberrant changes in gastric epithelial structure and cell types in the various adenoma models (n ≥ 3 for Atp4bCre;R26NICD, Atp4bCre;R26NICD;Sox2flox/flox, Atp4bCre;R26NICD;Sox9flox/flox, and Atp4bCre;R26NICD;Sox2flox/flox;Sox9flox/flox mice). Scale bars, 100 μm. (C) SOX2 immunohistochemistry in Atp4bCre;R26NICD;Sox9flox/flox mice (top) and SOX9 immunohistochemistry in Atp4bCre;R26NICD;Sox2flox/flox mice (bottom) demonstrate reciprocal activation in the absence of either SOX TF (n = 3 each). Scale bars, 100 μm.

References

    1. Ferlay J., Shin H.-R., Bray F., Forman D., Mathers C., Parkin D. M., Estimates of worldwide burden of cancer in 2008: GLOBOCAN 2008. Int. J. Cancer 127, 2893–2917 (2010). - PubMed
    1. Giroux V., Rustgi A. K., Metaplasia: Tissue injury adaptation and a precursor to the dysplasia-cancer sequence. Nat. Rev. Cancer 17, 594–604 (2017). - PMC - PubMed
    1. Li X., Zhang C., Gong T., Ni X., Li J., Zhan D., Liu M., Song L., Ding C., Xu J., Zhen B., Wang Y., Qin J., A time-resolved multi-omic atlas of the developing mouse stomach. Nat. Commun. 9, 4910 (2018). - PMC - PubMed
    1. Sherwood R. I., Chen T.-Y., Melton D. A., Transcriptional dynamics of endodermal organ formation. Dev. Dyn. 238, 29–42 (2009). - PMC - PubMed
    1. Willet S. G., Mills J. C., Stomach organ and cell lineage differentiation: From embryogenesis to adult homeostasis. Cell. Mol. Gastroenterol. Hepatol. 2, 546–559 (2016). - PMC - PubMed

Publication types

MeSH terms