. 2019 Dec 11;5(12):eaay1211.
doi: 10.1126/sciadv.aay1211. eCollection 2019 Dec.

Focusing light inside live tissue using reversibly switchable bacterial phytochrome as a genetically encoded photochromic guide star

Affiliations

Focusing light inside live tissue using reversibly switchable bacterial phytochrome as a genetically encoded photochromic guide star

Jiamiao Yang et al. Sci Adv. .

Abstract

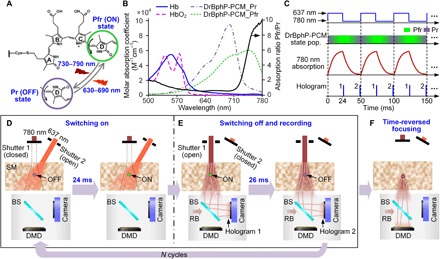
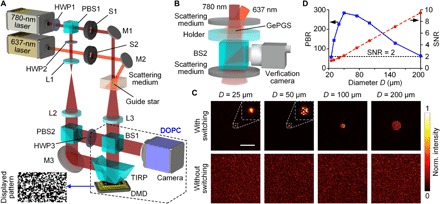
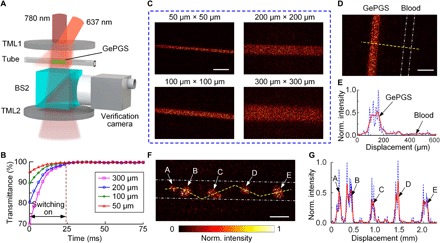
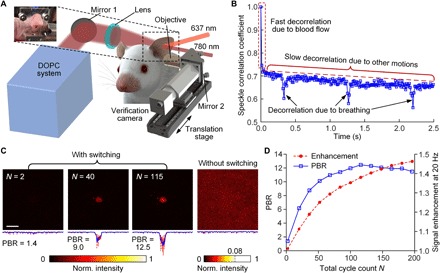
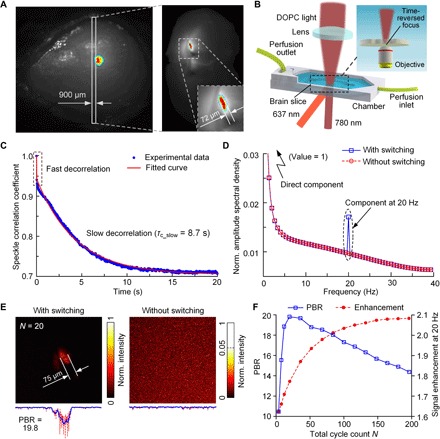
Focusing light deep by engineering wavefronts toward guide stars inside scattering media has potential biomedical applications in imaging, manipulation, stimulation, and therapy. However, the lack of endogenous guide stars in biological tissue hinders its translations to in vivo applications. Here, we use a reversibly switchable bacterial phytochrome protein as a genetically encoded photochromic guide star (GePGS) in living tissue to tag photons at targeted locations, achieving light focusing inside the tissue by wavefront shaping. As bacterial phytochrome-based GePGS absorbs light differently upon far-red and near-infrared illumination, a large dynamic absorption contrast can be created to tag photons inside tissue. By modulating the GePGS at a distinctive frequency, we suppressed the competition between GePGS and tissue motions and formed tight foci inside mouse tumors in vivo and acute mouse brain tissue, thus improving light delivery efficiency and specificity. Spectral multiplexing of GePGS proteins with different colors is an attractive possibility.


Figures

Fig. 1
Fig. 1. Principle of GePGS-guided optical focusing inside scattering media.
(A) Photoswitching of DrBphP-PCM chromophore from the Pfr state to the Pr state, and vice versa, induced by 780- and 637-nm light illumination, respectively. The photoswitchings result from the out-of-plane rotation (black arrows) of the D ring of biliverdin about the adjacent C15/16 double bond between the C and D pyrrole rings. (B) Molar absorption spectra of oxyhemoglobin (HbO2), deoxyhemoglobin (Hb), Pfr (ON), and Pr (OFF) states of DrBphP-PCM. The absorption coefficient ratio (black solid line) between the two states (Pfr/Pr) is ~10 at 780 nm. (C) Time sequence of GePGS-guided DOPC system (pop., population). (D) Switching the DrBphP-PCM to the ON state by a 637-nm laser beam with a duration of 24 ms. (E) Switching the DrBphP-PCM to the OFF state by a 780-nm laser beam with a duration of 26 ms and capturing two holograms with an interval of 25 ms. (F) Time-reversed focusing on the GePGS inside a scattering medium. BS, beam splitter; RB, reference beam.
Fig. 2
Fig. 2. Experimental setup and characterization of GePGS optical focusing.
(A) Schematic illustration of the experimental setup. HWP, half wave plate; PBS, polarizing beam splitter; S, shutter; M, mirror; L, lens; BS, beam splitter; TIRP, total internal reflection prism; DMD, digital micromirror device. (B) Setup for quantifying the GePGS-guided focusing inside a scattering medium. (C) Normalized (Norm.) intensity distributions of the optical foci in between two scattering media with different diameters (D) of guide stars. Top row, with 637-nm light switching; bottom row, without 637-nm light switching. Each image is self-normalized. Scale bar, 300 μm. (D) PBRs of the foci with different GePGS diameters, and the corresponding SNRs of the captured holograms.
Fig. 3
Fig. 3. In vitro demonstration of focusing light onto GePGS inside scattering media.
(A) Experimental setup for in vitro demonstration. TML, tissue-mimicking layer. (B) Normalized transmittance of the light passing through the tubes with different diameters filled with GePGS (300 μM). The inner dimensions of the square tubes were 50, 100, 200, and 300 μm. (C) Images of the focused light onto GePGS injected into the tubes with different sizes. Scale bar, 300 μm. (D) Image shows that light is focused only onto the GePGS, not blood. Two tubes filled with GePGS and blood are placed side by side. The white dash-dotted lines represent the inner walls of the tube filled with blood. The inner dimensions of the tubes were both 100 μm. Scale bar, 200 μm. (E) Normalized intensity distribution along the yellow dashed line in (D). The blue dashed line is the measured value, and the red solid line is the smoothed curve with a span of 10 points. (F) Image of the focused light onto a tube filled with U87 cells expressing GePGS. It shows that light is focused onto the GePGS-expressing cells/cell clusters. The white dash-dotted lines represent the inner walls of the tube. Scale bar, 300 μm. (G) Normalized intensity distribution along the yellow dashed line in (F). The blue dashed line is the measured value, and the red solid line is the smoothed curve with a span of 10 points.
Fig. 4
Fig. 4. In vivo demonstration of focusing light inside tumors.
(A) Schematic of the setup for focusing light inside tumors on the mouse ear in vivo. A microscope is placed on a translation stage and can be moved horizontally into the light path to image the time-reversed focus. (B) Speckle correlation coefficient as a function of time for a living mouse ear. Three speckle decorrelation characteristics were identified. (C) Normalized intensity distributions of the optical foci inside the tumor on the mouse ear. Left, with 637-nm light switching for N = 2, 40, and 115 cycles; right, without 637-nm light switching. Scale bar, 100 μm. (D) Signal enhancement of tagged photons (at 20 Hz) and the PBR of time-reversed focusing as a function of the total cycle count N.
Fig. 5
Fig. 5. Demonstration of focusing light inside brain slices.
(A) Fluorescence images of the transduced mouse brain in vivo, and a live brain slice showing expression of the GePGS. The differential fluorescence signals between the ON and OFF states highlight the brain tissue expressing RSBPs, which are shown in color, and the background signals are shown in gray. Excitation wavelength, 630 nm. (B) Schematic of the setup for focusing light inside brain slices. (C) Speckle correlation coefficient as a function of time for a live brain slice. Two speckle decorrelation characteristics are identified. (D) Normalized amplitude spectral density of the detected photons, where a peak is observed at 20 Hz with light switching. (E) Normalized intensity distributions of the optical foci inside a brain slice. Left, with 637-nm light switching for N = 20; right, without 637-nm light switching. (F) Signal enhancement of tagged photons (at 20 Hz) and the PBR of time-reversed focusing as a function of the total cycle count N.

References

    1. Ntziachristos V., Going deeper than microscopy: The optical imaging frontier in biology. Nat. Methods 7, 603–614 (2010). - PubMed
    1. Lai P., Wang L., Tay J. W., Wang L. V., Photoacoustically guided wavefront shaping for enhanced optical focusing in scattering media. Nat. Photonics 9, 126–132 (2015). - PMC - PubMed
    1. Sarma R., Yamilov A. G., Petrenko S., Bromberg Y., Cao H., Control of energy density inside a disordered medium by coupling to open or closed channels. Phys. Rev. Lett. 117, 086803 (2016). - PubMed
    1. Popoff S. M., Lerosey G., Carminati R., Fink M., Boccara A. C., Gigan S., Measuring the transmission matrix in optics: An approach to the study and control of light propagation in disordered media. Phys. Rev. Lett. 104, 100601 (2010). - PubMed
    1. Yu H., Hillman T. R., Choi W., Lee J. O., Feld M. S., Dasari R. R., Park Y., Measuring large optical transmission matrices of disordered media. Phys. Rev. Lett. 111, 153902 (2013). - PMC - PubMed

Publication types