Overlapping genetic architecture between Parkinson disease and melanoma
- PMID: 31845298
- PMCID: PMC7379325
- DOI: 10.1007/s00401-019-02110-z
Overlapping genetic architecture between Parkinson disease and melanoma
Erratum in
-
Correction to: Overlapping genetic architecture between Parkinson disease and melanoma.Acta Neuropathol. 2020 May;139(5):963. doi: 10.1007/s00401-020-02143-9. Acta Neuropathol. 2020. PMID: 32172342
Abstract
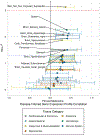
Epidemiologic studies have reported inconsistent results regarding an association between Parkinson disease (PD) and cutaneous melanoma (melanoma). Identifying shared genetic architecture between these diseases can support epidemiologic findings and identify common risk genes and biological pathways. Here, we apply polygenic, linkage disequilibrium-informed methods to the largest available case-control, genome-wide association study summary statistic data for melanoma and PD. We identify positive and significant genetic correlation (correlation: 0.17, 95% CI 0.10-0.24; P = 4.09 × 10-06) between melanoma and PD. We further demonstrate melanoma and PD-inferred gene expression to overlap across tissues (correlation: 0.14, 95% CI 0.06 to 0.22; P = 7.87 × 10-04) and highlight seven genes including PIEZO1, TRAPPC2L, and SOX6 as potential mediators of the genetic correlation between melanoma and PD. These findings demonstrate specific, shared genetic architecture between PD and melanoma that manifests at the level of gene expression.
Keywords: Genetic correlation; Melanoma; Parkinson disease; Polygenic; Shared genetic architecture; TWAS.
Conflict of interest statement
Figures


References
-
- Beecham GW, Dickson DW, Scott WK, Martin ER, Schellenberg G, Nuytemans K, Larson EB, Buxbaum JD, Trojanowski JQ, Van Deerlin VM, Hurtig HI, Mash DC, Beach TG, Troncoso JC, Pletnikova O, Frosch MP, Ghetti B, Foroud TM, Honig LS, Marder K, Vonsattel JP, Goldman SM, Vinters HV, Ross OA, Wszolek ZK, Wang L, Dykxhoorn DM, Pericak-Vance MA, Montine TJ, Leverenz JB, Dawson TM, Vance JM (2015) PARK10 is a major locus for sporadic neuropathologically confirmed Parkinson disease. Neurology 84:972–980. doi: 10.1212/WNL.0000000000001332 - DOI - PMC - PubMed
-
- Bertoni JM, Arlette JP, Fernandez HH, Fitzer-Attas C, Frei K, Hassan MN, Isaacson SH, Lew MF, Molho E, Ondo WG, Phillips TJ, Singer C, Sutton JP, Wolf JE (2010) Increased Melanoma Risk in Parkinson Disease: A Prospective Clinicopathological Study. Arch Neurol 67:347–352. doi: 10.1001/archneurol.2010.1 - DOI - PubMed
Publication types
MeSH terms
Grants and funding
- P30 AG066444/AG/NIA NIH HHS/United States
- R01 AG057777/AG/NIA NIH HHS/United States
- R01 AG058501/AG/NIA NIH HHS/United States
- BAND-14-338165/ALZ/Alzheimer's Association/United States
- 16565/CRUK_/Cancer Research UK/United Kingdom
- K08 NS101118/NS/NINDS NIH HHS/United States
- R01 HL119813/HL/NHLBI NIH HHS/United States
- R01 HL105756/HL/NHLBI NIH HHS/United States
- 19167/CRUK_/Cancer Research UK/United Kingdom
- R01 AG033193/AG/NIA NIH HHS/United States
- AARG-16-441560/ALZ/Alzheimer's Association/United States
- WT_/Wellcome Trust/United Kingdom
- NIRG-11-200110/ALZ/Alzheimer's Association/United States
- 10589/CRUK_/Cancer Research UK/United Kingdom
- U01 AG058922/AG/NIA NIH HHS/United States
- R01 AG044546/AG/NIA NIH HHS/United States
- U24 AG021886/AG/NIA NIH HHS/United States
- U01 AG032984/AG/NIA NIH HHS/United States
- RF1 AG053303/AG/NIA NIH HHS/United States
- U01 AG016976/AG/NIA NIH HHS/United States
- P01 AG003991/AG/NIA NIH HHS/United States
- P50 AG005681/AG/NIA NIH HHS/United States
- BFG-15-362540/ALZ/Alzheimer's Association/United States
- K01 AG046374/AG/NIA NIH HHS/United States
- 16563/CRUK_/Cancer Research UK/United Kingdom
- 082604/2/07/Z/WT_/Wellcome Trust/United Kingdom
- P30 AG066546/AG/NIA NIH HHS/United States
- RF1 AG044546/AG/NIA NIH HHS/United States

