. 2019 Dec 17:8:e49750.
doi: 10.7554/eLife.49750.

Compensatory sequence variation between trans-species small RNAs and their target sites

Affiliations

Compensatory sequence variation between trans-species small RNAs and their target sites

Nathan R Johnson et al. Elife. .

Abstract

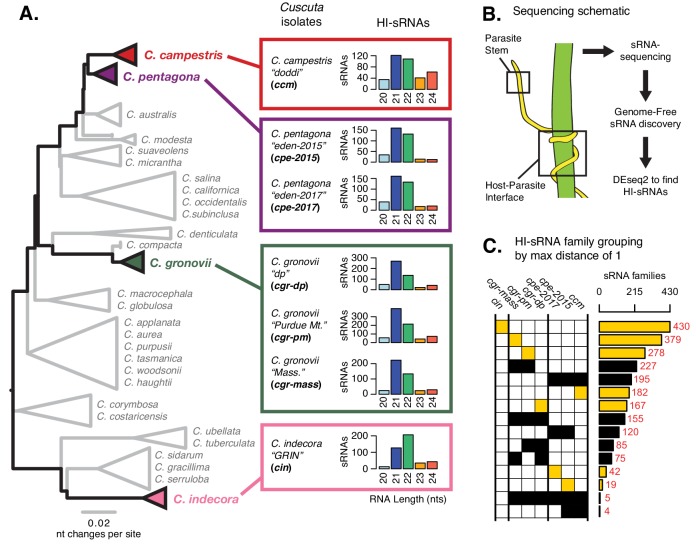
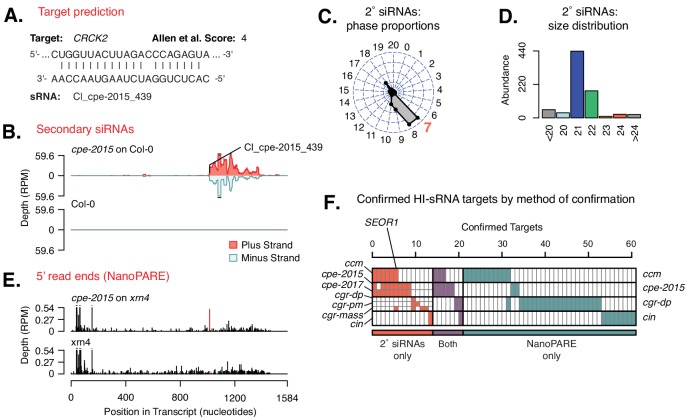
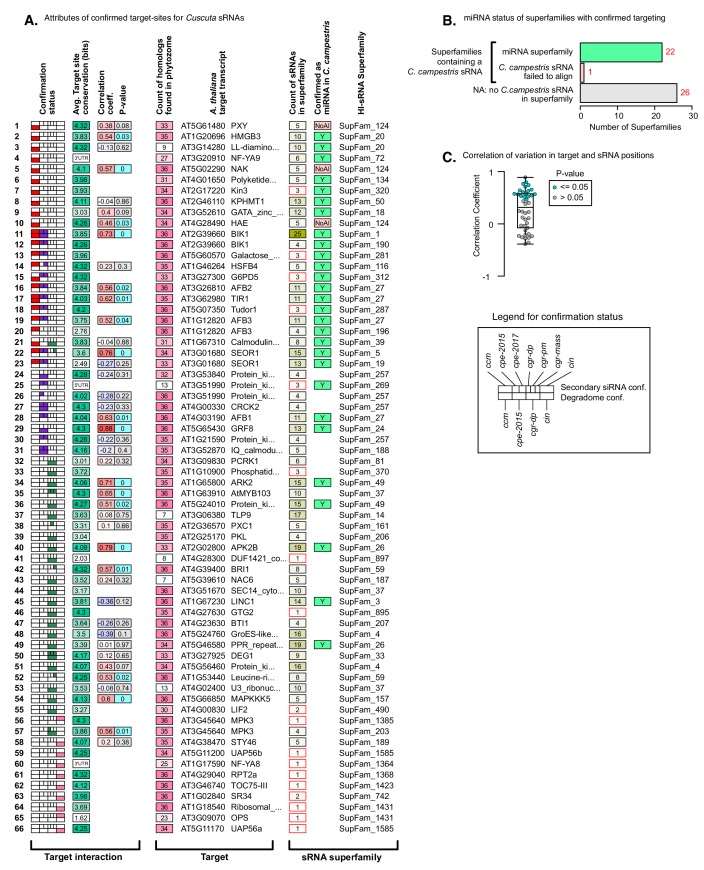
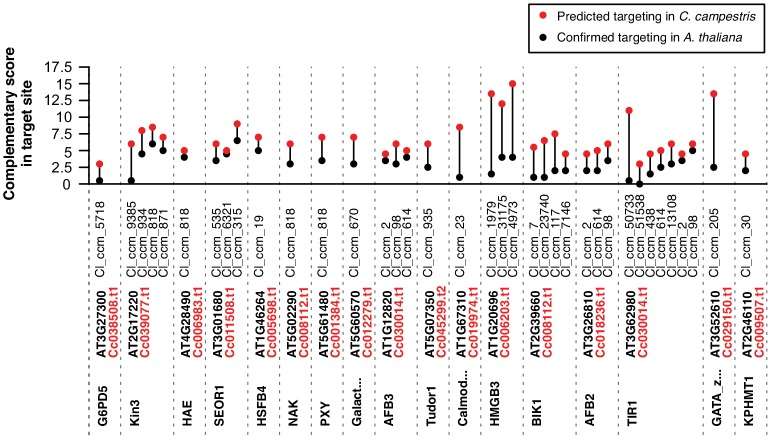
Trans-species small regulatory RNAs (sRNAs) are delivered to host plants from diverse pathogens and parasites and can target host mRNAs. How trans-species sRNAs can be effective on diverse hosts has been unclear. Multiple species of the parasitic plant Cuscuta produce trans-species sRNAs that collectively target many host mRNAs. Confirmed target sites are nearly always in highly conserved, protein-coding regions of host mRNAs. Cuscuta trans-species sRNAs can be grouped into superfamilies that have variation in a three-nucleotide period. These variants compensate for synonymous-site variation in host mRNAs. By targeting host mRNAs at highly conserved protein-coding sites, and simultaneously expressing multiple variants to cover synonymous-site variation, Cuscuta trans-species sRNAs may be able to successfully target multiple homologous mRNAs from diverse hosts.

Keywords: A. thaliana; Cuscuta; microRNA; plant biology; siRNA.


Conflict of interest statement

NJ, Cd, MA No competing interests declared

Figures

Figure 1.
Figure 1.. Haustorium-induced small RNAs (HI-sRNAs) are present in multiple Cuscuta species.
(A) Phylogeny of select Cuscuta species. Size distribution of HI-sRNAs for each sequenced isolate and acronyms are shown. (B) Sampling and sequencing schematic to discern HI-sRNAs. (C) HI-sRNA family counts and membership for each isolate, showing only the top 15 groups. Families were grouped strictly using a maximum edit distance of one nucleotide. Yellow indicates families present in a single isolate.
Figure 1—figure supplement 1.
Figure 1—figure supplement 1.. Host preference in Cuscuta species in the United States.
(A) Pipeline for processing herbaria data from the mid-atlantic herbaria consortium (MAHC; http://midatlanticherbaria.org) on interactions with each Cuscuta species of interest. (B) Ranked list of most identified host families for each species. Top 15 are shown for each species, with the top 10 overall identified with consistent colors (all others in black). (C) Geographical listings within the United States for each sample, where latitude and longitude or a searchable county are found.
Figure 1—figure supplement 2.
Figure 1—figure supplement 2.. Genome-free HI-sRNA discovery pipeline.
(A) Discovery of HI-sRNAs in Cuscuta isolates. Three major steps include condensing reads to representative sRNAs in a genome-free manner, filtering reads which could have originated from A. thaliana, and performing differential expression with DEseq2 to find reads up-regulated in the interface tissue (FDR < 0.1, null hypothesis: sRNA not differentially expressed). (B) Example of a C. campestris sRNA discovered by this method, with the top 25 constituent sRNA sequences ranked by expression. Highest expressed read is deemed as the representative sRNA sequence and is shown with black box. Green boxes show variations from representative sequences with total distance shown to left. (C) Same as B but with a known miRNA, showing similar variation to the novel sRNA in B. (D) Comparing the proportion of reads present in annotated miRNAs, using both genome-alignment (ShortStack) and genome-free based approaches. Reads are ranked by size, with the canonical miRNA (blue) and the variants (grey) showing the proportion of reads they make up in the sRNA. Reads grouped in the locus by the genome-free method that are absent in the alignment approach are shown in green.
Figure 2.
Figure 2.. Host targets of Cuscuta HI-sRNAs.
(A) Modeled sRNA-target interaction for A. thaliana CRCK2. (B) Secondary siRNA accumulation from CRCK2. (C) Phasing analysis of secondary siRNAs from CRCK2. Expected phase for cut-site shown in red. (D) Size distribution of CRCK2 secondary siRNAs. (E) Frequency of 5’ ends from the CRCK2 mRNA, with the predicted HI-sRNA cut site shown in red. (F) Host mRNAs with confirmed targeting by a Cuscuta HI-sRNA. Full details in Figure 2—figure supplement 1 and Supplementary file 6.
Figure 2—figure supplement 1.
Figure 2—figure supplement 1.. Summary of Cuscuta HI-sRNA and host gene target relationships.
(A) Complete list of target interactions between sRNAs and host genes. Confirmation status diagram indicates in what species the interaction is confirmed. Target gene information includes the number of homologs found in 36 eudicot transcriptomes. sRNA counts in superfamilies and the presence of a confirmed miRNA in the family is shown (NoAl: ccm sRNA failed to align to ccm genome). Target interaction columns indicate the conservation at the translated target site in an alignment of found homologs (5’/3’ UTR: not considered for conservation analysis). Correlation coefficient and P-value for variation in positions in target and sRNA superfamily shown. (B) Breakdown of superfamilies with confirmed targeting by the presence of a confirmed miRNA, where possible. (C) Correlation of positional variation in target-sites and their sRNAs, indicating the interactions with a significant correlation.
Figure 2—figure supplement 2.
Figure 2—figure supplement 2.. Most common GO terms for confirmed target genes.
(A) GO terms for molecular function with a nodescore ≥5.0, demonstrating the species for which the interaction is confirmed with colored bars. Locations where bars overlap indicate genes where both species have confirmed targeting. (B) Same as with A, but for biological processes.
Figure 3.
Figure 3.. Analysis of mRNA accumulation in host-parasite interfaces.
Cumulative density plots of interface/control stem ratios for host mRNAs expressed in Cuscuta-host interfaces, assessed by RNA-seq. All mRNAs shown with black line. Colored lines and dots indicate mRNAs which are confirmed targets of HI-sRNAs in the indicated Cuscuta isolates.
Figure 4.
Figure 4.. Predicted trans-species and self-targeting in C. campestris homologs of target A. thaliana mRNAs.
Target prediction scores for confirmed A. thaliana mRNA targets (black) and best-blast-hit homologs in C. campestris (red). All sRNAs with predicted targeting are shown.
Figure 4—figure supplement 1.
Figure 4—figure supplement 1.. Experimental flowchart for confirming self-targeting of C.campestris mRNAs by HI-sRNAs.
(A) Pipeline for confirmation by the presence of secondary siRNAs. (B) Pipeline for confirmation by the 5’ transcript sequencing (NanoPARE). (C) List of all mRNAs with strong evidence for self-targeting.
Figure 5.
Figure 5.. Cuscuta HI-sRNAs form superfamilies that co-vary with target sites across eudicots.
(A) sRNA superfamily count and membership for each Cuscuta isolate. Colors indicate general groupings of superfamilies. (B) An example HI-sRNA superfamily aligned to target sites from homologs in 36 eudicot genomes. Nucleotide and amino acid Shannon entropy from the alignments are shown as bits. Vertical red lines indicate the frame. Dots indicate the number of possible synonymous nucleotides at each codon. 17 additional examples in supplementary file 7. (C) Average conservation of target sites from homologs. Confirmed target site shown (red point), with all other possible sites shown by 25–75% quartiles (black line) and median (black point).
Figure 5—figure supplement 1.
Figure 5—figure supplement 1.. Clustering method for forming HI-sRNA superfamilies.
(A) Example demonstrating implementation of the ‘modified hamming distance’ (mHD) when comparing strings. Levenshtein edit distance is tolerant of insertions and deletions, yet the mHD does not allow these operations, making a high penalty to strings which contain insertional errors while shift errors are penalized the same. (B) Example of clustering seven HI-sRNAs into three superfamilies using mHD. Species are indicated by color; clustering is independent of species. Edges close enough to form a cluster (solid line, red distance number) and inadequate edges (dashed line, black distance number) connect HI-sRNA nodes. Cutoff for clustering is an mHD distance of five or less and it is not required that all nodes in a cluster must meet this threshold (must have one adequate edge to join a cluster).
Figure 5—figure supplement 2.
Figure 5—figure supplement 2.. Testing distance cutoff parameters for superfamily formation.
(A) Experimental pipeline for testing cutoff. sRNA libraries are shuffled using UShuffle maintaining dinucleotide composition. (B) Number of superfamilies formed for real HI-sRNAs and shuffled libraries by maximum distance allowed for cluster formation. Smaller count of superfamilies means that more HI-sRNAs are successfully clustering with each other. (C) The same analysis as in B, except demonstrating the cumulative density of superfamilies by the number of sRNAs grouped in them. Larger cutoffs yield larger superfamilies, with shuffled libraries remaining unable to form clusters larger than one or two.
Figure 6.
Figure 6.. Superfamilies compensate for variation in N.benthamiana target homologs.
(A) Accumulation of N. benthamiana target mRNAs. Interface (IN, red) and control stem (CS, black) are shown relative to average CS expression. Points represent biological replicates (N = 5 to 6). P values comparing IN to CS are displayed above the x axis; Wilcoxon rank-sum tests, unpaired, one-tailed. Accumulation was normalized to NbTIP41-L (Niben101Scf03385g06003) and NbPP2A (Niben101Scf09716g01002). (B) sRNA-target alignments of SupFam_27 sRNAs with TIR1 family members from N. benthamiana and A. thaliana. Complementarity scores (Allen et al., 2005) are shown in the heatplot. The strongest predicted interactions are shown on the right; highlighted nucleotides are synonymous variants relative to AtTIR1.

References

    1. Addo-Quaye C, Eshoo TW, Bartel DP, Axtell MJ. Endogenous siRNA and miRNA targets identified by sequencing of the Arabidopsis degradome. Current Biology. 2008;18:758–762. doi: 10.1016/j.cub.2008.04.042. - DOI - PMC - PubMed
    1. Allen E, Xie Z, Gustafson AM, Carrington JC. microRNA-directed phasing during trans-acting siRNA biogenesis in plants. Cell. 2005;121:207–221. doi: 10.1016/j.cell.2005.04.004. - DOI - PubMed
    1. Arabidopsis Genome Initiative Analysis of the genome sequence of the flowering plant Arabidopsis thaliana. Nature. 2000;408:796–815. doi: 10.1038/35048692. - DOI - PubMed
    1. Asai T, Tena G, Plotnikova J, Willmann MR, Chiu WL, Gomez-Gomez L, Boller T, Ausubel FM, Sheen J. MAP kinase signalling cascade in Arabidopsis innate immunity. Nature. 2002;415:977–983. doi: 10.1038/415977a. - DOI - PubMed
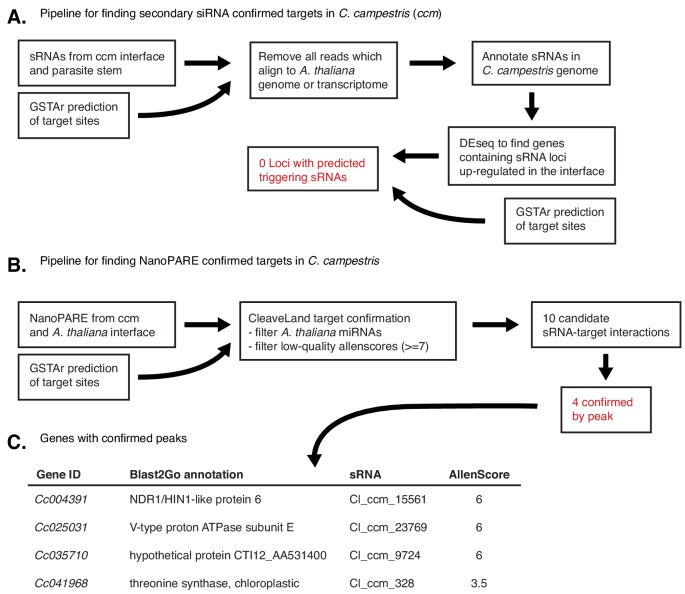
    1. Axtell M. GitHub; 2014. https://github.com/MikeAxtell/GSTAr

Publication types

MeSH terms