. 2020 Mar 2;130(3):1315-1329.
doi: 10.1172/JCI130272.

Graft-versus-host disease of the CNS is mediated by TNF upregulation in microglia

Affiliations

Graft-versus-host disease of the CNS is mediated by TNF upregulation in microglia

Nimitha R Mathew et al. J Clin Invest. .

Abstract

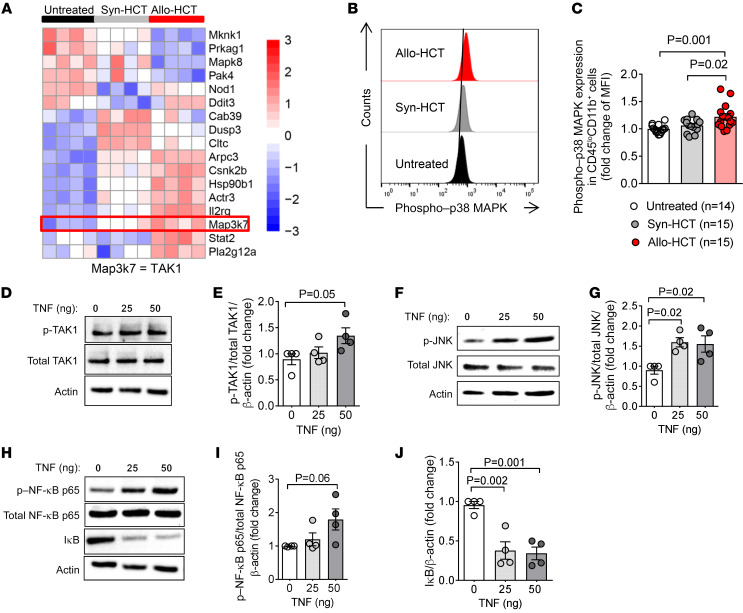
Acute graft-versus-host disease (GVHD) can affect the central nervous system (CNS). The role of microglia in CNS-GVHD remains undefined. In agreement with microglia activation, we found that profound morphological changes and MHC-II and CD80 upregulation occurred upon GVHD induction. RNA sequencing-based analysis of purified microglia obtained from mice with CNS-GVHD revealed TNF upregulation. Selective TNF gene deletion in microglia of Cx3cr1creER Tnffl/- mice reduced MHC-II expression and decreased CNS T cell infiltrates and VCAM-1+ endothelial cells. GVHD increased microglia TGF-β-activated kinase-1 (TAK1) activation and NF-κB/p38 MAPK signaling. Selective Tak1 deletion in microglia using Cx3cr1creER Tak1fl/fl mice resulted in reduced TNF production and microglial MHC-II and improved neurocognitive activity. Pharmacological TAK1 inhibition reduced TNF production and MHC-II expression by microglia, Th1 and Th17 T cell infiltrates, and VCAM-1+ endothelial cells and improved neurocognitive activity, without blocking graft-versus-leukemia effects. Consistent with these findings in mice, we observed increased activation and TNF production of microglia in the CNS of GVHD patients. In summary, we prove a role for microglia in CNS-GVHD, identify the TAK1/TNF/MHC-II axis as a mediator of CNS-GVHD, and provide a TAK1 inhibitor-based approach against GVHD-induced neurotoxicity.

Keywords: Stem cell transplantation; Transplantation.


Conflict of interest statement

Conflict of interest: The authors have declared that no conflict of interest exists.

Figures

Figure 1
Figure 1. Microglia display activated morphology and T cells infiltrate the CNS during GVHD.
(AD) Histology of brain samples immunostained for CD3+ T cells (brown) from untreated BALB/c mice (n = 10) or BALB/c mice on day 14 after syn-HCT (n = 9) or after allo-HCT (n = 11) as indicated. (A and C) A representative image from each group is shown. Scale bars: 50 μm. (B and D) The scatter plots show the number of CD3+ T cells (per mm2) in cerebral meninges and cortex. The experiment was repeated 2 times, and the results (mean ± SEM) were pooled. P values were calculated using 1-way ANOVA. (E and F) Flow cytometry for CD45hi cells among CD11b+ cells in the CNS of untreated BALB/c mice (n = 10) or BALB/c mice on day 14 after syn-HCT (n = 10) or after allo-HCT (n = 11) as indicated. (E) A representative flow cytometry plot from each group is shown. (F) The scatter plot shows the quantification of CD45hi cells among CD11b+ cells from different groups as indicated. The experiment was repeated 3 times, and results (mean ± SEM) were pooled. P values were calculated using 1-way ANOVA. (G) Representative images showing Imaris-based (Bitplane) 3D reconstruction of Iba-1+ microglia cells from untreated BALB/c mice or BALB/c mice on day 14 after syn-HCT or allo-HCT as indicated. Scale bar: 10 μm. (HK) Scatter plots showing Imaris-based automated quantification of microglial morphology from microglia cells of untreated BALB/c mice (n = 6) or BALB/c mice on day 14 after syn-HCT (n = 6) or allo-HCT (n = 6) as indicated. The experiment was repeated 2 times, and results (mean ± SEM) were pooled. P values were calculated using 1-way ANOVA.
Figure 2
Figure 2. Microglial numbers and costimulatory molecules are increased during GVHD.
(A) Histology of brain samples immunostained for Iba-1+ cells from untreated BALB/c mice or BALB/c mice on day 14 after syn-HCT or allo-HCT as indicated. Scale bars: 100 μm. (B) The scatter plot shows the number of Iba-1+ cells (per mm2) in cerebral cortex from untreated BALB/c mice (n = 10) or BALB/c mice on day 14 after syn-HCT (n = 9) or allo -HCT (n = 11) as indicated. The experiment was repeated 2 times, and the results (mean ± SEM) were pooled. P values were calculated using 1-way ANOVA. (C) Principal component (PC) analysis of RNA-Seq analysis of sorted microglia cells isolated from the CNS of untreated BALB/c mice (n = 4) or BALB/c mice on day 14 after syn-HCT (n = 4) or allo-HCT (n = 4). (D) Heatmap based on RNA-Seq showing the top 20 genes involved in antigen processing and presentation from microglia of untreated BALB/c mice (n = 4) or BALB/c mice on day 14 after syn-HCT (n = 4) or allo-HCT (n = 4). Color code represents the Z score log2 intensity. (E and F) Scatter plot and respective flow cytometry plot showing quantification (fold change of MFI) of MHC-II expression on microglia (CD45loCD11b+) from brains of untreated BALB/c mice (n = 10) or BALB/c mice on day 14 after syn-HCT (n = 10) or allo-HCT (n = 11) as indicated. (GJ) Scatter plot and respective flow cytometry plot showing quantification (fold change of MFI) of CD80 (G and H) and CX3CR1 (I and J) expression on microglia (CD45loCD11b+) from brains of untreated BALB/c mice (n = 10) or BALB/c mice on day 14 after syn-HCT (n = 17) or allo-HCT (n = 18) as indicated. The experiment was repeated 3 times, and results (mean ± SEM) were pooled. P values were calculated using 1-way ANOVA.
Figure 3
Figure 3. Microglia-derived TNF is essential for the infiltration of T cells into the brain.
(A) Heatmap based on RNA-Seq showing the top 20 differentially regulated cytokines from microglia of untreated BALB/c mice (n = 4) or BALB/c mice on day 14 after syn-HCT (n = 4) or allo-HCT (n = 4). The color code represents the Z score log2 intensity. (B) A representative flow cytometry plot showing intracellular TNF expression in microglia (CD45loCD11b+) from brains of untreated BALB/c mice or BALB/c mice on day 14 after allo-HCT or syn-HCT. (C) The scatter plot shows the quantification (fold change of MFI) of intracellular TNF expression in microglia from the CNS of untreated BALB/c mice (n = 13) or BALB/c mice on day 14 after syn-HCT (n = 18) or allo-HCT (n = 18) as indicated. The experiment was repeated 3 times, and the results (mean ± SEM) were pooled. P values were calculated using 1-way ANOVA. (DF) Histology of brain samples for CD3+ T cells from Tnffl/– (n = 9) and Cx3cr1creER Tnffl/– (n = 10) mice on day 14 after allo-HCT as indicated. (D) Representative images showing meningeal CD3+ T cells in each group. Scale bars: 50 μm. (E and F) The scatter plots show the number of CD3+ T cells (per mm2) in cerebral meninges (E) and cortex (F) of Tnffl/– (n = 9) and Cx3cr1creER Tnffl/– (n = 10) mice. The experiment was performed once. P values were calculated using 2-sided Student’s unpaired t test (E) and 2-sided Mann-Whitney U test (F). (G) Volcano plot based on RNA-Seq showing the top differentially regulated genes in Tnffl/– (n = 9) and Cx3cr1creER Tnffl/– (n = 10) mice on day 14 after allo-HCT as indicated. Cd74, Tnf, and H2-Eb are upregulated in microglia of the Tnffl/– mice compared with the Cx3cr1creER Tnffl/– mice.
Figure 4
Figure 4. Downstream targets of TAK1 signaling are elevated in microglia during GVHD.
(A) Heatmap based on RNA-Seq showing the top hits of PI3K/Akt/mTOR signaling pathway from the microglia of untreated BALB/c mice (n = 4) or BALB/c mice on day 14 after allo-HCT (n = 4) or syn-HCT (n = 4). Color code represents the Z score log2 intensity. (B) A representative flow cytometry plot showing intracellular phospho–p38 MAPK in microglia (CD45loCD11b+) from brains of untreated BALB/c mice or BALB/c mice on day 7 after syn-HCT or allo-HCT. (C) The scatter plot shows the quantification (fold change of MFI) of intracellular phospho–p38 MAPK expression in microglia from brains of untreated BALB/c mice (n = 14) or BALB/c mice on day 7 after syn-HCT (n = 15) or allo-HCT (n = 15) as indicated. The experiment was repeated 3 times, and the results (mean ± SEM) were pooled. The P values were calculated using 1-way ANOVA. (DJ) Western blot using protein derived from primary murine microglia treated with different concentrations of murine TNF for 24 hours as indicated. (D, F, and H) Representative Western blot images showing the expression of phospho-TAK1 and total TAK1 (D), phospho-JNK and total JNK (F), and phospho–NF-κB p65, total NF-κB p65, and IκB (H) with β-actin as loading control. (E, G, I, and J) Quantification of phospho-TAK1/total TAK1 (E), phospho-JNK/total JNK (G), phospho–NF-κB p65/total NF-κB p65 (I), and IκB (J) normalized to β-actin (fold change with respect to controls treated with vehicle [0 μM TNF]) in microglia treated as described. The experiment was repeated 4 times, and the results (mean ± SEM) were pooled with n = 4 biologically independent samples per group. Each data point represents an individual sample of 1 independent cell culture experiment. P values were calculated using 1-way ANOVA.
Figure 5
Figure 5. Deficiency of TAK1 in microglia alleviates CNS-GVHD–associated pathology and cognitive and memory deficits.
(AF) Histology of brain samples immunostained for meningeal (A) and cortical (C) CD3+ T cells and cortical Iba-1+ cells (E) from Tak1fl/fl or Cx3cr1creER Tak1fl/fl (n = 10 each) mice on day 14 after allo-HCT. Scale bars: 50 μm. (B, D, and F) The scatter plots show the number of meningeal (B) and cortical (D) CD3+ T cells and cortical Iba-1+ cells (F). The experiment was repeated 3 times. The results (mean ± SEM) were pooled. (GJ) Representative flow cytometry (G and I) and scatter (H and J) plots showing TNF and MHC-II expression in microglia (CD45loCD11b+) from brains of Tak1fl/fl and Cx3cr1creER Tak1fl/fl mice. Quantification of MHC-II expression from Tak1fl/fl (n = 10) and Cx3cr1creER Tak1fl/fl (n = 10) (H) and TNF expression from Tak1fl/fl (n = 11) and Cx3cr1creER Tak1fl/fl (n = 10) (J) on day 14 after allo-HCT is shown. The experiment was repeated 3 times. The results (mean ± SEM) were pooled. (K) Percentage survival of Tak1fl/fl (n = 9) and Cx3cr1creER Tak1fl/fl (n = 10) mice that underwent allo-HCT. The experiment was performed 3 times. The results were pooled. (L) The scatter plot shows the percentage of open-arm entries by Tak1fl/fl and Cx3cr1creER Tak1fl/fl (n = 17 each) mice on day 21 after allo-HCT in an elevated plus maze test. (M) The scatter plot shows the percentage of time spent by Tak1fl/fl (n = 18) and Cx3cr1creER Tak1fl/fl (n = 19) mice in exploring a novel object with respect to the total time on day 19 after allo-HCT in a novel object recognition test. (N) The scatter plot shows grip strength normalized to body weight (N) of Tak1fl/fl and Cx3cr1creER Tak1fl/fl (n = 19 each) mice on day 20 after allo-HCT in a grip strength test. The experiments were repeated 3 times. The results (mean ± SEM) were pooled. P values were calculated using Mann-Whitney U test (B, D, and L), 2-sided Mantel-Cox test (K), or 2-sided Student’s unpaired t test (F, H, J, M, and N).
Figure 6
Figure 6. Therapeutic TAK1 inhibition alleviates CNS-GVHD–associated pathology and cognitive and memory deficits.
(AD) Flow cytometry plots and the respective scatter plots showing quantification (fold change of MFI) of MHC-II (A and B) and TNF (C and D) expression in microglia (CD45loCD11b+) from brains of BALB/c mice treated with vehicle, takinib, or (5Z)-7-oxozeaenol (5-Oz) on day 14 after allo-HCT as indicated. The experiment was repeated 3 times, and the results (mean ± SEM) were pooled. P values were calculated using 1-way ANOVA. (EH) Histology of brain samples immunostained for CD3+ T cells and Iba-1+ cells from brains of BALB/c mice treated with vehicle (n = 10), takinib (n = 14), or 5-Oz (n = 12) on day 14 after allo-HCT as indicated. Representative images for meningeal CD3+ T cells (E) and cortical Iba-1+ cells (G) from each group are shown. Scale bars: 50 μm. The scatter plots show the number (per mm2) of meningeal CD3+ T cells (F), cortical Iba-1+ cells (H), and cortical CD3+ T cells (I). The experiment was repeated 3 times, and the results (mean ± SEM) were pooled. The P values were calculated using 1-way ANOVA. (J and K) Representative flow cytometry plots (J) and cumulative scatter plot (K) show quantification (fold change of MFI) of IFN-γ expression in CD4+ T cells isolated on day 14 after allo-HCT from the CNS of BALB/c mice treated with vehicle (n = 5) or takinib (n = 5). (L and M) Representative flow cytometry plots (L) and cumulative scatter plot (M) show quantification (fold change of MFI) of IL-17 expression in CD4+ T cells isolated on day 14 after allo-HCT from the CNS of BALB/c mice treated with vehicle (n = 8) or takinib (n = 8). (K and M) The experiments were performed 3 times, and the results (mean ± SEM) were pooled. P values were calculated using 2-sided Student’s unpaired t test (K and M).
Figure 7
Figure 7. VCAM-1 and ICAM-1 expression after allo-HCT declines upon TAK1 inhibition.
(AD) Representative flow cytometry plots and the respective cumulative scatter plots showing quantification of the fold change of MFI of VCAM-1 (A and B) and ICAM-1 (C and D) expression in endothelial cells (CD31+CD105+) from the CNS of BALB/c mice treated with vehicle (n = 6) or takinib (n = 7) isolated on day 14 after allo-HCT. The experiment was performed once. (EG) Immunofluorescence staining and scatter plots indicating the percentage of brain CD34+ endothelial cells expressing VCAM-1 and DAPI derived from BALB/c mice treated with vehicle (n = 7) or takinib (n = 7) (E) and from Tnffl/– (n = 7) or Cx3cr1creER Tnffl/– (n = 6) mice (F) on day 14 after allo-HCT. (G) Representative images from Tnffl/– and Cx3cr1creER Tnffl/– mice, respectively, are shown. Scale bars: 50 μm. The experiment was performed once. (H) Scatter plot showing the percentage of open-arm entries by mice treated with vehicle (n = 11), takinib (n = 12), or 5-Oz (n = 12) in an elevated plus maze test. (I) Scatter plot showing the percentage of time spent by mice treated with vehicle (n = 13), takinib (n = 12), or 5-Oz (n = 12) in exploring a novel object in a novel object recognition test. The experiments were performed 3 times, and the results (mean ± SEM) were pooled. (J) Survival rates of C57BL/6 mice with transplanted AML (FLT3-ITD/MLL-PTD) cells and BALB/c (WT) bone marrow (BM) along with (white and blue circles) and without (black circles) allogeneic T cells. (K) Survival rates of BALB/c mice with transplanted AML (WEHI-3B) cells and C57BL/6 BM (WT) along with (white and blue circles) and without (black circles) allogeneic T cells. The experiments were performed twice, and the results were pooled. P values were calculated using 2-sided Student’s unpaired t test (B, D, and F), Mann-Whitney U test (E), 1-way ANOVA (H and I), or 2-sided Mantel-Cox test (J and K).
Figure 8
Figure 8. Microglia are activated and T cells infiltrate the CNS of GVHD patients.
(AD) Histology of brain samples immunostained for Iba-1+ cells from the cortex of patients who had not undergone allo-HCT (No allo-HCT) (n = 9), had undergone allo-HCT with no GVHD symptoms (Allo-HCT/no GVHD) (n = 8), or had undergone allo-HCT with grade III–IV GVHD symptoms (Allo-HCT/GVHD) (n = 9). (A and C) A representative image from each group is shown. Scale bars: 50 μm. (B and D) The scatter plots show the number of Iba-1+ cells (per mm2) in gray matter (B) and white matter (D). The experiment was performed once. The P values were calculated using 1-way ANOVA. (E and F) Immunofluorescence staining of brain samples for Iba-1+ microglia, TNF, and DAPI from no allo-HCT (n = 8), allo-HCT/no GVHD (n = 9), and allo-HCT/GVHD (n = 9) groups of patients. (E) A representative image from no allo-HCT and allo-HCT/GVHD groups is shown. Scale bars: 50 μm. (F) Scatter plot indicating the percentage of Iba-1+ microglia expressing TNF from different groups. The experiment was repeated once. P values were calculated using 1-way ANOVA. (G and H) Histology of brain samples immunostained for CD3+ T cells from the perivascular regions of brain from no allo-HCT (n = 9), allo-HCT/no GVHD (n = 8), and allo-HCT/GVHD (n = 10) groups of patients. (G) Representative images from each group are shown. Scale bars: 50 μm. (H) The scatter plot shows the number of CD3+ T cells (per mm2) in perivascular regions of brain. P values were calculated using 1-way ANOVA.

References

    1. Zeiser R, Blazar BR. Acute graft-versus-host disease — biologic process, prevention, and therapy. N Engl J Med. 2017;377(22):2167–2179. doi: 10.1056/NEJMra1609337. - DOI - PMC - PubMed
    1. Hartrampf S, et al. The central nervous system is a target of acute graft versus host disease in mice. Blood. 2013;121(10):1906–1910. doi: 10.1182/blood-2012-09-456590. - DOI - PMC - PubMed
    1. Kaliyaperumal S, et al. CD8-predominant T-cell CNS infiltration accompanies GVHD in primates and is improved with immunoprophylaxis. Blood. 2014;123(12):1967–1969. doi: 10.1182/blood-2014-01-547612. - DOI - PMC - PubMed
    1. Unger ER, Sung JH, Manivel JC, Chenggis ML, Blazar BR, Krivit W. Male donor-derived cells in the brains of female sex-mismatched bone marrow transplant recipients: a Y-chromosome specific in situ hybridization study. J Neuropathol Exp Neurol. 1993;52(5):460–470. doi: 10.1097/00005072-199309000-00004. - DOI - PubMed
    1. Shortt J, Hutton E, Faragher M, Spencer A. Central nervous system graft-versus-host disease post allogeneic stem cell transplant. Br J Haematol. 2006;132(2):245–247. doi: 10.1111/j.1365-2141.2005.05864.x. - DOI - PubMed

Publication types

MeSH terms

Substances