. 2019 Dec 17;14(12):e0226652.
doi: 10.1371/journal.pone.0226652. eCollection 2019.

High-glucose diets induce mitochondrial dysfunction in Caenorhabditis elegans

Affiliations

High-glucose diets induce mitochondrial dysfunction in Caenorhabditis elegans

Jonathan Alcántar-Fernández et al. PLoS One. .

Abstract

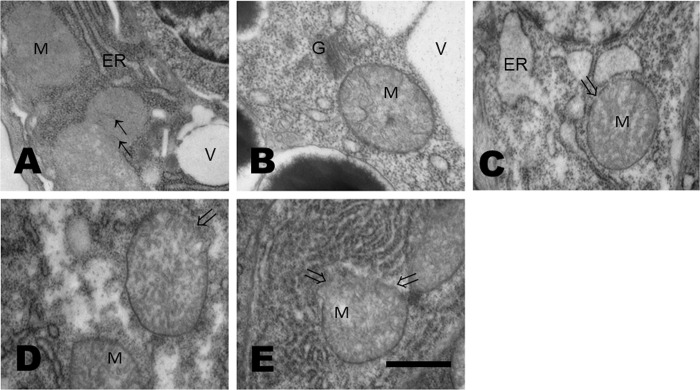
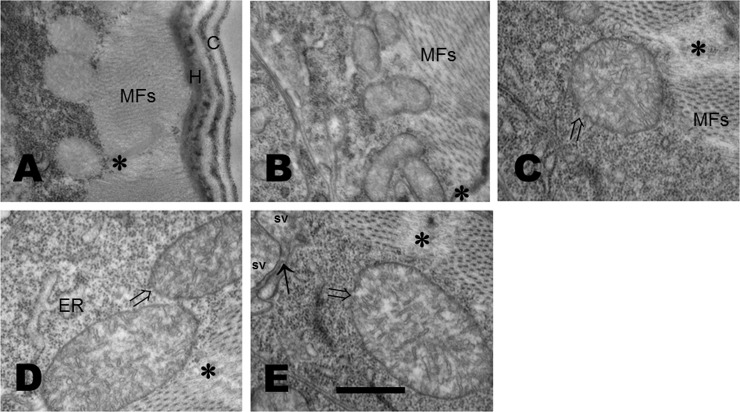
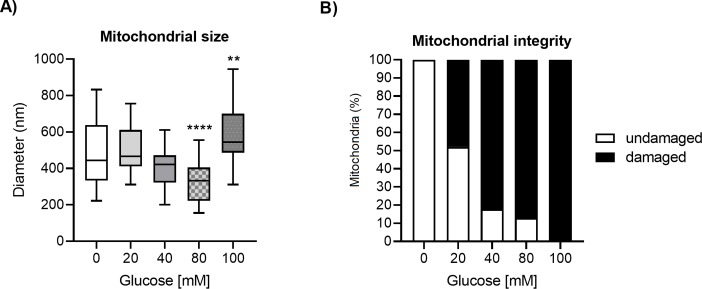
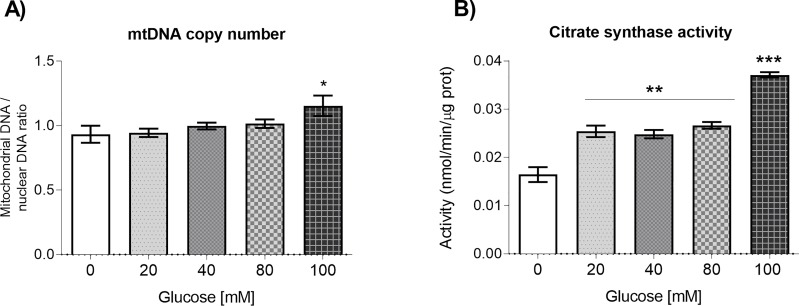
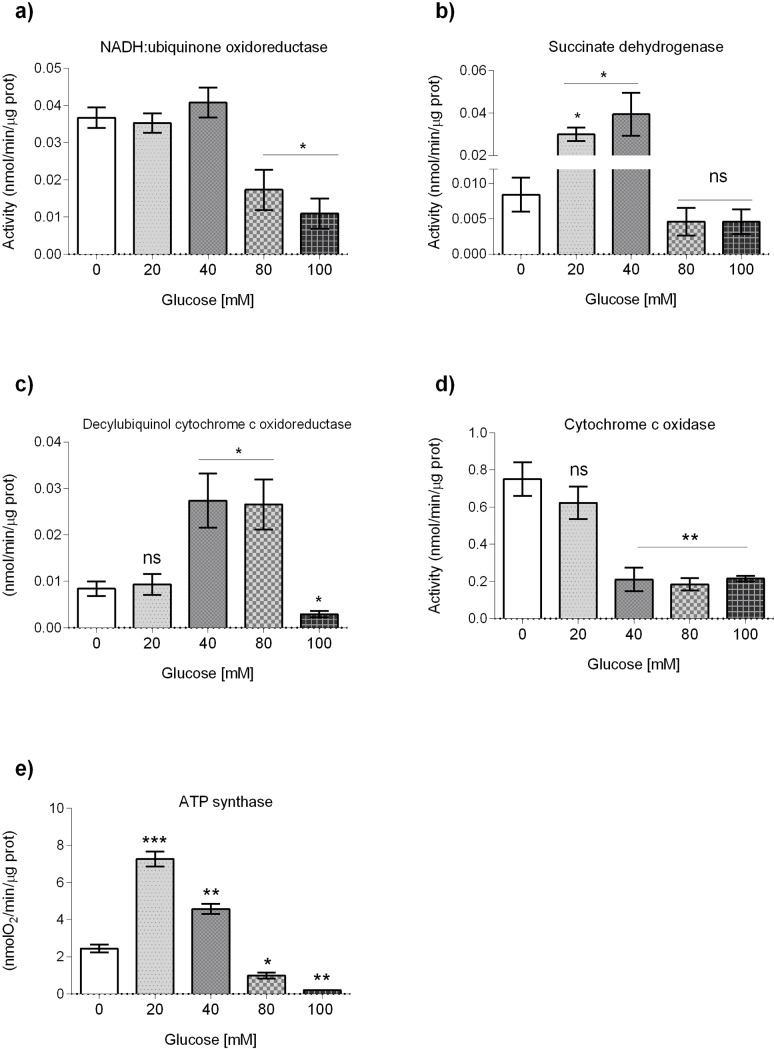
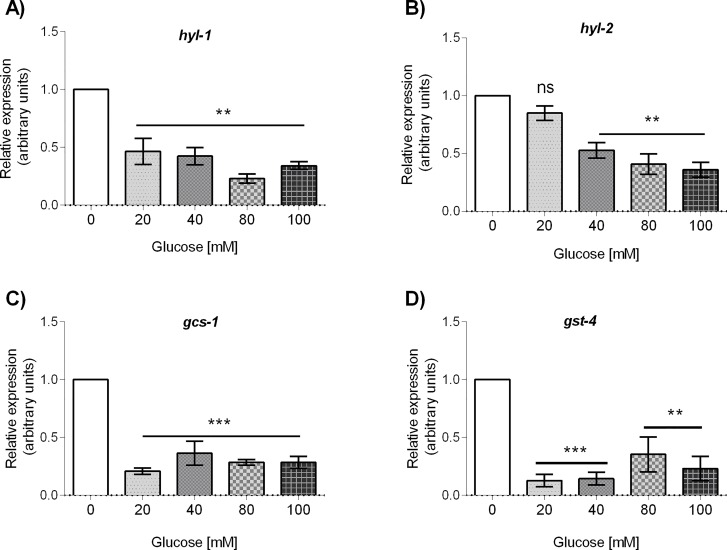
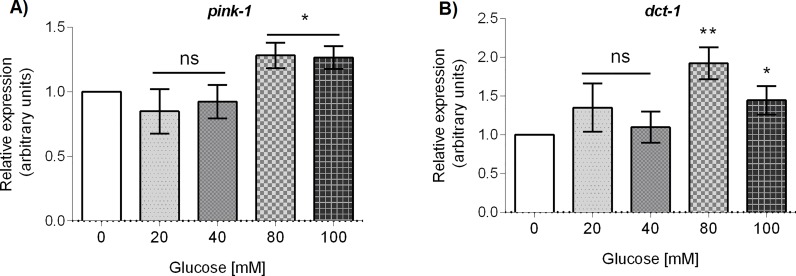
Glucose is an important nutrient that dictates the development, fertility and lifespan of all organisms. In humans, a deficit in its homeostatic control might lead to hyperglucemia and the development of obesity and type 2 diabetes, which show a decreased ability to respond to and metabolize glucose. Previously, we have reported that high-glucose diets (HGD) induce alterations in triglyceride content, body size, progeny, and the mRNA accumulation of key regulators of carbohydrate and lipid metabolism, and longevity in Caenorhabditis elegans (PLoS ONE 13(7): e0199888). Herein, we show that increasing amounts of glucose in the diet induce the swelling of both mitochondria in germ and muscle cells. Additionally, HGD alter the enzymatic activities of the different respiratory complexes in an intricate pattern. Finally, we observed a downregulation of ceramide synthases (hyl-1 and hyl-2) and antioxidant genes (gcs-1 and gst-4), while mitophagy genes (pink-1 and dct-1) were upregulated, probably as part of a mitohormetic mechanism in response to glucose toxicity.


Conflict of interest statement

The authors have declared that no competing interests exist.

Figures

Fig 1
Fig 1. Glucose affects the morphology of mitochondria and endoplasmic reticulum of germ cells.
(A-E). Electron micrographs of germ cells of worms that were exposed from L1 to L4 larval stages to glucose 20, 40, 80 or 100 mM that show damaged mitochondria. (A) In control worms, mitochondrial cristae membranes are fine and dim (faint) (small arrows). (B) A widening of the endoplasmic reticulum cisternae was observed at glucose 20 mM, (C) larger at 40 mM and then (D) diminished at 80 mM. Mitochondrial external membrane showed extensive rupture, and a higher amount of endoplasmic reticulum was observed in worms grown at glucose 100 mM (E). G, Golgi cisternae; V: vacuoles. 50000X magnification; scale bar represents 500 nm.
Fig 2
Fig 2. Glucose affects the morphology of mitochondria and myofibrils of muscular cells.
(A-E). Electron micrographs of muscular cells of worms that were exposed from L1 to L4 larval stages to glucose 20, 40, 80 or 100 mM that show damaged mitochondria. (A) Mitochondria and myofibrils show a compact structure in control worms. (B) Worms treated with glucose 20 mM showed a swelling of the mitochondria, such swelling was bigger in worms exposed to 40, 80, or 100 mM; (B, C, D, and E, respectively). Mitochondrial external membrane showed zones of rupture (⇒), myofibrils are disorganized and the electrondensity of the Z-line (**) is highly diminished. C, cuticle; H, hypoderm; MFs, myofibrils; Z-line (**); sv, small vesicle; synapse (arrow). 50000X magnification; scale bar represents 500 nm.
Fig 3
Fig 3. Glucose affects mitochondrial diameter and integrity.
Worms were exposed from L1 to L4 larval stage to 20, 40, 80, or 100 mM glucose. (A) Boxplot illustrating mitochondrial diameter from glucose-treated worms. Measurements were made from electron microscopy images; n = 30–50 mitochondria from two biological replicates. Differences between groups were analyzed with a one-way ANOVA test. Significant differences to the control group are marked as follows: ns = not significant, *p<0.05, **p<0.01, ***p<0.001, ****p<0.0001. (B) Mitochondrial integrity in worms exposed to glucose. Measurements were done by visually inspecting mitochondria in electron microscopy images. Each mitochondria was examined and marked as damaged if swelling, cristae modification, or rupture of mitochondrial membranes was observed; n = 90–95 mitochondria from each treatment from two biological replicates.
Fig 4
Fig 4. Mitochondrial DNA copy number and Citrate Synthase enzymatic activity.
Synchronized worms were exposed to glucose 20, 40, 80, or 100 mM from L1 to L4 larval stage. Panels show (A) quantitative PCR analysis of mtDNA copy number (n = 6), or (B) Citrate Synthase (CS) enzymatic activity (n = 12). Values are expressed as mean ± SEM. Data was analyzed with the one-way ANOVA test. Significant differences with respect to the control group are marked as follows: *P < 0.05, **P < 0.01, ***P < 0.001.
Fig 5
Fig 5. Effects of glucose on mitochondrial function.
Effects of glucose on mitochondrial respiratory chain (MRC) enzymatic activities: (A) rotenone-sensitive NADH-decylubiquinol oxidoreductase (CI); (B) succinate dehydrogenase (CII); (C) antimycin A-sensitive decylubiquinol cytochrome c oxidoreductase (CIII); (D) cytochrome c oxidase (CIV), and (E) ATP synthase (CV). MRC enzymatic activities were determined spectrophotometrically with isolated mitochondria of worms that were exposed from L1 to L4 larval stages to glucose 20, 40, 80 or 100 mM. Data are presented from seven independent biological replicates and shown as median ± interquartile range (IQR) (*P < 0.05, **P < 0.01, ***P < 0.001; Kruskal-Wallis and Dunn tests for multiple comparisons).
Fig 6
Fig 6. Glucose did not affect adenine nucleotide pools.
Adenine nucleotide level quantification in glucose-treated worms (20, 40, 80 or 100 mM) or control using an HPLC-based assay: (A) AMP, (B) ADP, (C) ATP, used to calculate the (D) AMP/ATP quotient, (E) ADP/ATP quotient, and (F) energetic charge. Values were normalized to total weight of worms used. Data are presented from six independent biological replicates and shown as median ± interquartile range (IQR). No statistically significant differences were observed with respect to the control group. Data were analyzed by Kruskal-Wallis and Dunn tests for multiple comparisons.
Fig 7
Fig 7. Malate synthase enzymatic activities of worms exposed to glucose.
Enzymatic activities were determined in crude extracts from worms that were exposed from L1 to L4 larval stages to glucose 20, 40, 80 or 100 mM. Data is presented from 12 independent biological replicates. Error bars represent SEM (**P < 0.01, ***P < 0.001; one-way Anova and Bonferroni test to evaluate multiple comparisons).
Fig 8
Fig 8. mRNA abundance of ceramide synthase enzymes and glutathione metabolism-related proteins of worms grown at different concentrations of glucose.
Worms were exposed from L1 to L4 larval stage to 20, 40, 80 or 100 mM glucose. Panels show quantitative RT-PCR analysis of: (A) hyl-1, (B) hyl-2, (C) gcs-1, and (D) gst-4 mRNA level in wild-type worms grown at the specified glucose concentration. Relative expression was analyzed with the Kruskal-Wallis test. Values expressed as median ± IQR (n = 6). Significant differences with respect to control group are marked as follows: ns = not significant, *P<0.05, **P<0.01, ***P<0.001.
Fig 9
Fig 9. mRNA abundance of the mitophagy genes pink-1 and dct-1 of glucose-treated worms.
Worms were exposed from L1 to L4 larval stage to 20, 40, 80, or 100 mM glucose. Panels show quantitative RT-PCR analysis of (A) pink-1 and (B) dct-1 mRNA levels in worms grown at the specified glucose concentration. Relative expression was analyzed with the Kruskal-Wallis test. Values expressed as median ± IQR (n = 6). Significant differences to the control group are marked as follows: ns = not significant, *p<0.05, **p<0.01.

References

    1. Friedman F, Nunnari J. Mitochondrial form and function. Nature. 2014; 505:335–343. 10.1038/nature12985 - DOI - PMC - PubMed
    1. López-Otín C, Blasco MA, Partridge L, Serrano M, Kroemer G. The hallmarks of aging. Cell. 2013; 153:1194–1217. 10.1016/j.cell.2013.05.039 - DOI - PMC - PubMed
    1. Sebastián D, Palacín M, Zorzano A. Mitochondrial dynamics: coupling mitochondrial fitness with healthy aging. Trends Mol Med. 2017; 23: 201–215. 10.1016/j.molmed.2017.01.003 - DOI - PubMed
    1. Szendroedi J, Phielix E, Roden M. The role of mitochondria in insulin resistance and type 2 diabetes mellitus. Nat Rev Endocrinol. 2011; 8:92–103. 10.1038/nrendo.2011.138 - DOI - PubMed
    1. Labbé K, Murley A, Nunnari J. Determinants and functions of mitochondrial behavior. Annu Rev Cell Dev Biol. 2014; 30: 357–391. 10.1146/annurev-cellbio-101011-155756 - DOI - PubMed

Publication types