. 2019 Dec 16;51(6):698-712.e8.
doi: 10.1016/j.devcel.2019.11.014.

Self-Organization of Mouse Stem Cells into an Extended Potential Blastoid

Affiliations

Self-Organization of Mouse Stem Cells into an Extended Potential Blastoid

Berna Sozen et al. Dev Cell. .

Abstract

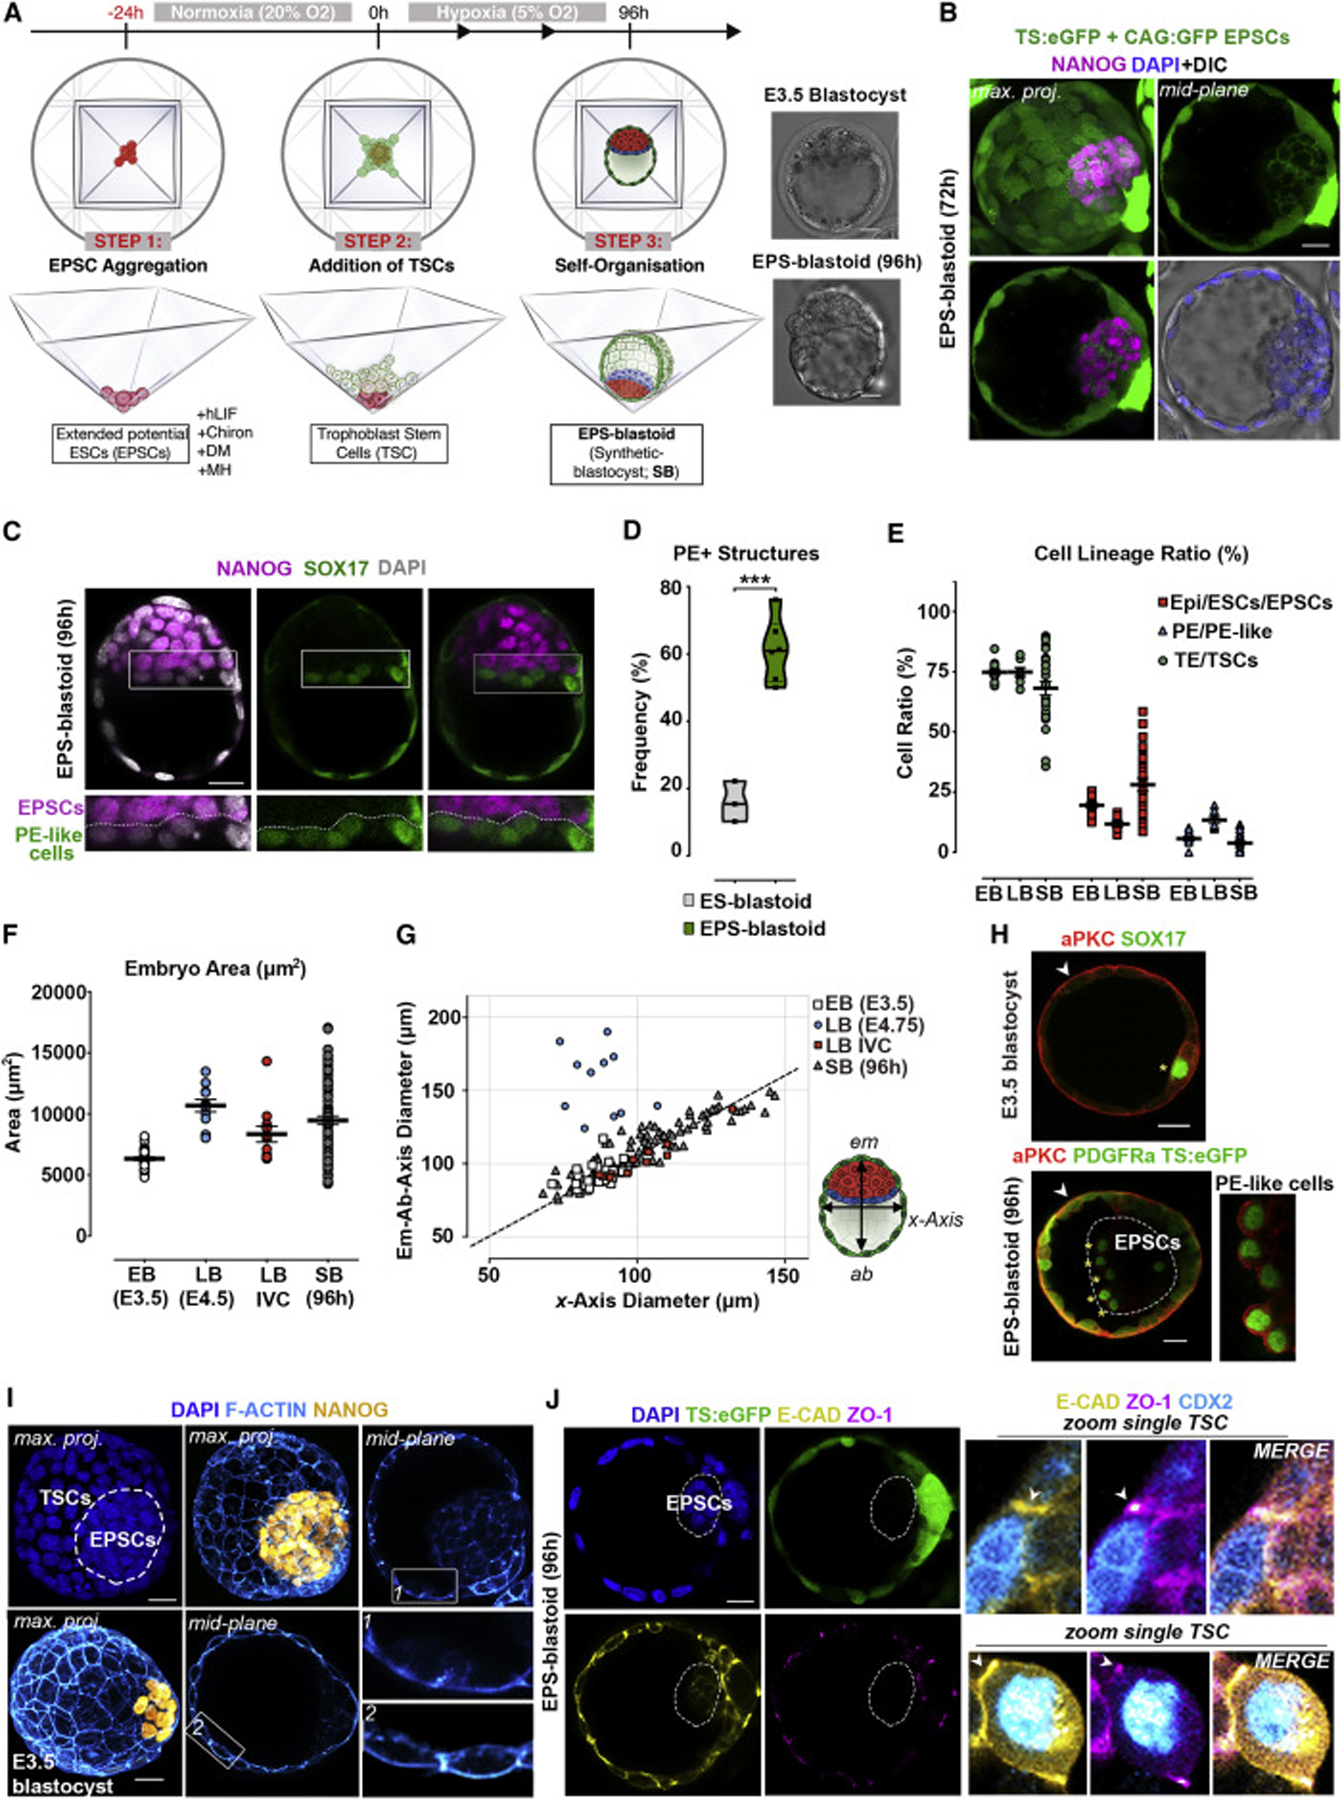
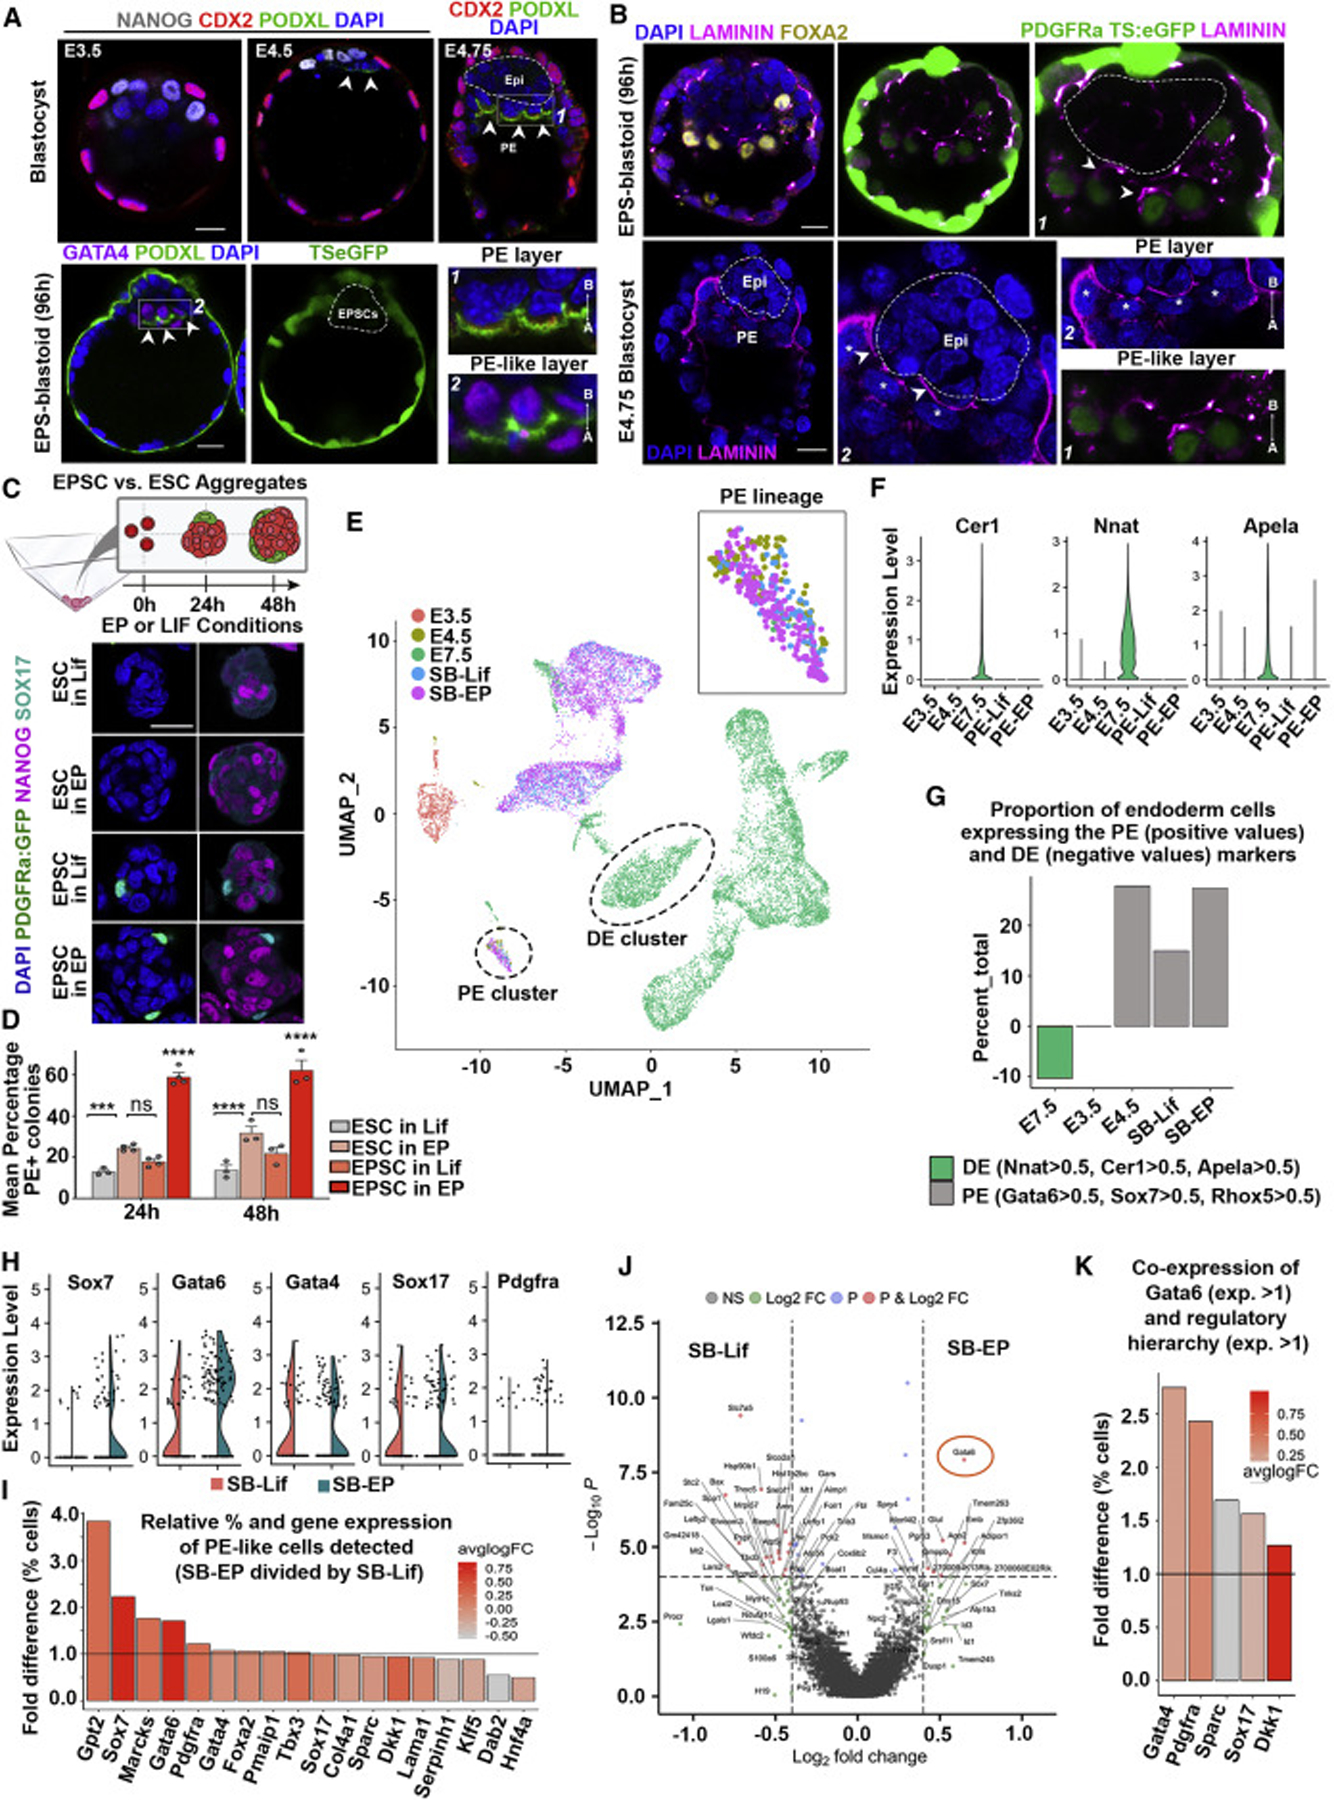
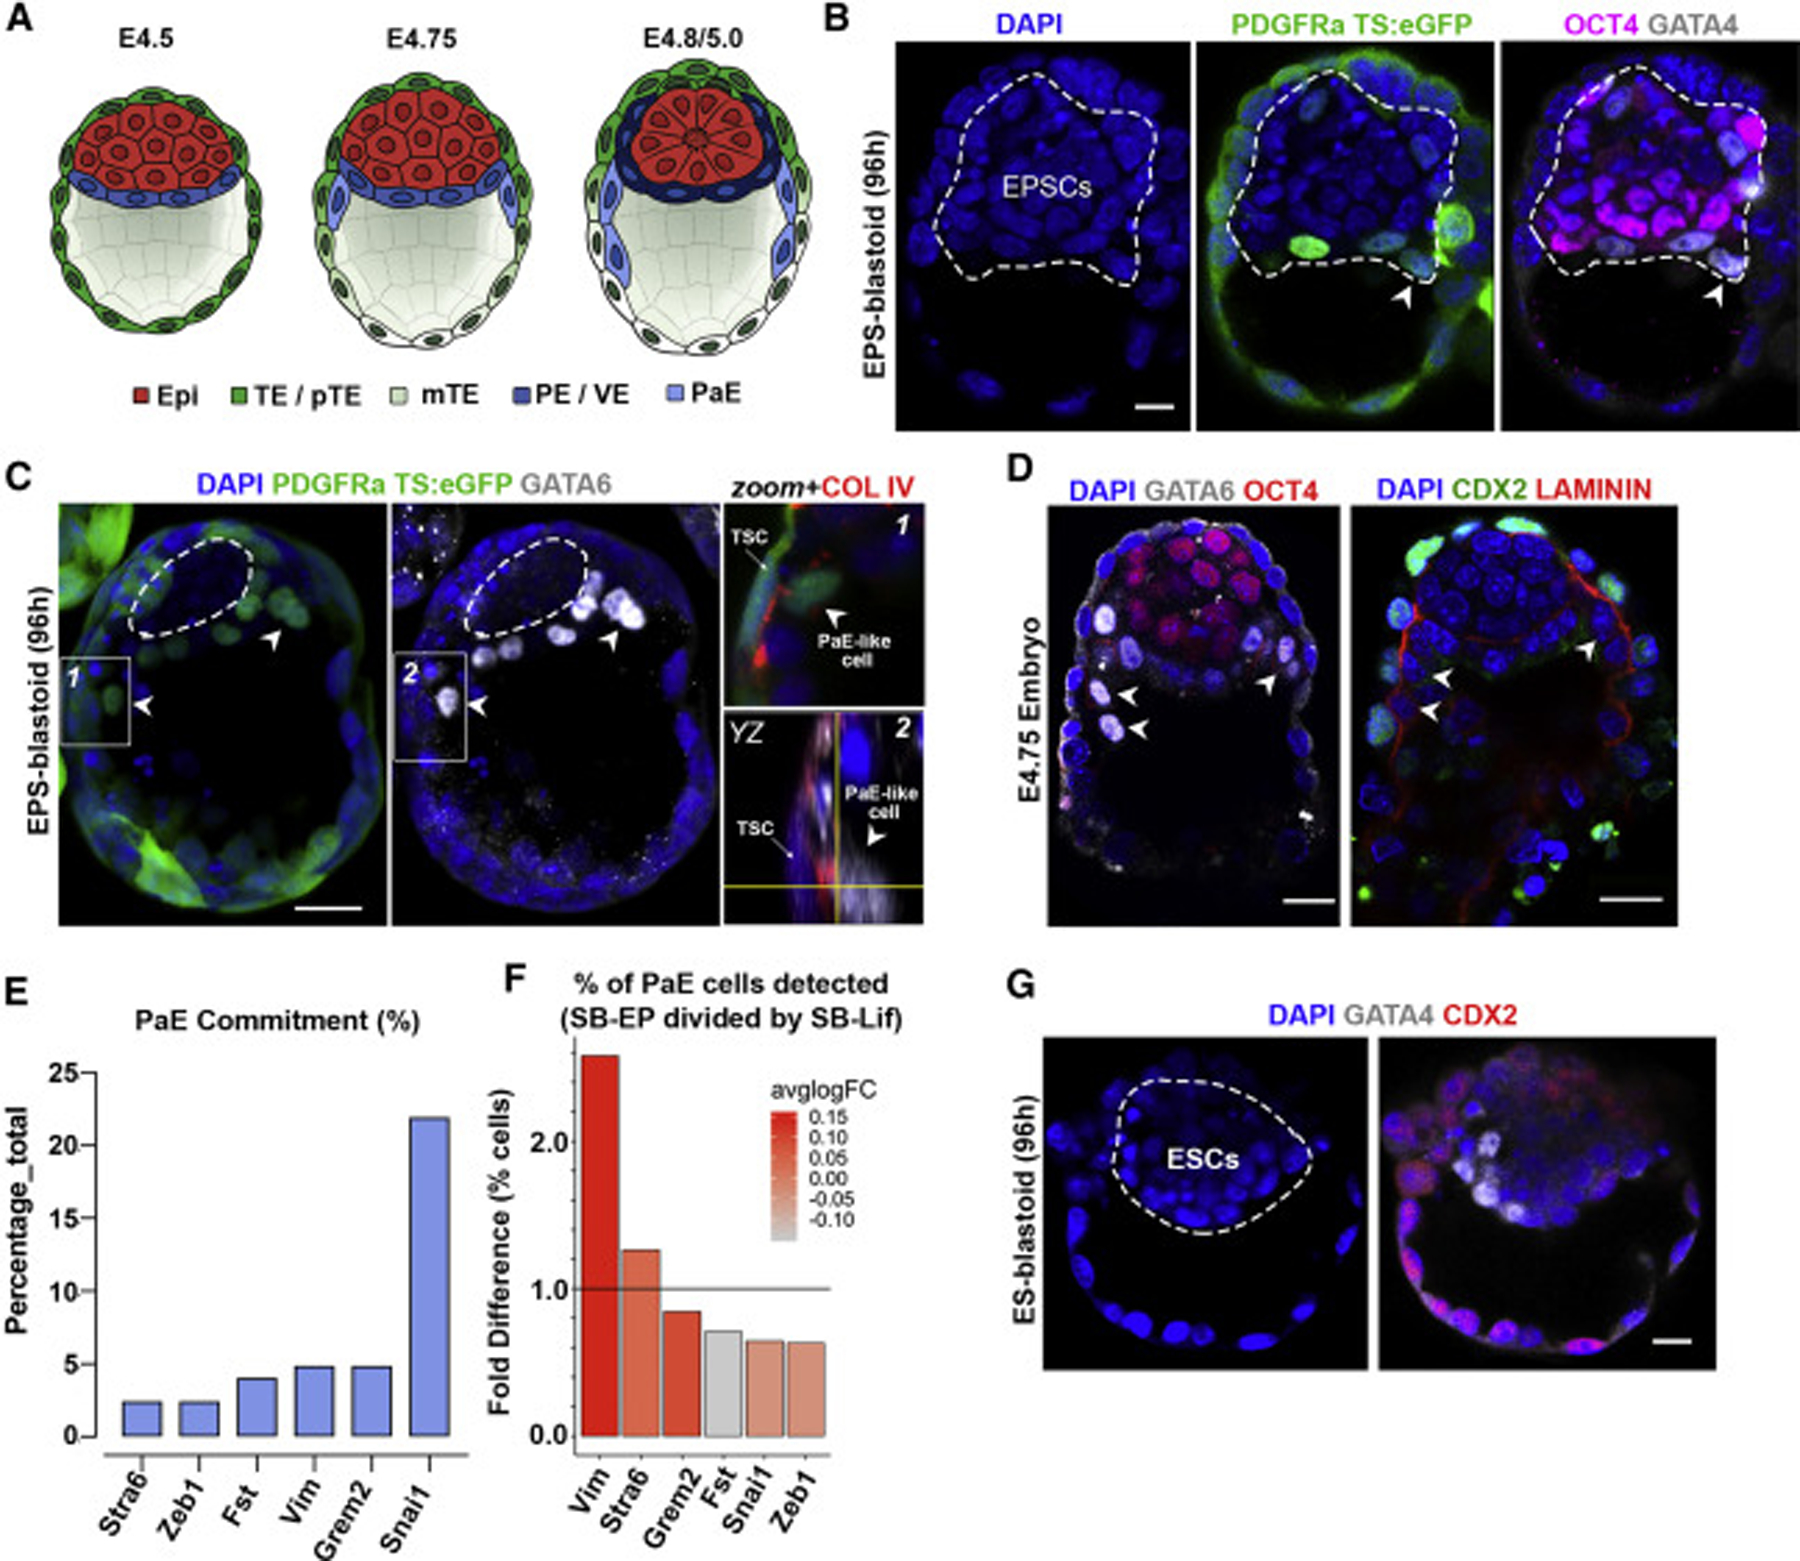
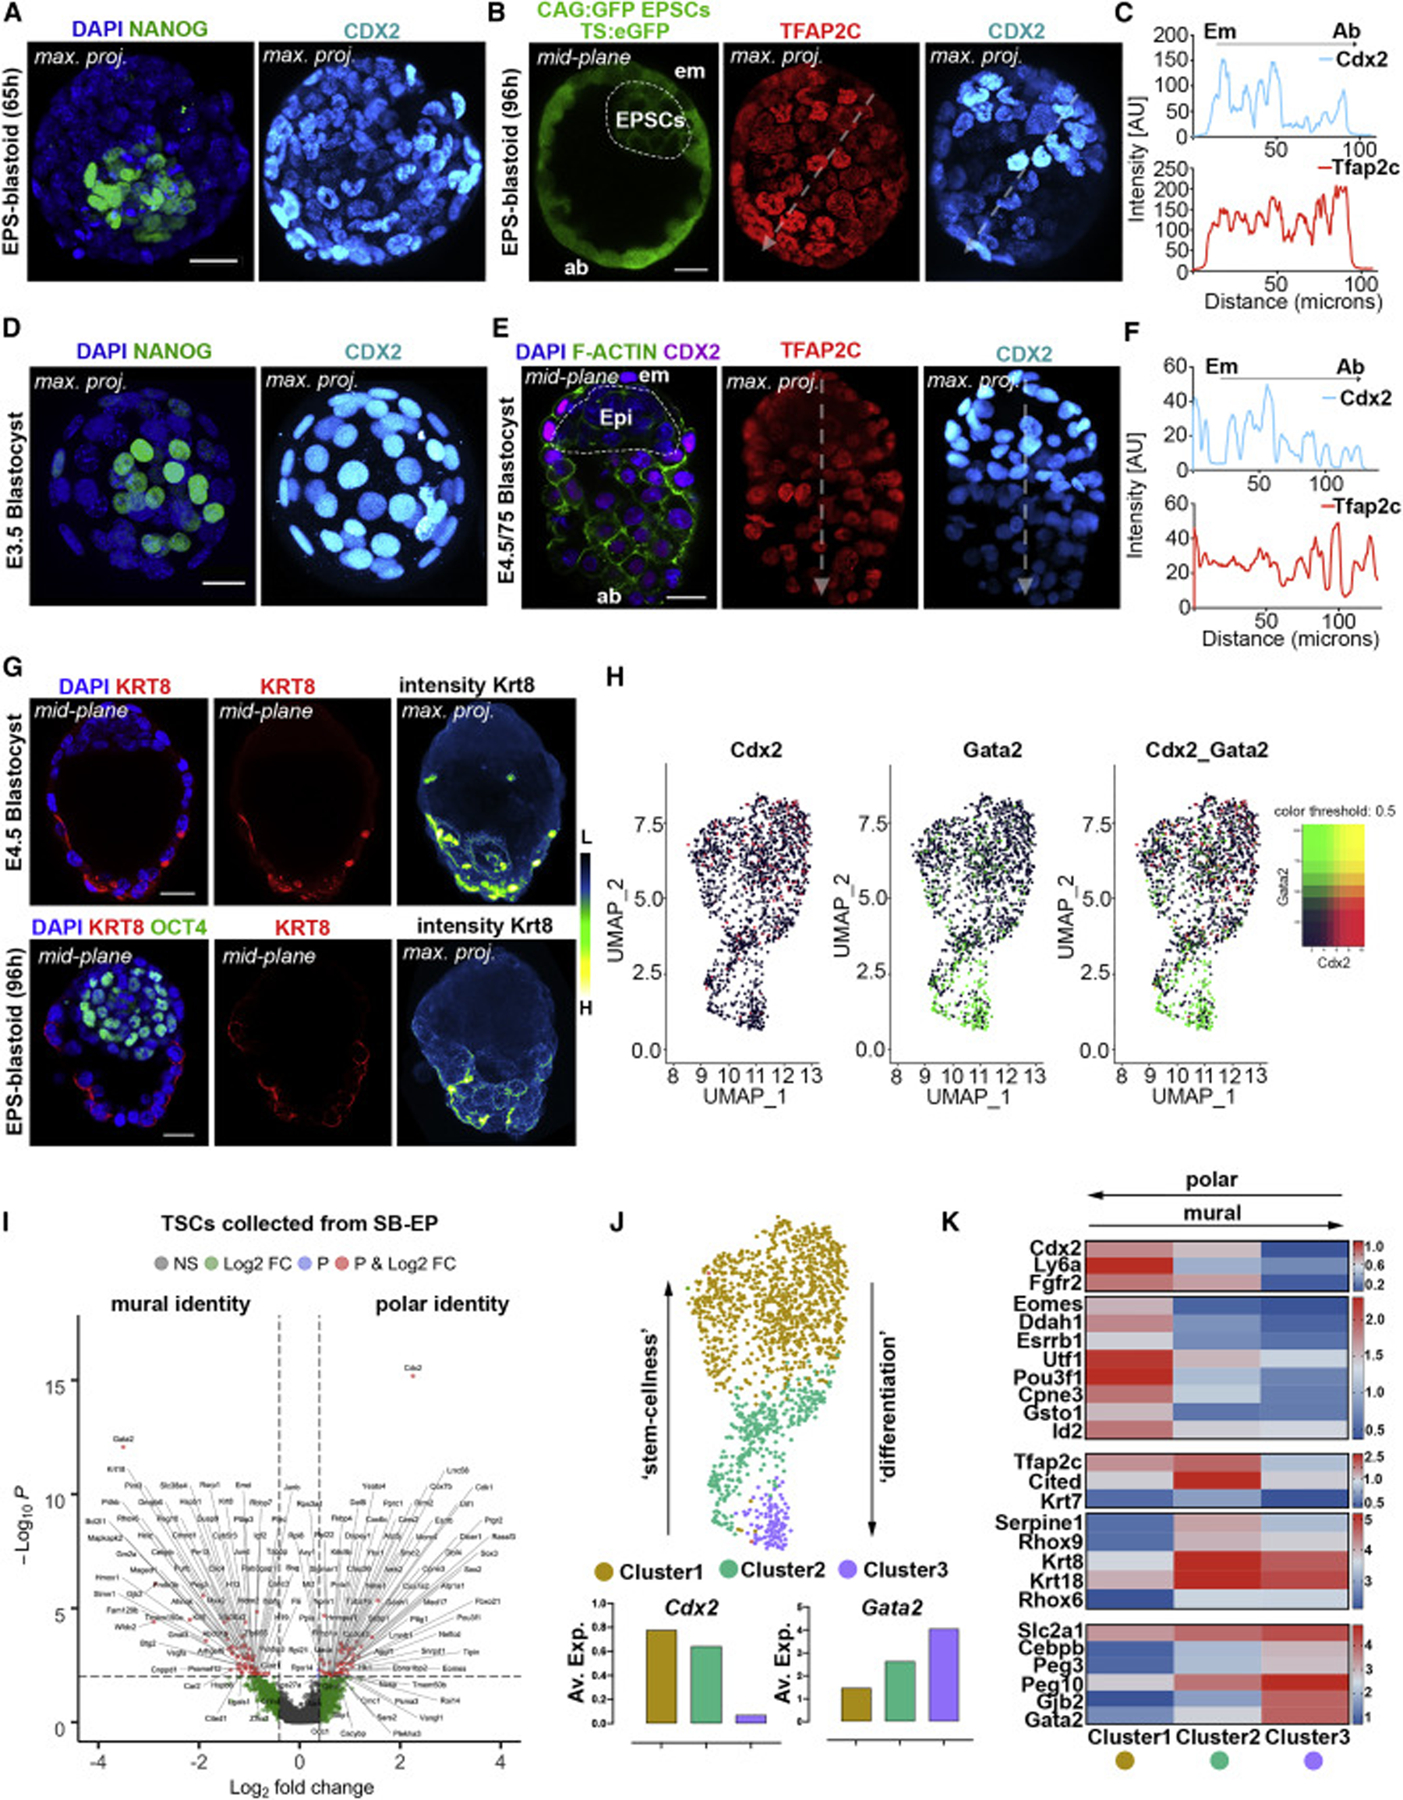
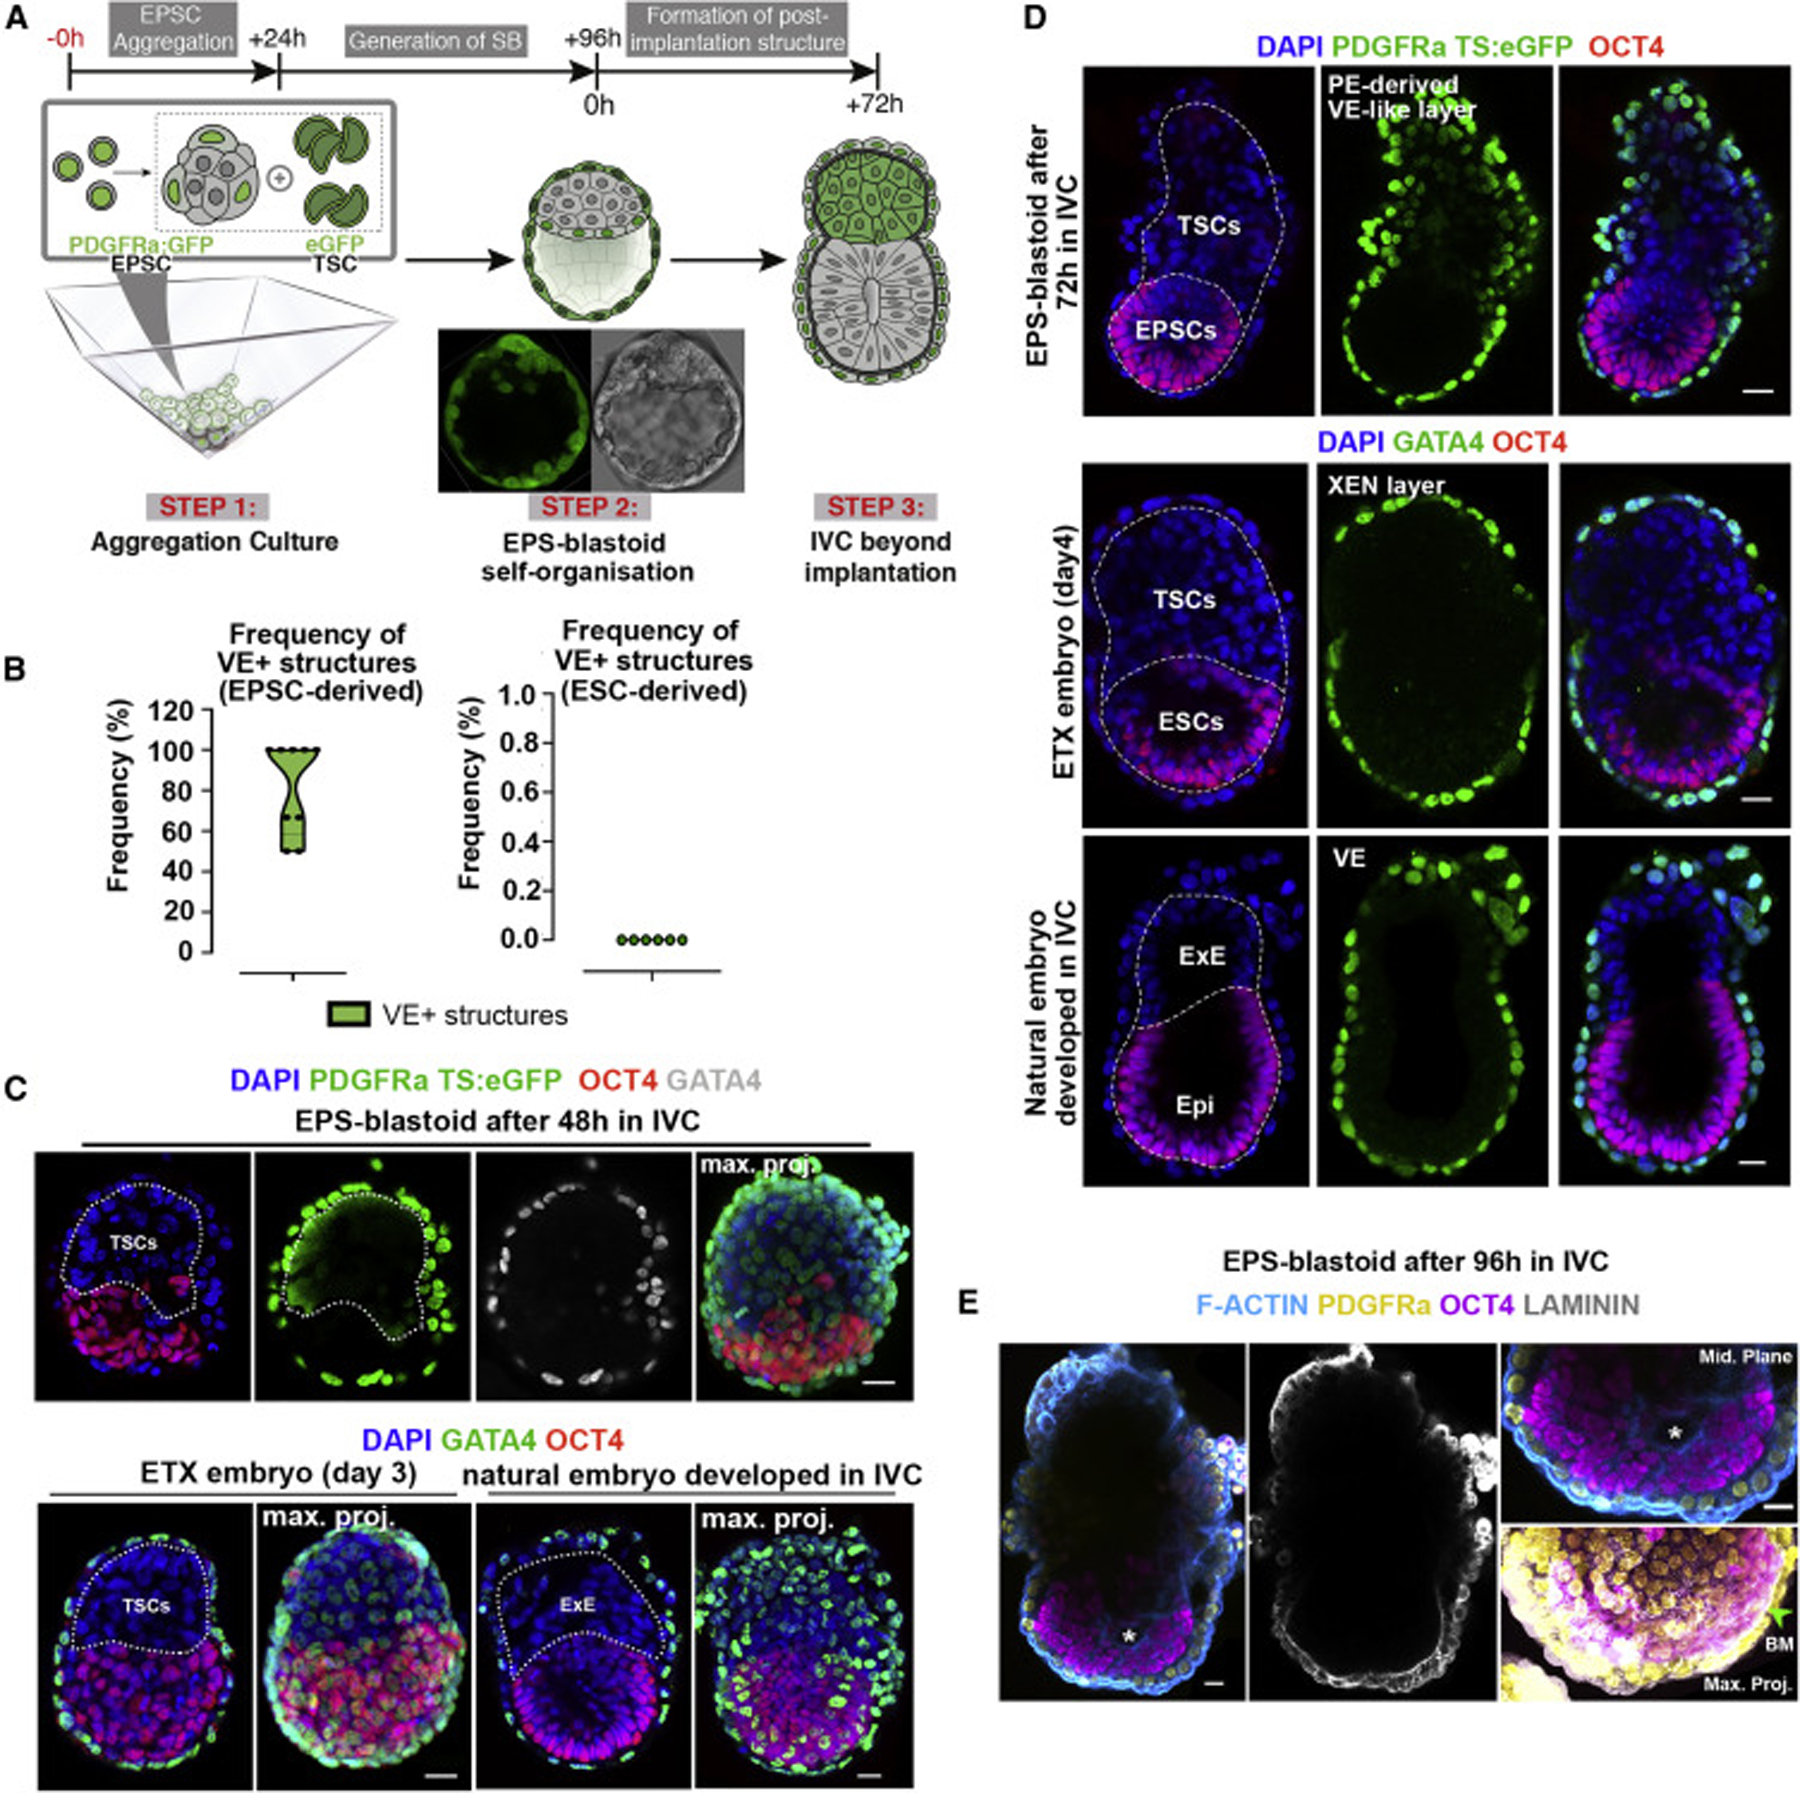
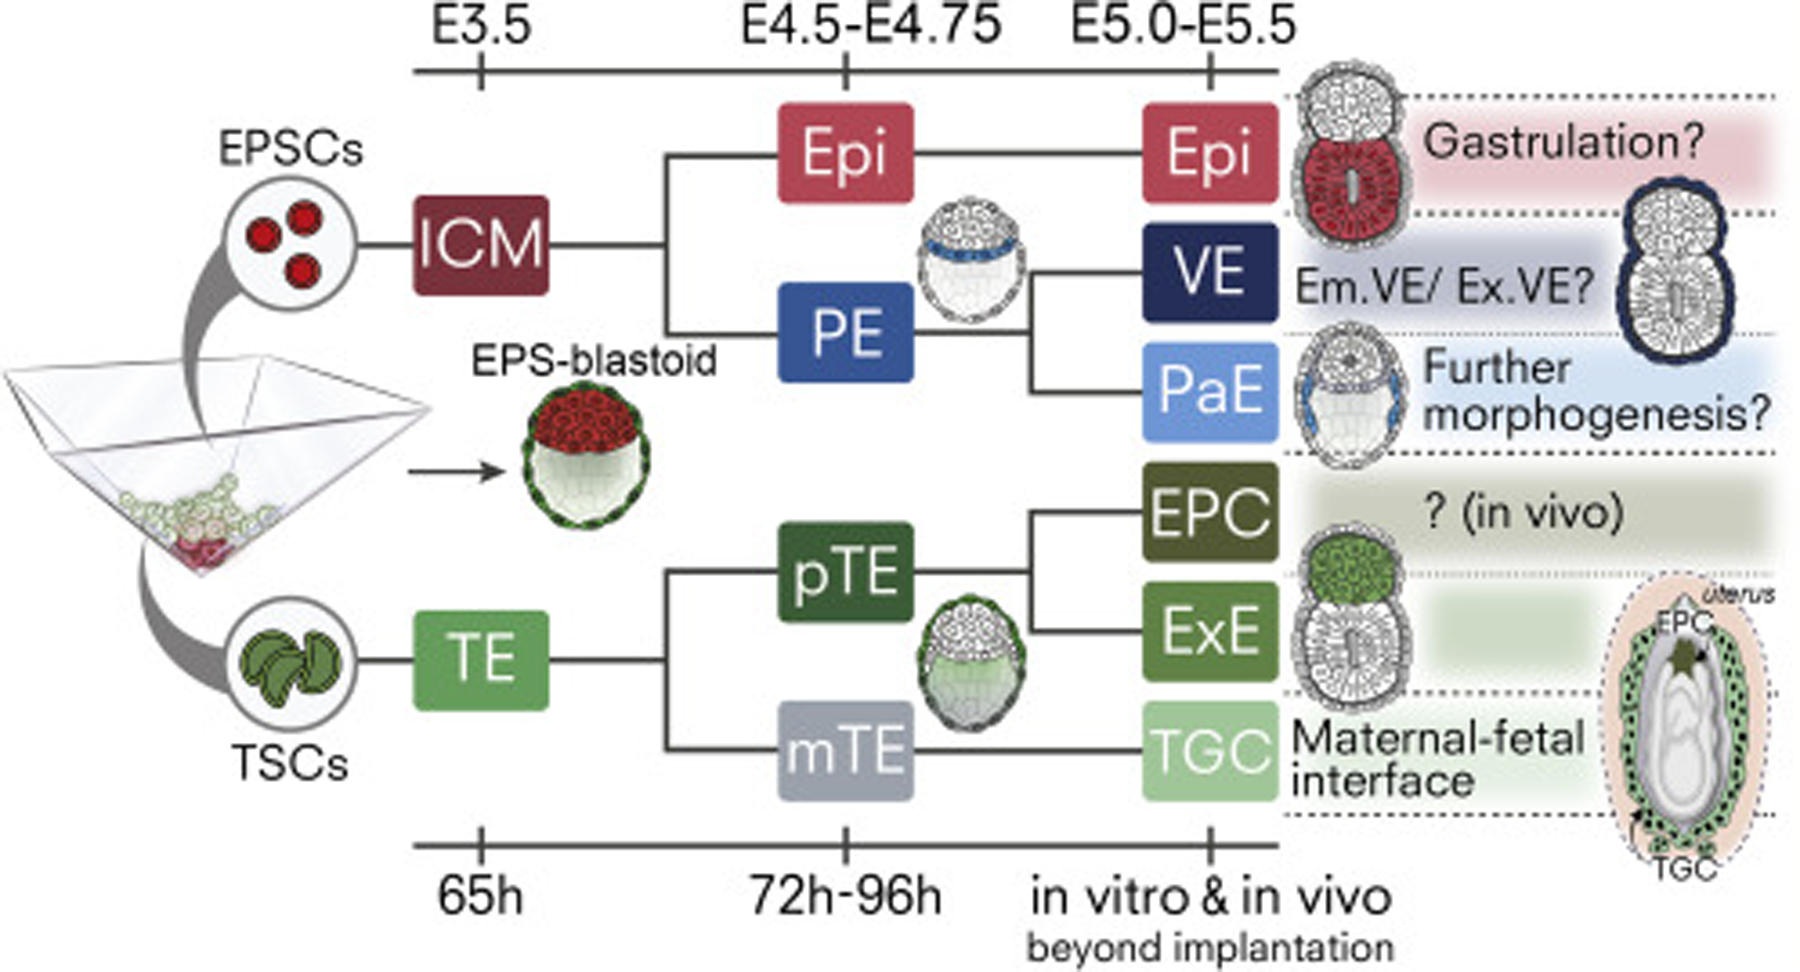
Mammalian blastocysts comprise three distinct cell lineages essential for development beyond implantation: the pluripotent epiblast, which generates the future embryo, and surrounding it the extra-embryonic primitive endoderm and the trophectoderm tissues. Embryonic stem cells can reintegrate into embryogenesis but contribute primarily to epiblast lineages. Here, we show that mouse embryonic stem cells cultured under extended pluripotent conditions (EPSCs) can be partnered with trophoblast stem cells to self-organize into blastocyst-like structures with all three embryonic and extra-embryonic lineages. Morphogenetic and transcriptome profiling analyses reveal that these blastocyst-like structures show distinct embryonic-abembryonic axes and primitive endoderm differentiation and can initiate the transition from the pre- to post-implantation egg cylinder morphology in vitro.

Keywords: Blastoid; Development; Embryo; Endoderm; Extended pluripotency; In Vitro; Preimplantation; Stem cells; Trophoblast.


Figures

Figure 1.
Figure 1.. Self-Assembly of Mouse EPSCs and TSCs into Blastocyst-like Structures (EPS-Blastoids)
(A) Protocol for generating EPS-blastoids. (B) EPS-blastoid built from TSCs (ubiquitous eGFP) and EPSCs (membrane CAG-GFP) at 72 h (n = 10). (C) EPS-blastoid using wild-type TSCs and EPSCs after 96 h of co-culture. Non-nuclear anti-Sox17 fluorescence represents non-specific antibody binding (n = 20). (D) Frequency of ESC- or EPSC-derived blastoids (see STAR Methods) containing PE-like cells. 233 EPS-blastoids (n = 6) and 123 ES-blastoids (n = 3) were scored based on PDGFRa, alongside other PE markers including Sox17, Gata6, Gata4, and Foxa2. Two-sided Student’s t test, p = 0.0002. (E) Quantification of cell ratios between EPSC or Epi, TSC or TE, and PE-like or PE lineages in EB (n = 13), LB (n = 7), and SB (n = 27). See Figure S1H. (F) Quantification of embryonic area in EB (n = 30), LB (n = 11), LB IVC (n = 12), and SB (96 h; n = 93). (G) Measurements of axial diameters in EB (n = 30), LB (n = 11), LB IVC (n = 12), and SB (n = 93). Illustration on right shows the 2 axes measured. (H) E3.5 blastocyst (n = 10; upper panel) and EPS-blastoid built from EPSCs (nuclear PDGFRa-H2B-GFP; dashed lines) and TSCs (ubiquitous eGFP) at 96 h (n= 20; lower panel). Two experiments. Asterisk, PE-like cells with aPKC expression (zoomed image). (I) Apicolateral assembly of F-actin flaments (Cyan) in EPS-blastoid (upper panel) and E3.5 blastocyst (lower panel). (J) Junction assembly in TSC-derived TE layer of EPS-blastoid. n = 20, 5 experiments. Right panels, zoomed images of a single TSC from TE-like epithelium. EB, early blastocyst (E3.5); LB, late blastocyst (E4.75); LB IVC, late blastocyst developed in vitro from 2-cell stage for 72 h; SB, synthetic blastocyst (96 h). Scale bars represent 20 μm; Error bars represent SEM in all panels.
Figure 2.
Figure 2.. Bi-potent EPSCs Support the Generation of an ICM-like Compartment with Extended Developmental Potency
(A) Localization of podocalyxin (Podxl; green) in natural blastocysts (n = 3 per group) and EPS-blastoids (n = 15), 2 experiments. Scale bars represent 20 μm. (B) Laminin (magenta; arrowheads) in late-stage PE-like or PE basal membranes. Magnified fields (bottom-right) display the PE (asterisks) and PE-like layers from images 1 and 2. n = 3 natural blastocysts, 10 EPS-blastoids, 3 experiments. Scale bars represent 20 μm. (C) Top, schematic for generating ESC or EPSC aggregates. Bottom, Aggregates co-expressing endogenous nuclear PDGFRa-H2B-GFP (green) and Sox17 (cyan) after immunostaining were scored as positive colonies. Nanog (magenta) indicates naive pluripotent cells. n = 100 aggregates per group, 3 experiments. Scale bar represent 20 μm. (D) Proportion of PE+ colonies specified under Serum-Lif (in the absence of 2i) or EP culture conditions for 24 or 48 h. One-way ANOVA, Tukey; p < 0.001; n = 100 per group; 3 experiments. Error bars represent SEM. (E) UMAP dimensional reduction shows clearly defined clusters in stem cell-derived blastocysts and E3.5, E4.5, E7.5 cells (Nowotschin et al., 2019). Each dot represents a single cell that is color-coded by sample type. SB, synthetic blastocyst; SB-lif, ES-blastoid; SB-EP, EPS-blastoid. (F) Gene expression distribution for DE-specific genes. (G) Proportion of cells expressing the PE (positive values on y axis) and DE (negative values on y axis) markers. Note that the PE-like cells from synthetic blastocysts generated with ESCs (SB-Lif) shows lower proportion than both E4.5 and those generated with EPSCs (SB-EP). (H) Main PE fate-determinant genes expressed within PE-like cell cluster of ES-(SB-Lif) or EPS-blastoids (SB-EP). See Figure S4A. (I) Fold-enrichment in the percentage of cells were detected and color-coded by the log2-fold change in average expression of PE determinant genes in PE-like cells in EPS-blastoids (SB-EP) over ES-blastoids (SB-Lif). (J) DEGs in PE-like cluster from ES- or EPS-blastoids. Cut-off for plotted genes, p < 10−6 and average log2FC > absolute value of 0.35, not Bonferroni adjusted. (K) Fold enrichment in the percentage of cells where Gata6 (gene expression > 1) was co-expressed with selected PE genes, Gata4, Pdgfra, Sparc, Sox17, and Dkk1 (gene expression > 1) within the PE-like cell cluster from EPS-blastoids (SB-EP) over ES-blastoids (SB-Lif).
Figure 3.
Figure 3.. Emergence of Parietal Endoderm (PaE) Subpopulations within PE-like Epithelium
(A) Peri-implantation changes in blastocyst morphology. Emergence of primitive endoderm (PE; blue), PaE (light blue), and visceral endoderm (VE; dark blue). Epi, epiblast; TE, trophectoderm; pTE, polar TE; mTE, mural TE. (B) EPS-blastoid with PDGFRa+ PaE-like cells. (C) EPS-blastoid built from nuclear PDGFRa-H2B-GFP EPSCs and ubiquitous-eGFP TSCs. Arrowheads show PDGFRa and/or GATA6+ PaE-like cells extending along blastocoel cavity. Left and middle images show stack of 5 Z-planes. Boxed insets (labelled 1 and 2) on the right show Col IV (red) expression between PaE-cell and TSCs in single Z-plane. Orthagonal YZ view shown in inset 2 for better visualization. (D) Natural E4.75 blastocyst showing early PaE formation (arrowheads). (E) Percentage of cells expressing PaE-related genes as identified by sc-RNA-seq within the PE-like cell cluster in EPS-blastoids. (F) The percentage and average expression levels of genes associated with PaE fate commitment within PE-like cell cluster in EPS-blastoids over ES-blastoids. (G) Representative image of ESC-derived blastocyst in which there is no PaE formation. Scale bars represent 20 μm in all panels.
Figure 4.
Figure 4.. Emergence of Distinct Subpopulations within TSC-Derived Epithelium Marks the Embryonic-Abembryonic Axis in EPS-Blastoids
(A) Uniform Cdx2 expression in TSC-derived epithelium. 100%, n = 10/10 structures, 2 experiments. (B) Cdx2-Tfap2c reverse gradient within the TSC-derived epithelium defining the embryonic-abembryonic axis. Dashed arrows, plane used to plot intensity profiles. (C) Intensity plots of Cdx2 and Tfap2c expression. 73%, n = 11/15 structures, 3 experiments. (D and E) Natural blastocysts at E3.5 with uniform Cdx2 expression and at E4.5–4.75 displaying a reverse gradient for Cdx2 and Tfap2c within TE. Dashed arrows, plane used to plot intensity profiles. (F) Intensity plots for Cdx2 and Tfap2c expression. 100%, n = 10/10 embryos, 2 experiments. (G) Cytokeratin8 (KRT8) immunostaining on abembryonic side of EPS-blastoid (n = 8/10) or E4.75 blastocyst (n = 9/10). KRT8 signal pseudocoloured with ‘‘fire’’ lookup table in Fiji to highlight intensity gradients on maximum projected images (right). L, low; H, high expression. 3 experiments. (H) UMAP dimensional reduction on TSCs illustrating polarization via differential expression of Gata2 and Cdx2 along the mural-polar axis. (I) DEGs between mural-like and polar-like TSCs from EPS-blastoids (STAR Methods). Cut-off for plotted genes, p < 10−2 and log2FC > absolute value bigger than 0.5, not Bonferroni adjusted. (J) Louvain clustering shows emergence of three subpopulations within TSC-derived epithelium. Graphs below, average expression of Cdx2 or Gata2 within Louvain cluster analysis. (K) Heatmap for the log2 normalized average expression of polar and mural TE genes between the 3 TSC clusters identified. Scale bars represent 20 μm in all panels. Intensity plots calculated using the ‘‘plot-profile’’ function in Fiji software.
Figure 5.
Figure 5.. Self-Organization of EPS-Blastoids into Post-implantation-like Morphology In Vitro
(A) Protocol for generating post-implantation-like structures from EPS-blastoids in vitro. Central micrograph shows a representative EPS-blastoid built from nuclear PDGFRa-H2B-GFP EPSCs and ubiquitous eGFP TSCs. (B) Efficiency of PE-derived VE-like layer formation from EPS-blastoids (left; n = 15/19, 8 experiments) or ES-blastoids (right; n = 0/10, 6 experiments). (C) Top, post-implantation-like structure formed from EPS-blastoid after 48 h in vitro (n = 10). Nuclear PDGFRa-H2B-GFP and ubiquitous eGFP TSC signals define the PE-like cell-derived VE-layer and TSC-derived ExE, respectively. Bottom-left, ETX embryo built from ESCs, TSCs, and XEN cells (n = 20). Bottom-right, natural embryo developed in IVC (n = 10). 3 experiments. (D) Top, post-implantation-like structure generated by self-organization of EPS-blastoid following 72 h culture in vitro. Endogenous PDGFRa signal, PE-like cell derived VE (n = 25, 18 experiments). Middle, ETX embryo. Gata4 reveals XEN-derived VE. Bottom, Natural embryo developed in IVC. Gata4 reveals natural VE. White dashed lines outline embryonic-extraembryonic border and base of VE. n = 15 per group, 3 experiments. (E) Post-implantation stage structure formed from PDGFRa-H2B-GFP EPS-blastoid. Magnified fields display cavity (top-right; white asterisk) within EPSC-derived embryonic compartment, and basement membrane (bottom-right; green arrowhead) between EPSC and VE-like layer. Maximum projected image (bottom-right) is rotated 30 degrees for a better visualization of basement membrane between embryonic-extraembryonic layers. Scale bars represent 20 μm; Error bars represent SEM in all panels.
Figure 6.
Figure 6.. EPS-Blastoids Initiate Implantation In Vivo
(A) Number of deciduae obtained after transfer to pseudopregnant females at E2.5 or E3.5. Representative deciduae dissected 4 days post-transfer. NB, natural blastocyst induced; SB, EPS-blastoid induced; M, mesometrial; AM, anti-mesometrial. (B) Decidua remodelling in natural embryo implantation. S, stroma; G, glands; U, uterine tissue; LE, luminal epithelium; rLE, regressed LE; E, implanted embryo; TGC, trophoblast giant cells; PDZ, primary decidua zone; SDZ, secondary decidua zone. (C and D) Immunohistochemical staining of the EPS-blastoid-induced decidua. Ptgs2 marks PDZ (C), Ki67 marks normal tissue proliferation of SDZ (D); Yellow asterisk, implantation site; n = 8 SB-induced decidua. (E and F) Immunohistochemical staining of the decidua at 5.5 d.p.c. Ptgs2 marks PDZ. E, embryo (E). Ki67 marks normal tissue proliferation of SDZ. Yellow asterisk: implantation site (F). n = 2 NB-induced decidua. (G) Proliferin (PLF) and Krt18 mark TCGs upon invasion. Yellow or black asterisk, implantation site. n = 4 EPS-blastoid-induced decidua. (H) The EPS-blastoid-induced decidua section shows immunohistoflourescence for Ptgs2 (yellow) at implantation site, Cdx2 (red) for implanting conceptus. Implanted structure magnified, Cdx2 co-localises with ubiquitous TS:eGFP expression (yellow arrows); surrounding cells are positive for nuclear PDGFRa-H2B-GFP (white arrowheads). Right, representative EPS-blastoid before transfer (nuclear PDGFRa-H2B-GFP for PE-like cells and ubiquitous eGFP for TSCs). n = 3 SB-induced decidua. (I) Break-down of LE during implantation. Top, E-cadherin marks LE before the closure (left); implantation site with lost LE (right). Cdx2 indicates implanted conceptus. Note disrupted structural integrity indicating resorption. Bottom, shows same events during natural implantation (e, embryo). (J) Immunohistoflourescence for laminin (red) at basement membrane surrounding implanted conceptus (E). Laminin assembly absent in EPS-blastoid-induced deciduae (bottom) n = 3 NB-induced; 5 SB-induced deciduae. Scale bars represent 20 μm; Error bars represent SEM in all panels.
Figure 7.
Figure 7.. Generation of Blastocyst Lineages and Descendants from Stem Cells with Extended Pluripotency
EPS-blastoids produce lineages resembling naïve Epiblast (Epi; Red) and primitive endoderm (PE; light blue) progenitors. Upon development in vitro, Epi-like lineage transforms into primed, cavitating post-implantation Epi. PE-like progenitors give rise to two PE-derivatives, parietal endoderm (PaE; cyan) and visceral endoderm (VE; dark blue) that facilitate post-implantation remodelling. Concomitantly, TSCs first generate an epithelium resembling the preimplantation trophectoderm (TE; green). TE layer specifies polar (pTE; dark green) and mural identity (mTE; gray), establishing the embryonic-abembryonic axis. pTE having a high cell renewal capacity generates extra-embryonic ectoderm (ExE; green) beyond implantation in vivo and in vitro. Cells with mural identity invade maternal tissue and transform into trophoblast giant cells (TGCs; light green) that form the maternal-fetal interface in vivo. (EPC, Ectoplacental cone; brown).

References

    1. Anderson KGV, Hamilton WB, Roske FV, Azad A, Knudsen TE, Canham MA, Forrester LM, and Brickman JM (2017). Insulin fine-tunes self-renewal pathways governing naive pluripotency and extra-embryonic endoderm. Nat. Cell Biol 19, 1164–1177. - PubMed
    1. Andrews S (2010). FastQC a quality control to tool for high throughput sequence data
    1. Aplin JD, and Ruane PT (2017). Embryo-epithelium interactions during implantation at a glance. J. Cell Sci 130, 15–22. - PubMed
    1. Artus J, Piliszek A, and Hadjantonakis AK (2011). The primitive endoderm lineage of the mouse blastocyst: sequential transcription factor activation and regulation of differentiation by Sox17. Dev. Biol 350, 393–404. - PMC - PubMed
    1. Bao M, Xie J, Piruska A, and Huck WTS (2017). 3D microniches reveal the importance of cell size and shape. Nat. Commun 8, 1962. - PMC - PubMed

Publication types

MeSH terms