. 2019 Dec 15;8(12):1644.
doi: 10.3390/cells8121644.

Genetically Engineered Lung Cancer Cells for Analyzing Epithelial-Mesenchymal Transition

Affiliations

Genetically Engineered Lung Cancer Cells for Analyzing Epithelial-Mesenchymal Transition

Michał Kiełbus et al. Cells. .

Abstract

Cell plasticity, defined as the ability to undergo phenotypical transformation in a reversible manner, is a physiological process that also exerts important roles in disease progression. Two forms of cellular plasticity are epithelial-mesenchymal transition (EMT) and its inverse process, mesenchymal-epithelial transition (MET). These processes have been correlated to the poor outcome of different types of neoplasias as well as drug resistance development. Since EMT/MET are transitional processes, we generated and validated a reporter cell line. Specifically, a far-red fluorescent protein was knocked-in in-frame with the mesenchymal gene marker VIMENTIN (VIM) in H2170 lung cancer cells. The vimentin reporter cells (VRCs) are a reliable model for studying EMT and MET showing cellular plasticity upon a series of stimulations. These cells are a robust platform to dissect the molecular mechanisms of these processes, and for drug discovery in vitro and in vivo in the future.

Keywords: cancer cell line; epithelial–mesenchymal transition (EMT); mesenchymal–epithelial transition (MET); reporter; vimentin.


Conflict of interest statement

The authors declare no conflict of interest.

Figures

Figure 1
Figure 1
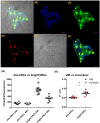
(A) Schematic representation of the genome editing strategy. Genomic region of H2170 cells targeted by CRISPR/Cas9 with homology arms marked in grey, while the targeted site in intron 8 is marked in dark blue. The donor DNA template contains the sequence of T2A-mCardinal-FLAG, flanked by two homology arms that correspond to VIM gene fragments (grey). The VIM allele in VRCs contains the knocked-in DNA, and the altered sequence recognized by Cas9 is colored in green. (BD). Subcellular localization of mCardinal fluorescent protein in living VRCs. The scale bar represents 10 µm. (B) mCardinal, (C) transmission, (D) merged.
Figure 2
Figure 2
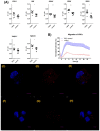
(AF) Immunofluorescent labeling of FLAG-tagged mCardinal and VIM in VRCs. Shown in green, the FLAG tag (C) is seen as bright spot-like areas surrounded by less intensive fields localized in the cytoplasm. Localization of VIM shown in red (D) corresponds to the regions with the highest fluorescence of FLAG-tagged mCardinal (C). Blue colored DAPI, FLAG, VIM, and transmission are merged in picture A. (B) DAPI, (C) anti-FLAG, (D) VIM, (E) transmission, (F) merged fluorescence. The scale bar represents 10 µm. (G) mCardinal fluorescence changes of sorted VRCs populations with time. The fluorescence of dim-VRCs and bright-VRCs populations was measured in 24 h (dim-VRCs – filled circles, bright-VRCs – squares) and 48 h (dim-VRCs – filled inverted triangles, bright-VRCs – rhomboids) of culture upon sorting. The points correspond to the fluorescence of selected ROIs, whereas the lines show mean fluorescence. Statistically significant changes in fluorescence between treated vs. control cells are marked with an asterisk; * p ≤ 0.05 (Mann–Whitney test). (H) VIM (filled circles) and mCardinal (red filled squares) quantification by qPCR showed similar amounts of both transcripts. VIM and mCardinal genes were measured in dim-VRCs transfected cells in 24 or 48 h upon transfection. The data shows the mean 2–ΔCT relative to GAPDH. The graph shows the representative result of the measurement, which was done in triplicate. The changes were statistically significant (* p ≤ 0.05) in comparison to the control group.
Figure 3
Figure 3
(A) CDH1, VIM, SNAI1, ZEB1, ZEB2, TWIST1, and TWIST2 quantification by qPCR. Assessed genes were measured in VRCs untreated (squares) and treated (circles) with TGFβ for 72 h. The data shows mean 2–ΔCT relative to GAPDH. The graph shows the representative result of the measurement. Statistical significance in comparison to control was calculated using the Mann–Whitney test and represented using the following annotations: * p ≤ 0.05; ** p ≤ 0.01. (B) Real-time migration analysis of transfected VRCs using xCELLigence system. The line shows mean normalized cell index, whereas the colored area depicts the standard deviation of three replicates. Migration of VRCs treated with TGFβ shown in blue, control shown in red. (CH) Subcellular localization of mCardinal fluorescent protein in living VRCs treated with TGFβ for 72 h (CE) and untreated (FH). (C,F) nucleus (DAPI), (D,G) mCardinal, (E,H) merged. The scale bar represents 5 µm.
Figure 4
Figure 4
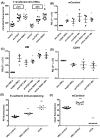
(A) mCardinal fluorescence of the dim-VRCs population transfected with active SNAI1 or proTGFβ plasmids. The fluorescence of the cells was measured after 24 h (control – filled circles, proTGFβ – filled squares, active SNAI1 – filled triangles) and 48 h (control – filled inverted triangles, proTGFβ – filled rhomboids, active SNAI1 – circles) of culture after sorting. The points correspond to the fluorescence of a selected ROI, whereas the lines show mean fluorescence. The fluorescence changes were considered statistically significant in comparison to the control group: * p ≤ 0.05 (Mann–Whitney test). (B) mCardinal and (C) VIM relative quantification (RQ) by qPCR. VIM and mCardinal genes were measured in transfected dim-VRCs 24 (proTGFβ – filled inverted triangles, active SNAI1 – filled squares) or 48 h (proTGFβ – filled rhomboids, active SNAI1 – filled circles) after transfection. dim-VRCs represented as circles, bright-VRCs represented as filled triangles. The data shows mean 2–ΔΔCT relative to GAPDH. The results were normalized to the control, which was pUC18-transfected dim-VRCs. The graph shows the representative result of the measurement, which was performed in triplicate. (D) Relative quantification of CDH1 by qPCR. CDH1 levels were measured in proTGFβ transfected dim-VRCs 24 (proTGFβ – filled inverted triangles) or 48 h (proTGFβ – filled rhomboids) after transfection. The graph shows mean RQ 2–ΔΔCT ± SEM relative to GAPDH. The results were normalized to the control, which was pUC18-transfected dim-VRCs 48 h after transfection. The graph shows the representative result of the measurement, which was performed in triplicate. dim-VRCs represented as circles, bright-VRCs represented as filled triangles. (E) Immunostaining of E-cadherin and (F) mCardinal fluorescence in VRCs and HT29 E-cadherin positive cells by flow cytometry. VRCs control—VRCs transfected with pUC18 vector; VRCs OVOL2—OVOL2-overexpressing cells 24 h after transfection. Immunostained untransfected HT29 cells were used as controls. The graph shows the single reads as well as the mean value of three independent experiments. Statistical significance in comparison to control group is represented by asterisks: * p ≤ 0.05; ** p ≤ 0.01; *** p ≤ 0.001. VRCs control represented as filled circles, VRCs OVOL2 represented as filled triangles, HT29 represented as filled inverted triangles.
Figure 5
Figure 5
(AC) Relative quantification of CDH1, ZEB1, and ZEB2 transcripts in transfected VRCs by qPCR. The expression of genes relative to GAPDH was measured 48 h after transfection of VRCs with OVOL2 (filled squares) and microRNA-expressing vectors (miR-145 – filled inverted triangles, miR-200b – squares, miR-200c – triangles, and miR-205 – inverted triangles). The results were normalized to VRCs control – filled circles (mock transfected) and shown as mean RQ 2–ΔΔCT as well as single values. The graph contains data from at least two independent experiments, which were measured in triplicate. Statistical significance in comparison to control was calculated using the Mann–Whitney test and was rated by asterisk: * p ≤ 0.05; ** p ≤ 0.01; *** p ≤ 0.001. (D) Real-time migration analysis of transfected VRCs using xCELLigence system. The line shows mean normalized cell index, whereas the colored area depicts the standard deviation of three replicates. Migration of VRCs transfected with OVOL2 is shown in green, miR-200c shown in blue, miR-205 shown in black, whereas pUC18, the control, is colored in red. The representative results from two different experiments are presented.

References

    1. Vicente-Dueñas C., Gutiérrez de Diego J., Rodríguez F.D., Jiménez R., Cobaleda C. The role of cellular plasticity in cancer development. Curr. Med. Chem. 2009;16:3676–3685. doi: 10.2174/092986709789105019. - DOI - PubMed
    1. Pastushenko I., Blanpain C. EMT Transition States during Tumor Progression and Metastasis. Trends Cell Biol. 2019;29:212–226. doi: 10.1016/j.tcb.2018.12.001. - DOI - PubMed
    1. Dauphin M., Barbe C., Lemaire S., Nawrocki-Raby B., Lagonotte E., Delepine G., Birembaut P., Gilles C., Polette M. Vimentin expression predicts the occurrence of metastases in non small cell lung carcinomas. Lung Cancer. 2013;81:117–122. doi: 10.1016/j.lungcan.2013.03.011. - DOI - PubMed
    1. Mittal V. Advances in Experimental Medicine and Biology. Volume 890. Springer; Cham, Switzerland: 2016. Epithelial Mesenchymal Transition in Aggressive Lung Cancers; pp. 37–56. - PubMed
    1. Xiao D., He J. Epithelial mesenchymal transition and lung cancer. J. Thorac. Dis. 2010;2:154–159. - PMC - PubMed

Publication types