. 2019 Dec 17;20(1):723.
doi: 10.1186/s12859-019-3220-8.

Modeling aspects of the language of life through transfer-learning protein sequences

Affiliations

Modeling aspects of the language of life through transfer-learning protein sequences

Michael Heinzinger et al. BMC Bioinformatics. .

Abstract

Background: Predicting protein function and structure from sequence is one important challenge for computational biology. For 26 years, most state-of-the-art approaches combined machine learning and evolutionary information. However, for some applications retrieving related proteins is becoming too time-consuming. Additionally, evolutionary information is less powerful for small families, e.g. for proteins from the Dark Proteome. Both these problems are addressed by the new methodology introduced here.

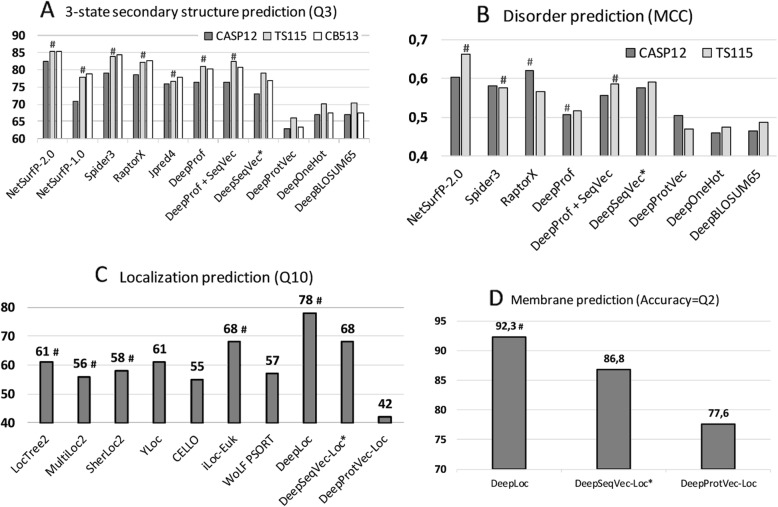
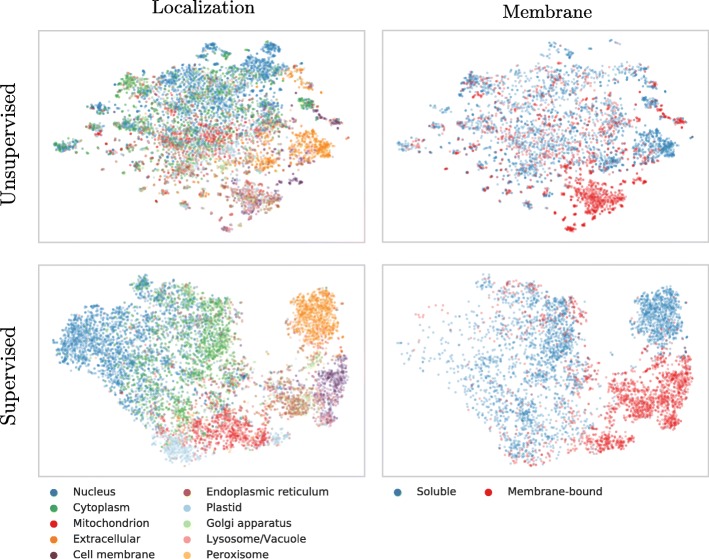
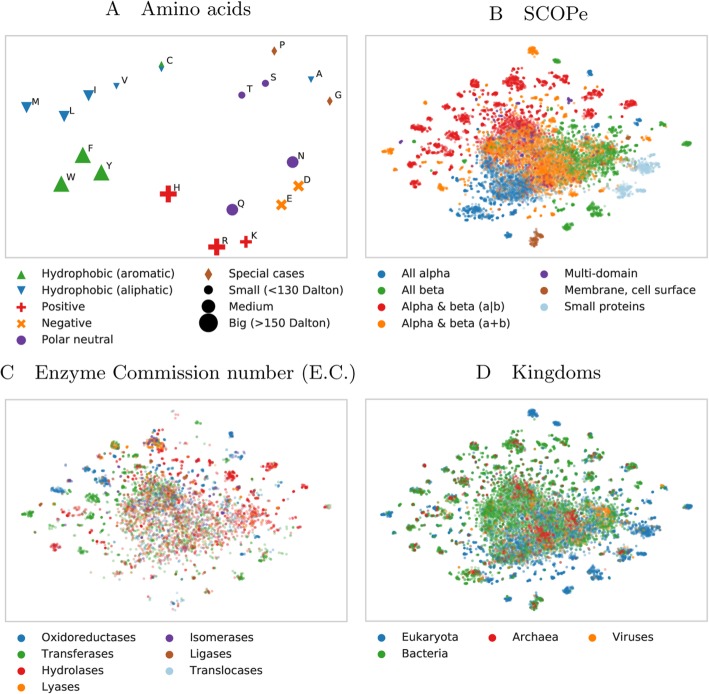
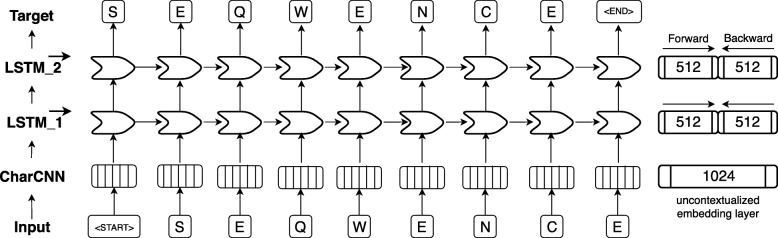
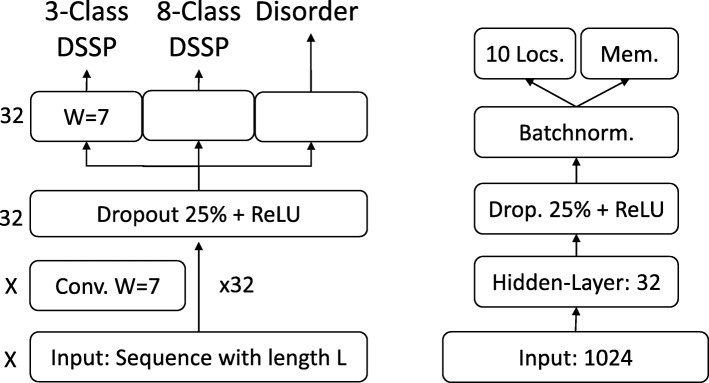
Results: We introduced a novel way to represent protein sequences as continuous vectors (embeddings) by using the language model ELMo taken from natural language processing. By modeling protein sequences, ELMo effectively captured the biophysical properties of the language of life from unlabeled big data (UniRef50). We refer to these new embeddings as SeqVec (Sequence-to-Vector) and demonstrate their effectiveness by training simple neural networks for two different tasks. At the per-residue level, secondary structure (Q3 = 79% ± 1, Q8 = 68% ± 1) and regions with intrinsic disorder (MCC = 0.59 ± 0.03) were predicted significantly better than through one-hot encoding or through Word2vec-like approaches. At the per-protein level, subcellular localization was predicted in ten classes (Q10 = 68% ± 1) and membrane-bound were distinguished from water-soluble proteins (Q2 = 87% ± 1). Although SeqVec embeddings generated the best predictions from single sequences, no solution improved over the best existing method using evolutionary information. Nevertheless, our approach improved over some popular methods using evolutionary information and for some proteins even did beat the best. Thus, they prove to condense the underlying principles of protein sequences. Overall, the important novelty is speed: where the lightning-fast HHblits needed on average about two minutes to generate the evolutionary information for a target protein, SeqVec created embeddings on average in 0.03 s. As this speed-up is independent of the size of growing sequence databases, SeqVec provides a highly scalable approach for the analysis of big data in proteomics, i.e. microbiome or metaproteome analysis.

Conclusion: Transfer-learning succeeded to extract information from unlabeled sequence databases relevant for various protein prediction tasks. SeqVec modeled the language of life, namely the principles underlying protein sequences better than any features suggested by textbooks and prediction methods. The exception is evolutionary information, however, that information is not available on the level of a single sequence.

Keywords: Deep Learning; Language Modeling; Localization prediction; Machine Learning; Secondary structure prediction; Sequence Embedding; Transfer Learning.


Conflict of interest statement

The authors declare that they have no competing interests.

Figures

Fig. 1
Fig. 1
Performance comparisons. The predictive power of the ELMo-based SeqVec embeddings was assessed for per-residue (upper row) and per-protein (lower row) prediction tasks. Methods using evolutionary information are highlighted by hashes above the bars. Approaches using only the proposed SeqVec embeddings are highlighted by stars after the method name. Panel A used three different data sets (CASP12, TS115, CB513) to compare three-state secondary structure prediction (y-axis: Q3; all DeepX developed here to test simple deep networks on top of the encodings tested; DeepProf used evolutionary information). Panel B compared predictions of intrinsically disordered residues on two data sets (CASP12, TS115; y-axis: MCC). Panel C compared per-protein predictions for subcellular localization between top methods (numbers for Q10 taken from DeepLoc [47]) and embeddings based on single sequences (Word2vec-like ProtVec [42] and our ELMo-based SeqVec). Panel D: the same data set was used to assess the predictive power of SeqVec for the classification of a protein into membrane-bound and water-soluble
Fig. 2
Fig. 2
t-SNE representations of SeqVec. Shown are t-SNE projections from embedded space onto a 2D representation; upper row: unsupervised 1024-dimensional “raw” ELMo-based SeqVec embeddings, averaged over all residues in a protein; lower row: supervised 32-dimensional ELMo-based SeqVec embeddings, reduced via per-protein machine learning predictions (data: redundancy reduced set from DeepLoc). Proteins were colored according to their localization (left column) or whether they are membrane-bound or water-soluble (right column). Left and right panel would be identical except for the color, however, on the right we had to leave out some points due to lacking membrane/non-membrane annotations. The upper row suggests that SeqVec embeddings capture aspects of proteins without ever seeing labels of localization or membrane, i.e. without supervised training. After supervised training (lower row), this information is transferred to, and further distilled by networks with simple architectures. After training, the power of SeqVeq embeddings to distinguish aspects of function and structure become even more pronounced, sometimes drastically so, as suggested by the almost fully separable clusters in the lower right panel
Fig. 3
Fig. 3
Modeling aspects of the language of life. 2D t-SNE projections of unsupervised SeqVec embeddings highlight different realities of proteins and their constituent parts, amino acids. Panels B to D are based on the same data set (Structural Classification of Proteins – extended (SCOPe) 2.07, redundancy reduced at 40%). For these plots, only subsets of SCOPe containing proteins with the annotation of interest (enzymatic activity C and kingdom D) may be displayed. Panel A: the embedding space confirms: the 20 standard amino acids are clustered according to their biochemical and biophysical properties, i.e. hydrophobicity, charge or size. The unique role of Cysteine (C, mostly hydrophobic and polar) is conserved. Panel B: SeqVec embeddings capture structural information as annotated in the main classes in SCOPe without ever having been explicitly trained on structural features. Panel C: many small, local clusters share function as given by the main classes in the Enzyme Commission Number (E.C.). Panel D: similarly, small, local clusters represent different kingdoms of life
Fig. 4
Fig. 4
ELMo-based architecture adopted for SeqVec. First, an input sequence, e.g. “S E Q W E N C E” (shown at bottom row), is padded with special tokens indicating the start (“”) and the end (“”) of the sentence (here: protein sequences). On the 2nd level (2nd row from bottom), character convolutions (CharCNN, [94]) map each word (here: amino acid) onto a fixed-length latent space (here: 1024-dimensional) without considering information from neighboring words. On the third level (3rd row from bottom), the output of the CharCNN-layer is used as input by a bidirectional Long Short Term Memory (LSTM, [45]) which introduces context-specific information by processing the sentence (protein sequence) sequentially. For simplicity, only the forward pass of the bi-directional LSTM-layer is shown (here: 512-dimensional). On the fourth level (4th row from bottom), the second LSTM-layer operates directly on the output of the first LSTM-layer and tries to predict the next word given all previous words in a sentence. The forward and backward pass are optimized independently during training in order to avoid information leakage between the two directions. During inference, the hidden states of the forward and backward pass of each LSTM-layer are concatenated to a 1024-dimensional embedding vector summarizing information from the left and the right context
Fig. 5
Fig. 5
Prediction tasks’ architectures. On the left the architecture of the model used for the per-residue level predictions (secondary structure and disorder) is sketched, on the right that used for per-protein level predictions (localization and membrane/not membrane). The ‘X’, on the left, indicates that different input features corresponded to a difference in the number of input channels, e.g. 1024 for SeqVec or 50 for profile-based input. The letter ‘W’ refers to the window size of the corresponding convolutional layer (W = 7 implies a convolution of size 7 × 1)

References

    1. Rost B, Sander C. Jury returns on structure prediction. Nat. 1992;360:540. doi: 10.1038/360540b0. - DOI - PubMed
    1. Rost B, Sander C. Prediction of protein secondary structure at better than 70% accuracy. J Mol Biol. 1993;232:584–599. doi: 10.1006/jmbi.1993.1413. - DOI - PubMed
    1. Rost B, Sander C. Improved prediction of protein secondary structure by use of sequence profiles and neural networks. Proc Natl Acad Sci. 1993;90:7558–7562. doi: 10.1073/pnas.90.16.7558. - DOI - PMC - PubMed
    1. Barton GJ. Protein secondary structure prediction. Curr Opin Struct Biol. 1995;5:372–376. doi: 10.1016/0959-440X(95)80099-9. - DOI - PubMed
    1. Chandonia J-M, Karplus M. Neural networks for secondary structure and structural class predictions. Protein Sci. 1995;4:275–285. doi: 10.1002/pro.5560040214. - DOI - PMC - PubMed