. 2019 Dec 17;17(1):169.
doi: 10.1186/s12964-019-0478-4.

Carbonic anhydrase 2 (CAII) supports tumor blood endothelial cell survival under lactic acidosis in the tumor microenvironment

Affiliations

Carbonic anhydrase 2 (CAII) supports tumor blood endothelial cell survival under lactic acidosis in the tumor microenvironment

Dorcas A Annan et al. Cell Commun Signal. .

Abstract

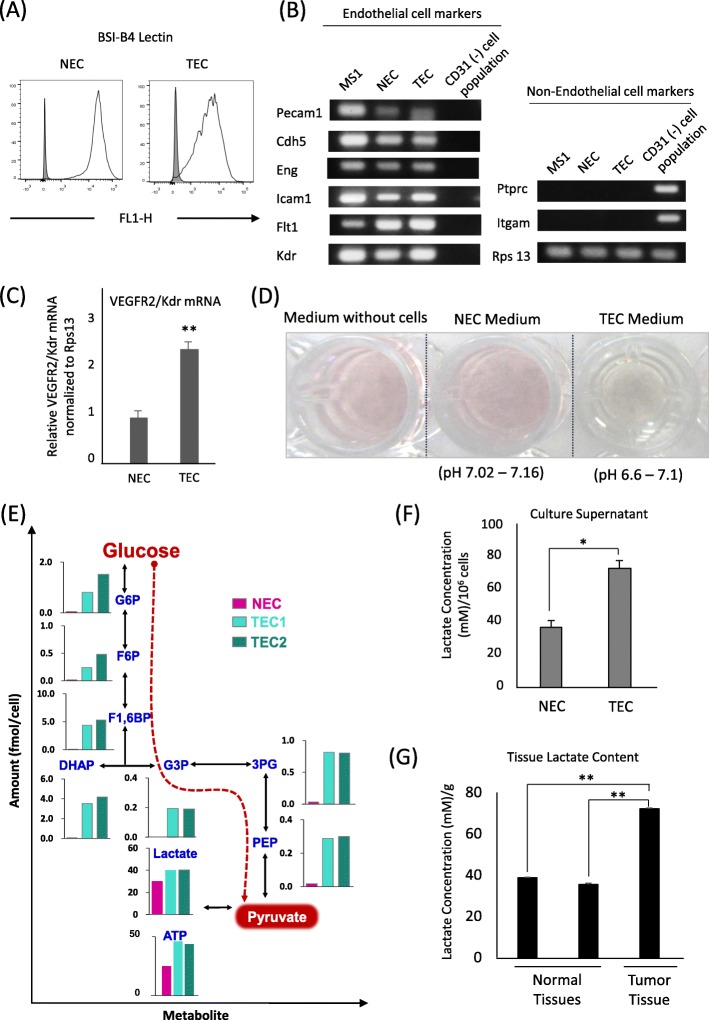
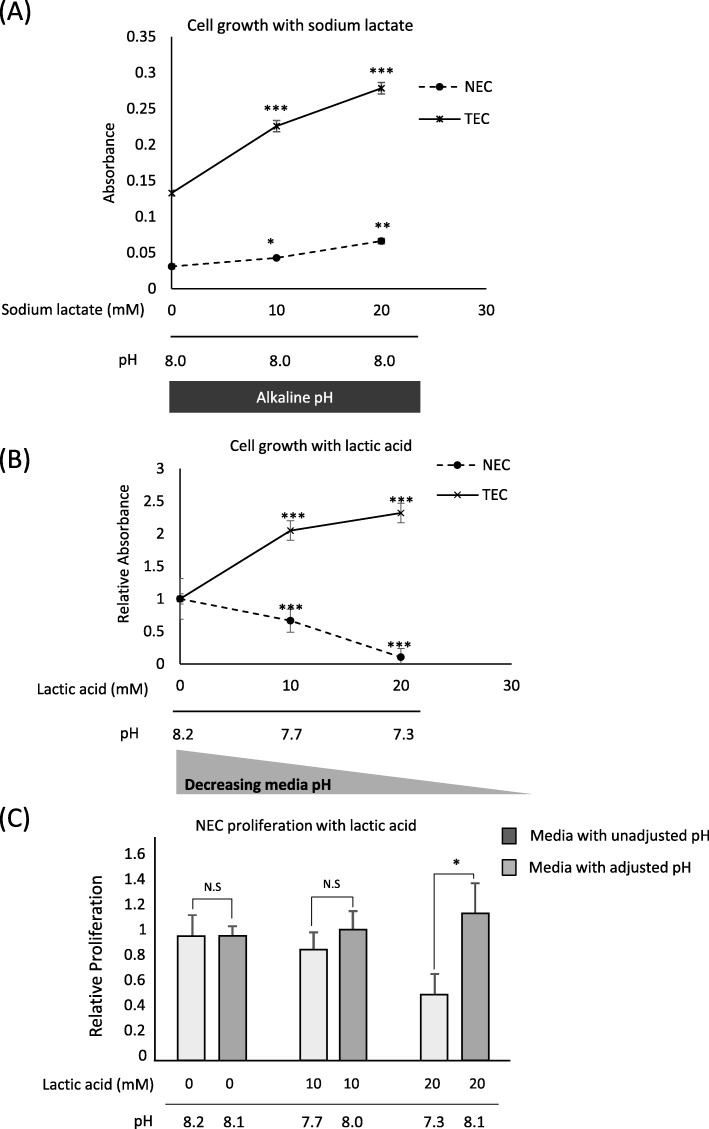
Background: Tumor endothelial cells (TECs) perform tumor angiogenesis, which is essential for tumor growth and metastasis. Tumor cells produce large amounts of lactic acid from glycolysis; however, the mechanism underlying the survival of TECs to enable tumor angiogenesis under high lactic acid conditions in tumors remains poorly understood.

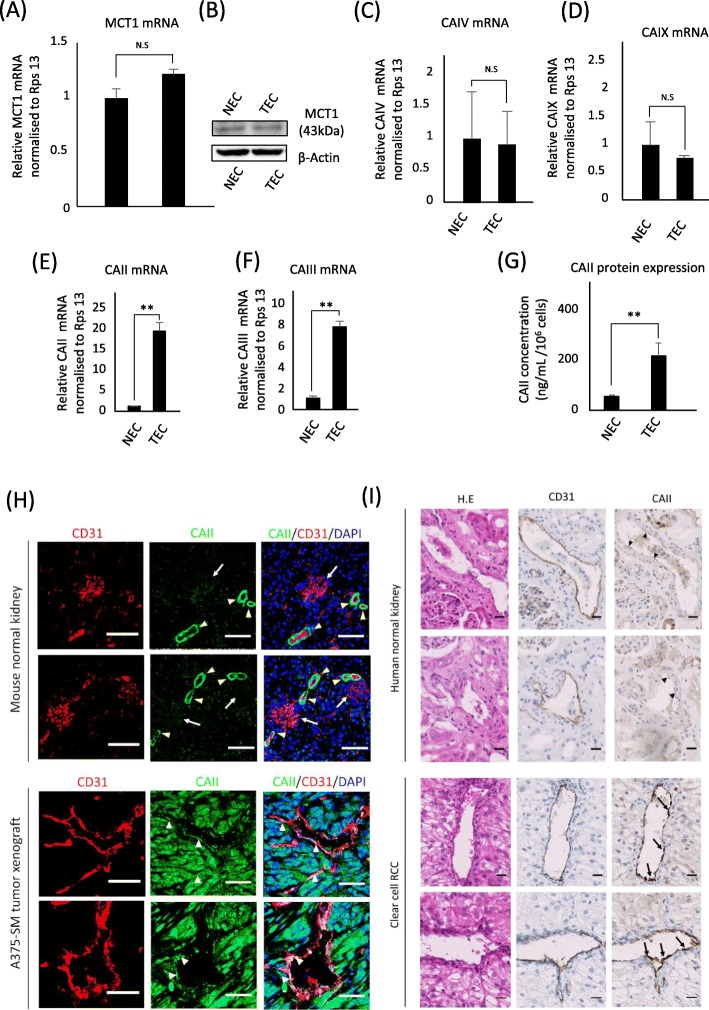
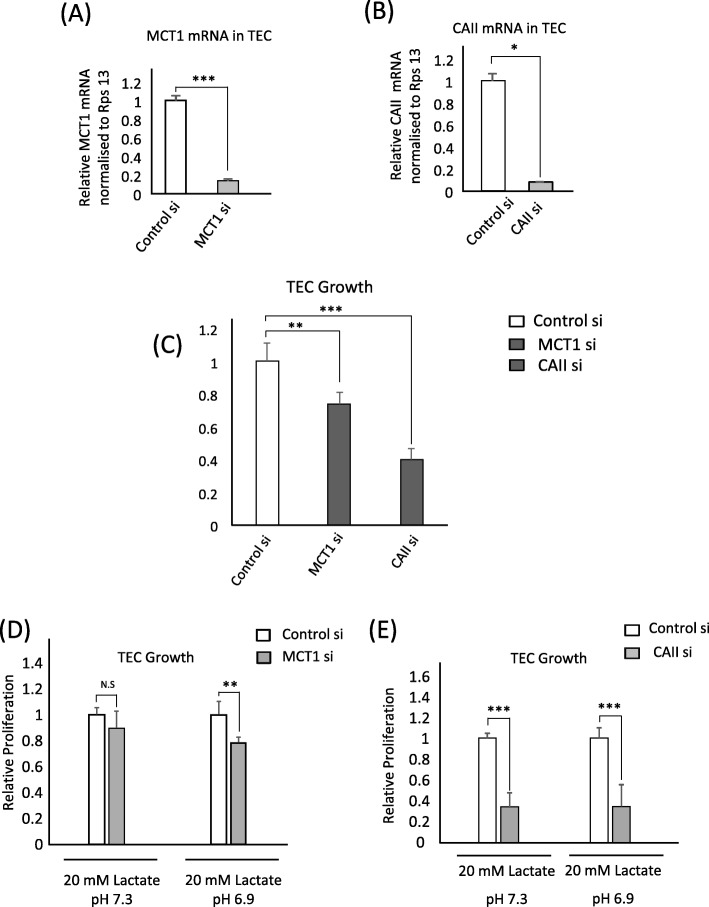
Methodology: The metabolomes of TECs and normal endothelial cells (NECs) were analyzed by capillary electrophoresis time-of-flight mass spectrometry. The expressions of pH regulators in TECs and NECs were determined by quantitative reverse transcription-PCR. Cell proliferation was measured by the MTS assay. Western blotting and ELISA were used to validate monocarboxylate transporter 1 and carbonic anhydrase 2 (CAII) protein expression within the cells, respectively. Human tumor xenograft models were used to access the effect of CA inhibition on tumor angiogenesis. Immunohistochemical staining was used to observe CAII expression, quantify tumor microvasculature, microvessel pericyte coverage, and hypoxia.

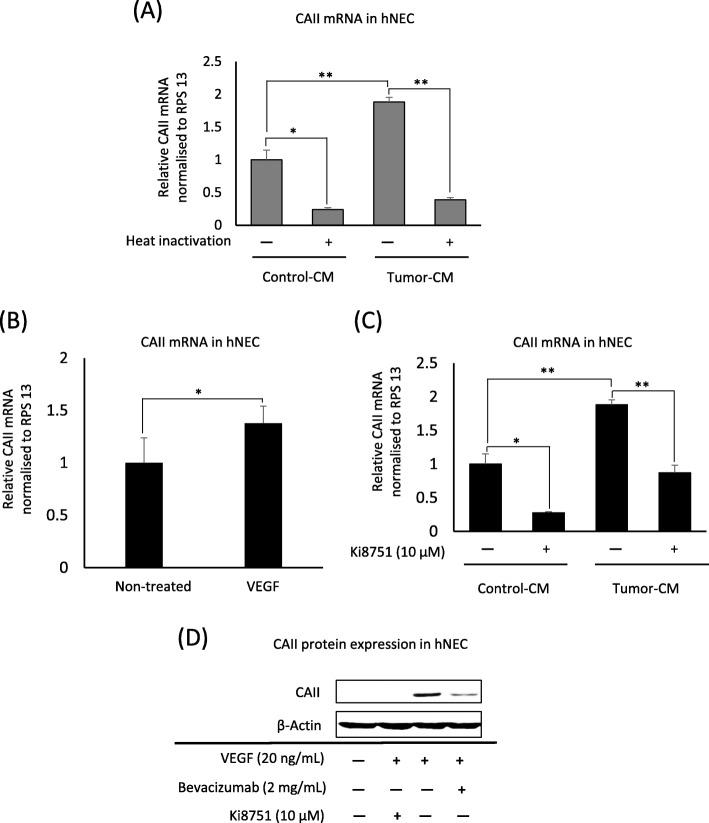
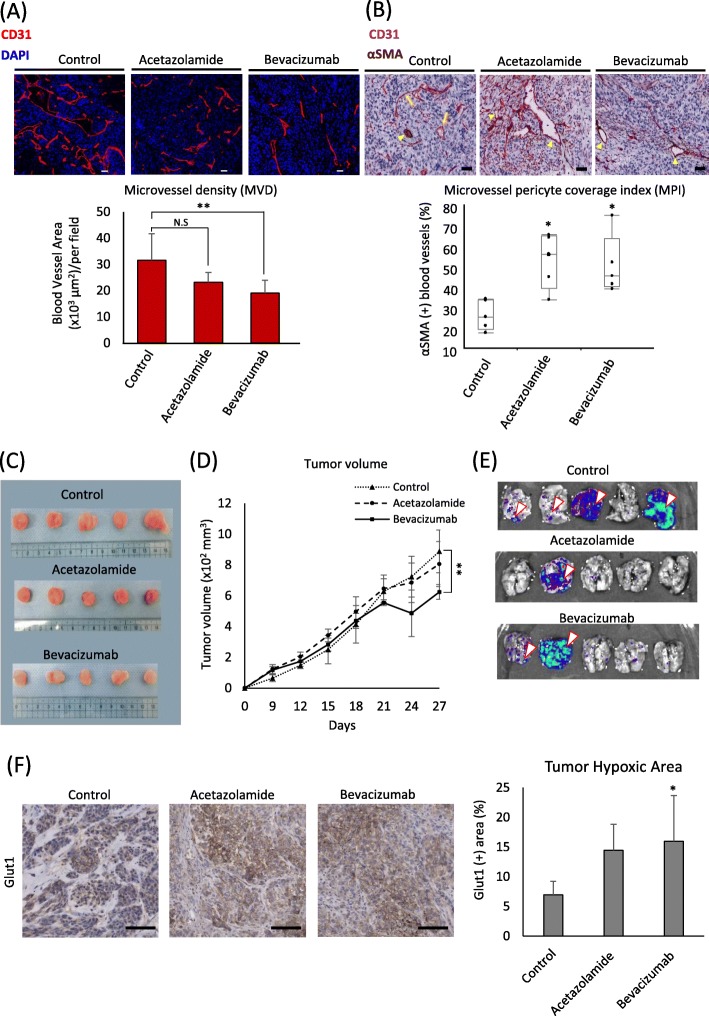
Results: The present study shows that, unlike NECs, TECs proliferate in lactic acidic. TECs showed an upregulated CAII expression both in vitro and in vivo. CAII knockdown decreased TEC survival under lactic acidosis and nutrient-replete conditions. Vascular endothelial growth factor A and vascular endothelial growth factor receptor signaling induced CAII expression in NECs. CAII inhibition with acetazolamide minimally reduced tumor angiogenesis in vivo. However, matured blood vessel number increased after acetazolamide treatment, similar to bevacizumab treatment. Additionally, acetazolamide-treated mice showed decreased lung metastasis.

Conclusion: These findings suggest that due to their effect on blood vessel maturity, pH regulators like CAII are promising targets of antiangiogenic therapy. Video Abstract.

Keywords: Angiogenesis; Carbonic anhydrase 2 (CAII); Lactic acidosis; Tumor endothelial cells; pH regulation.


Conflict of interest statement

The authors declare that they have no competing interests.

Figures

Fig. 1
Fig. 1
Glycolysis activation is higher in TECs than in NECs. a ECs’ flow cytometry analysis showing BSI-B4 lectin’s expression in stained (white) and unstained cells (gray). b Positive expression of EC markers (Pecam1, Cdh5, Eng, Icam1, Flt1, and Kdr). The murine endothelial MS1 cells cDNA was used as a positive control sample for EC markers. All ECs were negative for non-EC markers Itgam and Ptprc. Gene expression was analyzed by RT-qPCR, and PCR products were visualized by gel electrophoresis. c Kdr/VEGFR2 mRNA expression in TECs and NECs was evaluated by RT-qPCR. All results presented as mean ± SD; n = 3, **P < 0.001, ***P < 0.0001, by two-tailed unpaired Student’s t-test. d Images of the media with no cells and of the spent medium of TEC and NEC cultures after cells reached confluence; the extracellular pH of media was measured with a pH probe. e Comparison of the metabolomes of NECs and TECs cultured in complete medium (i.e., containing glucose, glutamine, and growth factors). f Lactate levels determined enzymatically in the media of cells cultured for 48 h. The lactate concentration was normalized to cell number. g Enzymatically determined lactate levels in supernatants of minced skin, kidney, and tumor tissues prepared immediately after resection. Lactate concentration was normalized to tissue weight (g). Results presented as mean ± SD; The experiment was independently repeated three times; *P < 0.05, **P < 0.001, by two-tailed unpaired Student’s t-test
Fig. 2
Fig. 2
TECs proliferate in low pH media in the presence of lactate. a TEC and NEC proliferation in sodium lactate-supplemented medium at indicated concentrations; the media pH (alkaline pH) was measured immediately before plates were placed in the incubator; cell proliferation was measured using the MTS assay after 72 h. Data represented as absorbances (b) TEC and NEC proliferation in lactic acid-supplemented medium at indicated concentrations; the media pH (decreasing pH) was measured immediately before plates were placed in the incubator; cell proliferation was measured using the MTS assay after 72 h. Data represented as fold change relative to 0 mM condition. c NEC proliferation in pH-adjusted, 20 mM lactic acid-supplemented medium; the media pH was adjusted to approximately 8 before application to the cells; cell proliferation was measured by the MTS assay after 72 h. Data represented as fold change relative to cells in media without pH adjustment. Results presented as mean ± SD. The experiment was independently repeated at least three times; *P < 0.05, **P < 0.001, ***P < 0.0001, by two-tailed unpaired Student’s t-test; N.S., not significant
Fig. 3
Fig. 3
Upregulated cytosolic carbonic anhydrases in TECs. a MCT1 mRNA expression in TECs and NECs was evaluated by RT-qPCR. b MCT1 protein levels in NECs and TECs analyzed by western blotting. c, d, e, f mRNA expression of the pH regulators CAIV, CAIX, CAII, and CAIII evaluated by RT-qPCR in TECs and NECs. g Cellular levels of CAII in NECs and TECs were confirmed by ELISA. h Double immunofluorescence staining for CD31 (red) and CAII (green) in normal mouse tissue (kidney) and A375-SM tumor xenografts. White arrows point to CAII-negative glomerulus and yellow arrowheads to CAII-positive tubules. White arrowheads indicate CAII-positive blood vessels in the A375-SM tumor. Merged image shows the localization of CAII (green) and CD31 (red), and DAPI (blue) Scale bar, 50 μm. i CAII expression in CD31-positive blood vessels in human RCCs (arrows) and absence in normal renal tissue blood vessels (arrowheads). Scale bar, 50 μm. Results presented as mean ± SD, **P < 0.001, by two-tailed unpaired Student’s t-test; N.S., not significant, n = 3)
Fig. 4
Fig. 4
TECs are more sensitive to carbonic anhydrase II inhibition. a, b MCT1 and CAII inhibition by siRNA knockdown in TECs was confirmed by RT-qPCR. c The proliferation of MCT1 and CAII knockdown TECs in complete medium measured by the MTS assay. The values refer to fold change relative to control siRNA-transfected cells. d, e MCT1 and CAII knockdown TECs were exposed to lactosis (20 mM lactate, pH 7.3) and lactic acidosis (20 mM lactate, pH 6.9), 24 h after knockdown. Cell proliferation was determined by the MTS assay. The values refer to the fold change relative to control siRNA-transfected cells. Results presented as mean ± SD, *P < 0.01, **P < 0.001; N.S., not significant, n = 3
Fig. 5
Fig. 5
Tumor-derived factors induce CAII upregulation in endothelial cells. a Human NECs (hNECs) were treated with tumor or control-conditioned medium for 24 h. CAII mRNA expression was determined by RT-qPCR. b hNECs were stimulated with 20 ng/mL VEGF for 24 h, and RNA was isolated. CAII expression was determined by RT-qPCR. (C) hNECs were exposed to tumor-CM or control CM containing 10 μM Ki8751 (VEGFR2 inhibitor) for 24 h. CAII expression was determined by RT-qPCR. d hNECs were stimulated with 20 ng/mL VEGF alone or in combination with 10 μM Ki8751 (VEGFR2 inhibitor) or 2 mg/mL bevacizumab (VEGF neutralizing antibody). The cells were cultured for 36 h, and the protein was collected for analysis by western blotting. All data presented as mean ± SD, *P < 0.01, **P < 0.001, by two-tailed unpaired Student’s t-test, n = 3
Fig. 6
Fig. 6
CAs’ pharmacological inhibition increased vessel maturity and decreased lung metastasis. a Tumor microvessel density (MVD) was analyzed by quantifying the CD31-positively stained area in tumor sections from each group by ImageJ. Blood vessel hotspots were selected (25 hotspots per treatment group). Representative images of tumor sections fixed and stained with anti-CD31 antibody (red) to identify the blood vessels and counterstained with DAPI (blue). Scale bar, 50 μm. b The microvessel pericyte coverage index (MPI) was analyzed by counting the vessels which stained positively for both CD31 and α-SMA (yellow arrowheads) among all CD31-positive vessels (yellow arrows) in blood vessel hotspots (15 hotspots per treatment group). Scale bar, 50 μm. c Images of whole tumors resected from the mice under each treatment condition after 27 days of drug treatment. d Tumor volume was calculated from the measurement obtained from the tumor-bearing mice using a pair of calipers. The measurements were taken on the indicated days. e Tumor metastasis was observed by detecting tumor cell luminescence intensity in the lungs (arrowhead) using IVIS spectrum. (F) Tumor hypoxia was measured by staining Glut1 expression in the tumor sections. The Glut1 staining was observed in the tumor cells. Scale bar, 100 μm. All data presented as mean ± SD, *P < 0.01, **P < 0.001 by ANOVA

Similar articles

Cited by

References

    1. Verheul HM, Voest EE, Schlingemann RO. Are tumours angiogenesis-dependent? J Pathol. 2004;202(1):5–13. doi: 10.1002/path.1473. - DOI - PubMed
    1. Hida K, Hida Y, Amin DN, Flint AF, Panigrahy D, Morton CC, et al. Tumor-associated endothelial cells with cytogenetic abnormalities. Cancer Res. 2004;64(22):8249–8255. doi: 10.1158/0008-5472.CAN-04-1567. - DOI - PubMed
    1. Ohga N, Ishikawa S, Maishi N, Akiyama K, Hida Y, Kawamoto T, et al. Heterogeneity of tumor endothelial cells: comparison between tumor endothelial cells isolated from high- and low-metastatic tumors. Am J Pathol. 2012;180(3):1294–1307. doi: 10.1016/j.ajpath.2011.11.035. - DOI - PubMed
    1. Maishi N, Ohba Y, Akiyama K, Ohga N, Hamada J, Nagao-Kitamoto H, et al. Tumour endothelial cells in high metastatic tumours promote metastasis via epigenetic dysregulation of biglycan. Sci Rep. 2016;6:28039. doi: 10.1038/srep28039. - DOI - PMC - PubMed
    1. Hellebrekers DMEI, Castermans K, Viré E, Dings RPM, Hoebers NTH, Mayo KH, et al. Epigenetic regulation of tumor endothelial cell Anergy: silencing of intercellular adhesion Molecule-1 by histone modifications. Cancer Res. 2006;66(22):10770. doi: 10.1158/0008-5472.CAN-06-1609. - DOI - PubMed

Publication types

LinkOut - more resources